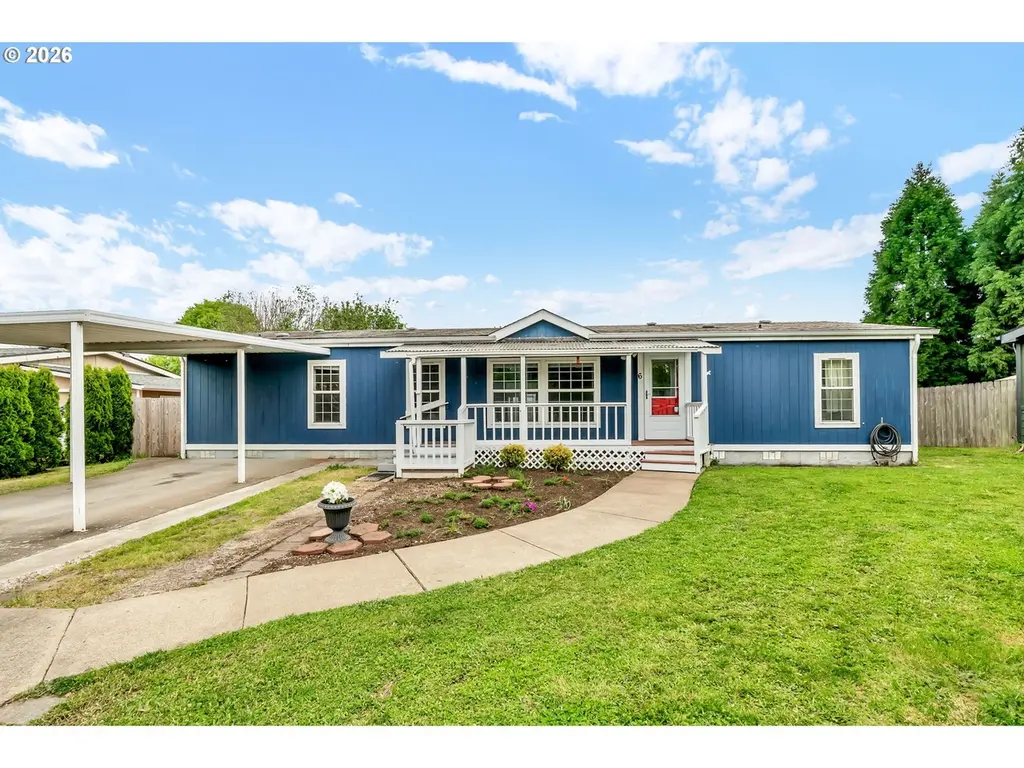
2333 N Terry St #6 · Eugene, OR
Flood risk 1/10 · Minimal
- FEMA flood zone
- X (unshaded)
- Chance of flooding over 30 yrs
- 0.0%
- Est. flood insurance / yr
- $507 – $1,088
Fire risk 4/10 · Minor
- Est. fire insurance / yr
- $498 – $926
Heat risk 4/10 · Minor
- Hot days now (above 92°F)
- 7 days/yr
- Hot days in 30 yrs
- 15 days/yr
Wind risk 1/10 · Minimal
- Chance of severe wind over 30 yrs
- —
Air-quality risk 10/10 · Severe
- Unhealthy air days now
- 13 days/yr
- Unhealthy air days in 30 yrs
- 14 days/yr
Risk factors via First Street. Map © Google.
Why this score? — see what drove the B+ grade
The composite is a weighted blend of 9 inputs, each scored 0–100. Each bar is that input's sub-score; the figure is the points it added to the 100-point composite (weight × sub-score).
- Cash flow +30.0/30.0
- ARV discount +15.0/15.0
- 1% rule +10.0/10.0
- DSCR +10.0/10.0
- Livability +4.0/5.0
- Rent growth +2.9/5.0
- Condition / age +2.5/5.0
- Schools +2.3/10.0
- Appreciation +0.0/10.0
$119,000
🖨 Deal sheet 📄 Offer letter ✓ Due diligence
Listing remarks MLS
Spacious 3 Bdr & 2 full bth mobile home w/ bonus room, laundry room, spacious bedrooms. Master has full bathroom & lots of space for your belongings. Easy to care for front and back fenced yard, cement enclosed large patio, large storage shed attached.
Key facts
- Breakfast nook
- Soaking tub
- Flex room
Tags
Property features AI
Finance
- HOA & community: HOA present (Rosewood/Rowan Oaks); Located in Rowan Oaks / Rosewood park; Park lot rent $820 monthly
Exterior
- Parking: Carport
- Utilities: Electric fuel; Public water; Public sewer
- Home design: Manufactured home in a park; Residential property (resale); Single-story (main level living); No view
- Construction: Built in 1996; Composition roof; Stem wall foundation
- Exterior features: T-111 siding; Concrete road access; Level lot
Interior
- Kitchen: Dishwasher; Free‑standing range; Free‑standing refrigerator; Electric hot water
- Bedrooms: Primary bedroom (main level); Second bedroom (main level); Third bedroom (main level)
- Bathrooms: Two full bathrooms (both on main level)
- Heating & cooling: Forced air heating; No cooling
- Interior features: Crawl space basement; Dining room; Family room; Living room; Great room
Neighborhood map
What this means for you Summary
Snapshot
- This is a 4-bed/2.0-bath manufactured listed at $119k.
Deal economics
- At list price, monthly cash flow is $1k ($13k/yr) — positive.
- The deal already cash-flows at list — no discount required.
- Meets the 1% rule at list price ($2k rent vs $119k).
- Cap rate 17.2% vs local median 2.8% in Eugene — top-decile yield for the area; either an underpriced asset or a hidden risk that comps aren't pricing in. Stress-test before assuming the spread holds.
Location & tenants
- Location reads 81/100 on livability (#52 in OR, #1,587 nationally) — a professional / high-income tenant draw. Strengths: amenities A+, commute A+, health & safety A+; Watch: employment C-, cost of living C-, crime D-.
- Bethel SD 52 (urban): math 18% / reading 34% proficiency, ranked #52 of 58 in OR (top 90%) — low school quality limits family demand, transient renter base, plan for 1-2y turnover.
- Zoned schools: Meadow View School (math 22% / reading 42%, grade F, #246 of 412 statewide, top 60%, 657 students, 66% FRL); Cascade Middle School (math 17% / reading 32%, grade F, #108 of 128 statewide, top 89%, 342 students, 65% FRL); Willamette High School (math 24% / reading 50%, grade F, #85 of 143 statewide, top 61%, 1,516 students, 35% FRL).
- Market conditions: Rents rising (+1.6%/yr); 297 active listings in the ZIP; 7 comparable units currently listed for rent nearby; rentals at typical pace (median 21d on market — plan ~3-4 weeks tenant-placement turnaround); 1,808 units permitted in Lane County in 2024 (972 in 5+ unit buildings).
- At $2,330/mo this rent would consume 48% of the median local household income ($58k/yr) (locally 3142% of renters already pay >50% of income on rent) — very limited rent-growth headroom before tenants either downsize or default.
Forward outlook
- Local home prices are declining (-3.0%/yr); year-one equity from $823 of loan paydown is wiped out by about $4k of value loss. Plan a longer hold.
- Lane County population projected at +15% by 2050 — long-run rental-demand tailwind backs the buy-and-hold thesis.
- At projected returns (-3.0% appreciation + 1.6% rent growth), your $33k cash investment doubles in ~4 years — after that, you're playing with house money.
Negotiation context
- Only 3 days on market — expect competitive offers; lowballing is unlikely to land.
- 2 sale attempts since 9y ago with the ask held roughly flat each time — persistent listings suggest the price (not the market) is what's stuck; bring a comps-based counter.
- Current owner paid $65k; list at $119k implies a 83% gain — meaningful room to come down on a strong offer.
Questions for the listing agent
- Is there a deadline driving the sale (1031 exchange, divorce, estate, relocation)? That informs how much negotiation room exists.
- Schools are B-rated — typically a magnet for longer-tenancy family renters. What's the average tenant stay here, and is there a school-zone premium baked into asking?
- Crime grade is D in this area — have there been break-ins, vandalism, or insurance claims at this property in the last 3 years? What carrier currently insures it and at what premium?
- What's the average days-on-market for RENTAL listings here right now (not sales)? A rising rental-DOM trend means longer vacancies and softer asking-rent achievability than the comps imply.
- What's the recent tenant-quality profile in this submarket — average credit score on applications, eviction rate, late-payment / NSF rate, and stable-employment percentage? A property-management company in the area should have these aggregated.
- How much new for-sale + rental construction is in the pipeline within 1–3 miles? Heavy new supply typically softens prices + rents 12–24 months out; constrained supply supports both.
Investment metrics
- 1% rule
- 1.96% ✓
- Cap rate
- 17.20%
- Cash-on-cash
- 38.97%
- DSCR
- 2.73
- GRM
- 4.3
CMA / ARV
- ARV (median comp)
- $148,250
- List price
- $119,000
- Delta
- -19.73%
- Verdict
- UNDERPRICED
- Comps
- 20 within 1.0 mi
Show comp detail 12 sales within ~0.75 mi
| Address | Dist | Beds/Ba | Sqft | Sold | Price | $/sf | Match |
|---|---|---|---|---|---|---|---|
| 2350 N Terry St #55 | 0.15mi | 3/2.0 (-1) | 1,508 (-4%) | 1mo | $95,000 | $63 | 81 |
| 2350 N Terry St #39 | 0.15mi | 4/2.0 | 1,512 (-4%) | 17mo | $132,500 | $88 | 73 |
| 2350 N Terry St #88 | 0.47mi | 3/2.0 (-1) | 1,512 (-4%) | 3mo | $152,000 | $101 | 65 |
| 2350 N Terry St #85 | 0.47mi | 3/2.0 (-1) | 1,620 (+3%) | 11mo | $165,000 | $102 | 58 |
| 2564 Rosebay St | 0.67mi | 3/2.0 (-1) | 1,512 (-4%) | 9mo | $172,500 | $114 | 50 |
| 5228 Harvest Loop | 0.65mi | 3/2.0 (-1) | 1,512 (-4%) | 13mo | $332,000 | $220 | 48 |
| 5380 Glenn Ellen Dr | 0.74mi | 3/2.0 (-1) | 1,512 (-4%) | 11mo | $355,000 | $235 | 46 |
| 5253 Glenn Ellen Dr | 0.60mi | 3/2.0 (-1) | 1,782 (+14%) | 6mo | $310,000 | $174 | 39 |
| 2350 N Terry St #59 | 0.47mi | 3/2.0 (-1) | 1,782 (+14%) | 17mo | $104,000 | $58 | 36 |
| 2570 Rosebay St | 0.69mi | 3/2.0 (-1) | 1,782 (+14%) | 10mo | $160,000 | $90 | 32 |
| 5244 Glenn Ellen Dr | 0.62mi | 3/2.0 (-1) | 1,782 (+14%) | 14mo | $360,000 | $202 | 32 |
| 5322 Burke St | 0.68mi | 3/2.0 (-1) | 1,782 (+14%) | 11mo | $338,000 | $190 | 32 |
Match score weights: distance 35% · size 25% · config 20% · recency 20%. Top-matched comps best support the ARV.
Projected returns pro-forma
-3.0% appreciation · 1.58% rent growth · sell at horizon
- IRR
- 33.6%
- Equity multiple
- 2.39×
- Total profit
- $46,344
- Equity at exit
- $17,743
- IRR
- 39.8%
- Equity multiple
- 4.48×
- Total profit
- $115,986
- Equity at exit
- $10,289
Cash invested: $33,320 (down + closing). Projections, not guarantees.
Landlord ↔ Tenant lean methodology
- Overall (STATE)
- 28 Tenant-Leaning
- State Oregon
- 28 Tenant-Leaning · D+6
- County
- — inherits STATE
- City
- — inherits STATE
ZIP-level market 97402
- Rents YoY
- 1.6%
- Active inventory
- 297
- Price-to-rent
- 4.3×
Monthly cashflow live
- Estimated rent
- $2,330 high interval (Pro) →
- Mortgage (P&I)
- −$624
- Tax from tax record
- −$85 /mo · $1,020/yr
- Insurance
- −$50
- HOA
- −$0
- Vacancy / Maint / Mgmt
- −$489
- Net cashflow
- $1,082
Break-even live
UW: 25.0% down · 7.5% · 30yr · 1.5% tax · 5.0% vac · 8.0% maint · 8.0% mgmt
Financing live
Cash to close
- Down payment
- $29,750
- Closing costs
- $3,570
- Reserves months
- —
- Total cash needed
- —
Loan-product check · same deal, 3 products live
Conventional
25% down · 7.5% · 30yr
- Down + closing
- —
- Monthly P&I
- —
- Monthly cashflow
- —
- DSCR
- —
- Eligible?
- —
Personal DTI + credit; lowest rate.
DSCR
20% down · 8.5% · 30yr
- Down + closing
- —
- Monthly P&I
- —
- Monthly cashflow
- —
- DSCR
- —
- Eligible?
- —
No personal income docs; deal must DSCR.
Hard money
10% down · 12.0% · 12mo
- Down + closing
- —
- Monthly P&I
- —
- Monthly cashflow
- —
- DSCR
- —
- Eligible?
- —
Short-term bridge; refi at stabilization.
Rent comps 7 comps
| Address | Beds | Baths | Sqft | Rent | $/sqft | DOM | Units | Dist |
|---|---|---|---|---|---|---|---|---|
| 2204 Assumption St Eugene, OR | 4.0 | 2.0 | 1488 | $2,300 | $1.55 | 21d | 1 | 0.30mi |
| 2077 Lemuria St Eugene, OR | 4.0 | 2.0 | 1400 | $1,995 | $1.43 | 43d | 1 | 0.39mi |
| 2083 Amirante St Eugene, OR | 3.0 | 2.0 | 1250 | $2,295 | $1.84 | 21d | 1 | 0.41mi |
| 2106 Golden Gardens St Eugene, OR | 3.0 | 1.0 | 1410 | $1,995 | $1.41 | 43d | 1 | 0.72mi |
| 1635 Hamlet Ln Eugene, OR | 3.0 | 2.5 | 1548 | $2,100 | $1.36 | 13d | 1 | 0.99mi |
| 1625 Hamlet Ln Eugene, OR | 3.0 | 2.5 | 1548 | $2,395 | $1.55 | 21d | 1 | 1.00mi |
| 4175 Quest Dr Eugene, OR | 1.0–3.0 | 1.0–2.0 | 983 | $2,095 | $2.13 | 13d | 6 | 1.26mi |
Listing history 5 events
-
2026-05-09status Pending 1506-char remark
-
2026-05-06$119,000 Active 1506-char remark
-
2017-11-14soldstatus $65,000 Sold 260-char remark
Show marketing remark (260 chars)
Spacious 3 Bdr & 2 full bth mobile home w/ bonus room, laundry room, spacious bedrooms. Master has full bathroom & lots of space for your belongings. Easy to care for front and back fenced yard, cement enclosed large patio, large storage shed attached.
-
2017-11-02status Pending 260-char remark
Show marketing remark (260 chars)
Spacious 3 Bdr & 2 full bth mobile home w/ bonus room, laundry room, spacious bedrooms. Master has full bathroom & lots of space for your belongings. Easy to care for front and back fenced yard, cement enclosed large patio, large storage shed attached.
-
2017-10-27$65,000 Active 260-char remark
Show marketing remark (260 chars)
Spacious 3 Bdr & 2 full bth mobile home w/ bonus room, laundry room, spacious bedrooms. Master has full bathroom & lots of space for your belongings. Easy to care for front and back fenced yard, cement enclosed large patio, large storage shed attached.
ⓘ Source: listings_history table (triggers on properties + properties_extension) + one-shot
backfill from property_details.listing_events for pre-trigger history.
Tax reassessment forecast OR · Resets to sale price
- Current annual tax
- $1,020 · $85/mo
- Projected year-2 tax
- $1,154 · $96/mo
- Expected delta
- +$134/yr (+$11/mo · 13.2%)
ⓘ Screening estimate from a state-policy table — verify with the county assessor before closing.
Climate risk First Street
- Flood 1/10 Low FEMA zone X (unshaded) · 0% chance over 30 yrs
- Wildfire 4/10 Moderate
- Heat 4/10 Moderate 7 d/yr ≥92°F today · 15 d/yr by 30 yrs out
- Wind 1/10 Low
- Air quality 10/10 Extreme 13 unhealthy d/yr today · 14 by 30 yrs out
Nearby sold comps map
Loading sold comps map…
Walkable amenities ~0.75 mi
Loading nearby amenities…
Taxation est. · year 1
- Rental income
- $27,959
- − Mortgage interest
- −$6,666
- − Property taxes
- −$1,020
- − Insurance
- −$595
- − Repairs & maintenance
- −$2,237
- − Management
- −$2,237
- − Depreciation
- −$3,462
- Taxable income
- $11,743
- Est. tax owed @ 24.0%
- −$2,818
- After-tax cash flow
- $10,166/yr
For passive investors: Depreciation is non-cash, so a rental often shows a tax loss while cash-flowing — sheltering income. Rental losses are passive: they offset passive income freely, and up to $25,000/yr can offset ordinary (W-2) income if you actively participate and your MAGI is under $100k (phasing out to $0 by $150k); unused losses carry forward. On sale, claimed depreciation is recaptured at up to 25%, and gains may owe capital-gains tax (a 1031 exchange can defer both). Figures are a year-1 estimate at your 24.0% rate — not tax advice; consult a CPA.
Schools (NCES district)
- District
- Bethel SD 52
- NCES district ID
- 4102040
- Math proficiency
- 18% ▼ -14.00%
- Reading proficiency
- 34% ▼ -14.00%
- Median HH income
- $47,860
- Composite
- 22.62/100
- National rank
- #8066
- State rank
- #52 of 58 in OR
Livability — Eugene
- Score
- 81/100
- State rank
- #52
- US rank
- #1587
Category grades
Schools grade is shown separately in the Schools card above.
Census & demographics
- Census place
- Eugene, OR
- County
- Lane County · 310,476 people
- City population
- 215,212
- Metro
- Eugene-Springfield, OR
- Population (ZIP)
- 53,823
- Household income
- $57,658
- Rent vs Own
- Severe rent burden
- 3142.0
Population outlook (Lane County) Hauer SSP2
- Today (2025)
- 391,933 people
- By 2030
- 405,860 · +3.6%
- By 2040
- 429,386 · +9.6%
- By 2050
- 452,016 · +15.3%
- By 2075
- 508,825 · +29.8%
- By 2100
- 531,208 · +35.5%
Race, ethnicity, and origin ACS 2023
- Neighborhood character
- Predominantly White (72%)
- Race & ethnicity
- White 72% Hispanic / Latino 17% Two or more races 11% Asian 2% Black 2%
- Hispanic origin (detail)
- Mexican 12%
- Common ancestry
- Italian 4% Lithuanian 3% Portuguese 3%
- Foreign-born
- 7% · Canada, China, Vietnam
- Languages at home
- 88% English-only · Spanish 9% Other Indo-European 1%
Political lean MEDSL · Lane
- 2024 margin
- Strong D (+23.1) · D 60.0% · R 36.9% · Other 3.1%
- 2008→2024 swing
- -4.3pp toward R · 2008: 27.4pp · 2024: 23.1pp
- All cycles
- 2024: D+23.1 2020: D+24.3 2016: D+18.9 2012: D+23.4 2008: D+27.4
Not yet ingested
- Civics
- —
Market trends
- HPI YoY
- ▼ -437.20%
- Current HPI
- 298.1167
- Rent YoY
- ▲ 1.58%
- Metro
- Eugene-Springfield, OR
- State GDP YoY
- ▲ 2.05%
- F500 in state
- 2
Industry mix (Fortune 500 HQ in OR)
| Industry | F500 HQs | Revenue |
|---|---|---|
| Consumer Goods | 1 | $51B |
|
||
Price history
+83.1% since first listed5 events — show timeline
- 2026-05-09 Pending — RMLS
- 2026-05-06 Listed $119,000 RMLS
- 2017-11-14 Sold (MLS) $65,000 RMLS
- 2017-11-02 Pending — RMLS
- 2017-10-27 Listed $65,000 RMLS
Property tax history
+4.1%/yrLatest (2025): $1,020 · +2.6% YoY. Source: county tax records.
Cash-flow waterfall
monthlySold comps — $/sqft
last 12 mo · ≤1 miLoading sold comps…