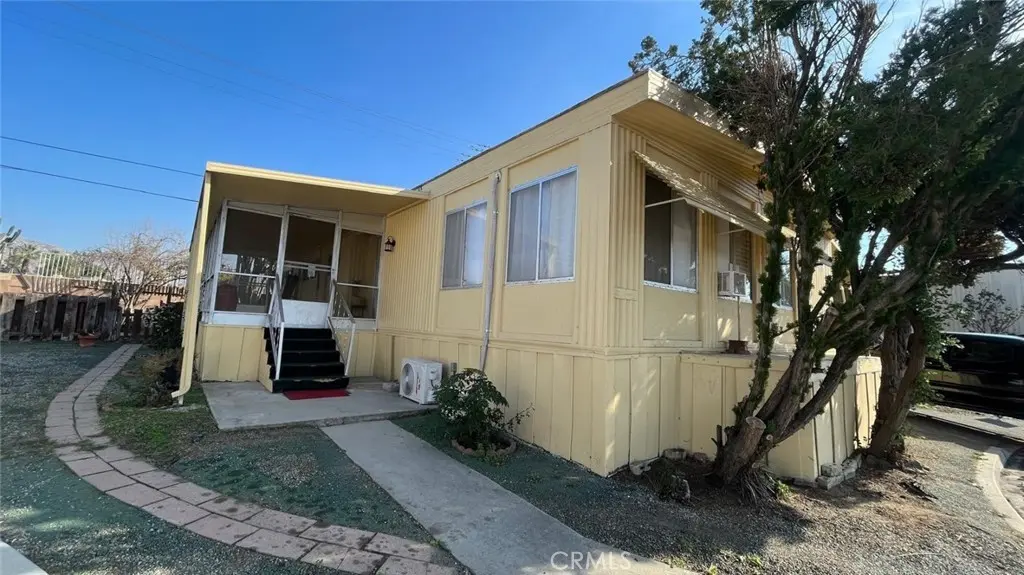
36 ROUND TABLE Dr #36 · Riverside, CA
Flood risk 3/10 · Minor
- FEMA flood zone
- X (unshaded)
- Chance of flooding over 30 yrs
- 0.2%
- Est. flood insurance / yr
- $507 – $1,088
Fire risk 7/10 · Major
- Est. fire insurance / yr
- $659 – $1,223
Heat risk 8/10 · Major
- Hot days now (above 101°F)
- 7 days/yr
- Hot days in 30 yrs
- 19 days/yr
Wind risk 1/10 · Minimal
- Chance of severe wind over 30 yrs
- —
Air-quality risk 9/10 · Severe
- Unhealthy air days now
- 22 days/yr
- Unhealthy air days in 30 yrs
- 27 days/yr
Risk factors via First Street. Map © Google.
Why this score? — see what drove the B+ grade
The composite is a weighted blend of 9 inputs, each scored 0–100. Each bar is that input's sub-score; the figure is the points it added to the 100-point composite (weight × sub-score).
- Cash flow +30.0/30.0
- ARV discount +15.0/15.0
- 1% rule +10.0/10.0
- DSCR +10.0/10.0
- Schools +4.1/10.0
- Livability +3.3/5.0
- Rent growth +2.6/5.0
- Condition / age +2.2/5.0
- Appreciation +0.0/10.0
$95,000
🖨 Deal sheet (PDF) 📄 Offer letter ✓ Due diligence
Key facts
- 3 garage spots
- Community pool
- Built 1968
Property features AI
Finance
- Other: Manager approval required for occupancy; Pets allowed—contact manager
- Financial info: Land lease property — tenant/owner pays monthly land lease
- HOA & community: Rent includes all utilities; Land lease of $1,900 monthly (park provided)
Exterior
- Parking: Attached carport; 3 parking spaces (including 3 garage/carport spaces)
- Utilities: Standard electrical service; Public sewer; District / public water
- Home design: Mobile home remaining on site; Double-wide mobile body; Single-story
- Construction: Pier jacks foundation; Mobile home dimensions approximately 60' x 24'; Year built source: Builder
- Exterior features: Community pool; Park located in a suburban community; 36-40 units per acre density
Interior
- Flooring: Laminate flooring
- Bathrooms: 2 full bathrooms
- Interior features: One-level home; Entry at main level; Community spa
- Laundry & utility: Inside laundry; Community laundry
Neighborhood map
What this means for you Summary
Snapshot
- This is a 3-bed/2.0-bath manufactured listed at $95k. Condition is rated fair.
Deal economics
- At list price, monthly cash flow is $1k ($16k/yr) — positive.
- The deal already cash-flows at list — no discount required.
- Meets the 1% rule at list price ($3k rent vs $95k).
- Recommended offer: $94k (1.5% below list) — sets the bar for market timing.
- Cap rate 23.0% vs local median 3.0% in Riverside — top-decile yield for the area; either an underpriced asset or a hidden risk that comps aren't pricing in. Stress-test before assuming the spread holds.
Location & tenants
- Location reads 66/100 on livability (#337 in CA) — a middle-class / working-renter tenant base. Strengths: housing A+, employment A-, commute B+; Watch: schools C-, health & safety D, crime F.
- Riverside Unified (urban): math 36% / reading 51% proficiency, ranked #574 of 1,400 in CA (top 41%) — families likely to look elsewhere, expect single-tenant / working-renter base with shorter leases.
- Market conditions: Rents flat; 159 active listings in the ZIP; 29 comparable units currently listed for rent nearby; rentals at typical pace (median 26d on market — plan ~3-4 weeks tenant-placement turnaround); 48% of comp listings sitting > 30 days — soft ceiling on asking rent; solid renter incomes; 9,195 units permitted in Riverside County in 2024 (1,512 in 5+ unit buildings).
- This rent runs 40% of the median local income ($75k/yr) — at the standard rent-burdened threshold; future hikes will face affordability resistance.
Forward outlook
- Local home prices are declining (-3.0%/yr); year-one equity from $657 of loan paydown is wiped out by about $3k of value loss. Plan a longer hold.
- Riverside County population projected at +22% by 2050 — long-run rental-demand tailwind backs the buy-and-hold thesis.
- At projected returns (-3.0% appreciation + 0.5% rent growth), your $27k cash investment doubles in ~2 years — after that, you're playing with house money.
Negotiation context
- It's been on market 18 days — a 2% lower offer ($94k) is reasonable based on typical stale-listing flexibility.
- 5 sale attempts since 3y ago with the ask held roughly flat each time — persistent listings suggest the price (not the market) is what's stuck; bring a comps-based counter.
Risks & watch-outs
- Climate carrying-cost: major wildfire risk; extreme-heat days projected 7→19/yr by 2055 (HVAC capex compounding) — expect insurance premiums to compound above CPI over the hold.
Questions for the listing agent
- Have any recent inspections been done? Can we get a copy of the seller's disclosures and any deferred-maintenance estimates?
- Built in 1968 — when were the roof, HVAC, electrical panel, plumbing, and water heater last replaced?
- Is there a deadline driving the sale (1031 exchange, divorce, estate, relocation)? That informs how much negotiation room exists.
- Crime grade is F in this area — have there been break-ins, vandalism, or insurance claims at this property in the last 3 years? What carrier currently insures it and at what premium?
- What's the average days-on-market for RENTAL listings here right now (not sales)? A rising rental-DOM trend means longer vacancies and softer asking-rent achievability than the comps imply.
- What's the recent tenant-quality profile in this submarket — average credit score on applications, eviction rate, late-payment / NSF rate, and stable-employment percentage? A property-management company in the area should have these aggregated.
- How much new for-sale + rental construction is in the pipeline within 1–3 miles? Heavy new supply typically softens prices + rents 12–24 months out; constrained supply supports both.
Investment metrics
- 1% rule
- 2.64% ✓
- Cap rate
- 23.01%
- Cash-on-cash
- 59.69%
- DSCR
- 3.66
- GRM
- 3.2
CMA / ARV
- ARV (on-the-fly)
- $180,000
- Comps found
- 8
Show comp detail 8 sales within ~0.75 mi
| Address | Dist | Beds/Ba | Sqft | Sold | Price | $/sf | Match |
|---|---|---|---|---|---|---|---|
| 1560 Massachussetts Ave #94 | 0.17mi | 3/2.0 | 1,300 (-10%) | 0mo | $185,000 | $142 | 76 |
| 1560 Massachusetts Ave #138 | 0.18mi | 3/2.0 | 1,440 (0%) | 20mo | $179,900 | $125 | 74 |
| 168 Sir Gawaine | 0.33mi | 4/2.0 (+1) | 1,499 (+4%) | 6mo | $165,000 | $110 | 68 |
| 79 Round Table Dr | 0.13mi | 2/2.0 (-1) | 1,344 (-7%) | 16mo | $110,000 | $82 | 65 |
| 98 Sir Galahad Dr | 0.10mi | 3/2.0 | 1,248 (-13%) | 13mo | $159,900 | $128 | 62 |
| 112 Sir Tristram Dr | 0.09mi | 4/2.0 (+1) | 1,632 (+13%) | 12mo | $147,500 | $90 | 59 |
| 2595 Atlanta Ave #19 | 0.23mi | 3/2.0 | 1,344 (-7%) | 24mo | $190,000 | $141 | 58 |
| 2 Round Table Dr | 0.16mi | 2/2.0 (-1) | 1,224 (-15%) | 19mo | $121,000 | $99 | 47 |
Match score weights: distance 35% · size 25% · config 20% · recency 20%. Top-matched comps best support the ARV.
Projected returns pro-forma
-3.0% appreciation · 0.53% rent growth · sell at horizon
- IRR
- 55.6%
- Equity multiple
- 3.36×
- Total profit
- $62,838
- Equity at exit
- $14,165
- IRR
- 59.7%
- Equity multiple
- 6.25×
- Total profit
- $139,649
- Equity at exit
- $8,214
Cash invested: $26,600 (down + closing). Projections, not guarantees.
Landlord ↔ Tenant lean methodology
- Overall (STATE)
- 18 Strongly Tenant-Friendly
- State California
- 18 Strongly Tenant-Friendly · D+13
- County
- — inherits STATE
- City
- — inherits STATE
ZIP-level market 92507
- Rents YoY
- 0.5%
- Active inventory
- 159
- Price-to-rent
- 3.2×
Monthly cashflow live
- Estimated rent
- $2,506 high interval (Pro) →
- Mortgage (P&I)
- −$498
- Tax est. 1.5%
- −$119 /mo · $1,425/yr
- Insurance
- −$40
- HOA
- −$0
- Vacancy / Maint / Mgmt
- −$526
- Net cashflow
- $1,323
Break-even live
Sensitivity live
| Price | -10% $1,389 | -5% $1,356 | +0% $1,323 | +5% $1,290 | +10% $1,258 |
|---|---|---|---|---|---|
| Rent | -10% $1,125 | -5% $1,224 | +0% $1,323 | +5% $1,422 | +10% $1,521 |
| Rate | -1.0pp $1,371 | -0.5pp $1,347 | base $1,323 | +0.5pp $1,299 | +1.0pp $1,273 |
UW: 25.0% down · 7.5% · 30yr · 1.5% tax · 5.0% vac · 8.0% maint · 8.0% mgmt
Financing live
Cash to close
- Down payment
- $23,750
- Closing costs
- $2,850
- Reserves months
- —
- Total cash needed
- —
Loan-product check · same deal, 3 products live
Conventional
25% down · 7.5% · 30yr
- Down + closing
- —
- Monthly P&I
- —
- Monthly cashflow
- —
- DSCR
- —
- Eligible?
- —
Personal DTI + credit; lowest rate.
DSCR
20% down · 8.5% · 30yr
- Down + closing
- —
- Monthly P&I
- —
- Monthly cashflow
- —
- DSCR
- —
- Eligible?
- —
No personal income docs; deal must DSCR.
Hard money
10% down · 12.0% · 12mo
- Down + closing
- —
- Monthly P&I
- —
- Monthly cashflow
- —
- DSCR
- —
- Eligible?
- —
Short-term bridge; refi at stabilization.
Rent comps 29 comps
| Address | Beds | Baths | Sqft | Rent | $/sqft | DOM | Units | Dist |
|---|---|---|---|---|---|---|---|---|
| 2770 Atlanta Ave Riverside, CA | 2.0 | 1.0 | 910 | $2,030 | $2.23 | 3d | 1 | 0.14mi |
| 1201 W Blaine St Riverside, CA | 1.0–2.0 | 1.0 | 921 | $2,160 | $2.35 | 3d | 7 | 0.24mi |
| 1251 Massachusetts Ave Riverside, CA | 1.0–2.0 | 1.0–2.0 | 785 | $2,300 | $2.93 | 45d | 7 | 0.25mi |
| 1370 Wheaton Way Riverside, CA | 3.0 | 2.0 | 1170 | $2,595 | $2.22 | 45d | 1 | 0.26mi |
| 1301 Wheaton Way Riverside, CA | 3.0 | 2.0 | 1152 | $2,750 | $2.39 | 3d | 1 | 0.29mi |
| 2442 Iowa Ave Riverside, CA | 2.0 | 1.0–1.5 | 743 | $2,551 | $3.43 | 0d | 17 | 0.30mi |
| 1175 W Blaine St Riverside, CA | 1.0–2.0 | 1.0–2.0 | 790 | $2,220 | $2.81 | 0d | 5 | 0.33mi |
| 1046 Spruce St Riverside, CA | 1.0–2.0 | 1.0–2.0 | 780 | $2,400 | $3.08 | 45d | 1 | 0.46mi |
| 1011 Minerva Ct Riverside, CA | 4.0 | 2.0 | 1320 | $3,000 | $2.27 | 45d | 1 | 0.49mi |
| 1170 Tripoli St Riverside, CA | 2.0–3.0 | 1.0–2.0 | 837 | $1,380 | $1.65 | 45d | 1 | 0.49mi |
| 3429 Rustin Ave Riverside, CA | 2.0–3.0 | 2.0 | 1080 | $3,045 | $2.82 | 0d | 4 | 0.50mi |
| 1120 W Linden St Riverside, CA | 1.0–2.0 | 1.0–2.0 | 750 | $2,260 | $3.01 | 0d | 11 | 0.62mi |
| 3472 Anderson Ave Unit 02N Riverside, CA | 2.0 | 1.5 | 925 | $1,950 | $2.11 | 4d | 1 | 0.66mi |
| 3170 Canyon Crest Dr Riverside, CA | 1.0–2.0 | 1.0–1.5 | 575 | $2,502 | $4.35 | 45d | 1 | 0.72mi |
| 807 W Blaine St Riverside, CA | 2.0 | 2.0 | 912 | $2,275 | $2.49 | 45d | 1 | 0.73mi |
| 1400 University Ave Unit D404 Riverside, CA | 4.0 | 4.0 | 1100 | $999 | $0.91 | 45d | 1 | 0.75mi |
| 1415 Everton Pl Riverside, CA | 3.0 | 2.0 | 1152 | $1,000 | $0.87 | 45d | 1 | 0.79mi |
| 1471 Everton Pl Riverside, CA | 3.0 | 2.0 | 1152 | $2,400 | $2.08 | 45d | 1 | 0.80mi |
| 1424 Everton Pl Riverside, CA | 3.0 | 2.0 | 1152 | $2,700 | $2.34 | 19d | 1 | 0.82mi |
| 3996 Iowa Ave Riverside, CA | 3.0 | 1.0–8.0 | 687 | $1,950 | $2.84 | 14d | 1 | 0.83mi |
| 1966 W Linden St Riverside, CA | 2.0 | 1.5 | 1000 | $2,100 | $2.10 | 14d | 1 | 0.86mi |
| 1966 W Linden St Unit 1960 Riverside, CA | 2.0 | 1.5 | 1000 | $2,100 | $2.10 | 25d | 1 | 0.86mi |
| 3077 Wendell Way Riverside, CA | 3.0 | 2.0 | 1078 | $2,950 | $2.74 | 5d | 1 | 0.97mi |
| 3523 Strong St Riverside, CA | 3.0 | 2.0 | 1126 | $3,200 | $2.84 | 11d | 1 | 1.36mi |
| 3516 Tyco Dr Riverside, CA | 2.0 | 2.0 | 1037 | $2,600 | $2.51 | 45d | 1 | 1.40mi |
| 3452 Mulberry St Unit 2 Riverside, CA | 2.0 | 1.0 | 927 | $1,795 | $1.94 | 45d | 1 | 1.47mi |
| 239 Deborah Ct Riverside, CA | 3.0 | 2.0 | 1627 | $2,900 | $1.78 | 45d | 1 | 1.48mi |
| 1151 Clark St Riverside, CA | 4.0 | 2.0 | 1248 | $2,800 | $2.24 | 45d | 1 | 1.48mi |
| 3050 Mission Inn Ave Riverside, CA | 2.0 | 1.0–2.0 | 700 | $2,675 | $3.82 | 5d | 10 | 1.49mi |
Listing history 11 events
-
2026-06-21days on market $95,000 Active 18 DOM
-
2026-06-18days on market $95,000 Active 15 DOM
-
2026-06-17days on market $95,000 Active 14 DOM
-
2026-06-16days on market $95,000 Active 13 DOM
-
2026-06-15days on market $95,000 Active 12 DOM
-
2026-06-13days on market $95,000 Active 10 DOM
-
2026-06-13days on market $95,000 Active 9 DOM
-
2026-06-09days on market $95,000 Active 6 DOM
-
2026-06-08days on market $95,000 Active 5 DOM
-
2026-06-07days on market $95,000 Active 4 DOM
-
2026-06-04$95,000 Active 1 DOM
ⓘ Source: listings_history table (triggers on properties + properties_extension) + one-shot
backfill from property_details.listing_events for pre-trigger history.
Climate risk First Street
- Flood 3/10 Moderate FEMA zone X (unshaded) · 20% chance over 30 yrs
- Wildfire 7/10 Severe
- Heat 8/10 Severe 7 d/yr ≥101°F today · 19 d/yr by 30 yrs out
- Wind 1/10 Low
- Air quality 9/10 Extreme 22 unhealthy d/yr today · 27 by 30 yrs out
Nearby sold comps map
Loading sold comps map…
Walkable amenities ~0.75 mi
Loading nearby amenities…
Taxation est. · year 1
- Rental income
- $30,071
- − Mortgage interest
- −$5,321
- − Property taxes
- −$1,425
- − Insurance
- −$475
- − Repairs & maintenance
- −$2,406
- − Management
- −$2,406
- − Depreciation
- −$2,764
- Taxable income
- $15,275
- Est. tax owed @ 24.0%
- −$3,666
- After-tax cash flow
- $12,212/yr
For passive investors: Depreciation is non-cash, so a rental often shows a tax loss while cash-flowing — sheltering income. Rental losses are passive: they offset passive income freely, and up to $25,000/yr can offset ordinary (W-2) income if you actively participate and your MAGI is under $100k (phasing out to $0 by $150k); unused losses carry forward. On sale, claimed depreciation is recaptured at up to 25%, and gains may owe capital-gains tax (a 1031 exchange can defer both). Figures are a year-1 estimate at your 24.0% rate — not tax advice; consult a CPA.
Condition & rehab AI · 12 photos
This manufactured home requires moderate repairs and maintenance, with potential for significant value increase through exterior painting and interior updates.
Repairs flagged
- Minor exterior siding — Some discoloration
- Minor interior paint — Some wear
Value-add opportunities
- Both paint exterior — Enhances curb appeal and value
- Both replace carpet — Improves comfort and value
- Both update kitchen cabinets — Modernizes and increases value
- Both update bathrooms — Modernizes and increases value
Renovation cost estimate screening
| Repair item | Severity | Est. cost |
|---|---|---|
| exterior siding · Some discoloration | Minor | $500–3,000 |
| interior paint · Some wear | Minor | $500–3,000 |
| Total estimated repair cost · 2 items | $1,000–6,000 |
Value-add ROI direction
- Both paint exterior — Enhances curb appeal and value ↑
- Both replace carpet — Improves comfort and value ↑
- Both update kitchen cabinets — Modernizes and increases value ↑
- Both update bathrooms — Modernizes and increases value ↑
ⓘ Cost ranges are severity-bucket heuristics (US national rule-of-thumb). Get contractor quotes + a written scope before underwriting a rehab budget.
Schools (NCES district)
- District
- Riverside Unified
- NCES district ID
- 0633150
- Math proficiency
- 36% ▲ 1.00%
- Reading proficiency
- 51% ▲ 2.00%
- Median HH income
- $62,038
- Composite
- 40.8/100
- National rank
- #7563
- State rank
- #574 of 1400 in CA
Livability — Riverside
- Score
- 66/100
- State rank
- #337
- US rank
- #11613
Category grades
Schools grade is shown separately in the Schools card above.
Census & demographics
- Census place
- Riverside, CA
- County
- Riverside County · 2,287,001 people
- City population
- 367,890
- Metro
- Riverside-San Bernardino-Ontario, CA
- Population (ZIP)
- 64,015
- Household income
- $75,303
- Rent vs Own
- Severe rent burden
- 3590.0
Population outlook (Riverside County) Hauer SSP2
- Today (2025)
- 2,664,475 people
- By 2030
- 2,802,692 · +5.2%
- By 2040
- 3,050,904 · +14.5%
- By 2050
- 3,256,783 · +22.2%
- By 2075
- 3,655,058 · +37.2%
- By 2100
- 3,766,594 · +41.4%
Race, ethnicity, and origin ACS 2023
- Neighborhood character
- Diverse neighborhood (Simpson 0.66)
- Race & ethnicity
- Hispanic / Latino 52% White 21% Asian 14% Two or more races 13% Black 9% Native American 1%
- Hispanic origin (detail)
- Mexican 44%
- Common ancestry
- Italian 2% Lithuanian 1% Ukrainian 1%
- Foreign-born
- 23% · Canada, China, South Korea
- Languages at home
- 52% English-only · Spanish 36% Chinese 4% Other Indo-European 3%
Political lean MEDSL · Riverside
- 2024 margin
- Toss-up / Even · D 48.0% · R 49.3% · Other 2.6%
- 2008→2024 swing
- -3.6pp toward R · 2008: 2.3pp · 2024: -1.3pp
- All cycles
- 2024: R+1.3 2020: D+8.0 2016: D+4.3 2012: R+0.4 2008: D+2.3
Not yet ingested
- Civics
- —
Market trends
- HPI YoY
- ▼ -401.54%
- Current HPI
- 442.9617
- Rent YoY
- ▲ 0.53%
- Metro
- Riverside-San Bernardino-Ontario, CA
- State GDP YoY
- ▲ 3.21%
- F500 in state
- 116
Industry mix (Fortune 500 HQ in CA)
| Industry | F500 HQs | Revenue |
|---|---|---|
| Technology | 27 | $1,492B |
|
||
| Financial Services | 3 | $174B |
|
||
| Retail | 3 | $44B |
|
||
| Insurance | 3 | $26B |
|
||
| Media / Entertainment | 2 | $115B |
|
||
| Pharmaceuticals / Biotech | 2 | $62B |
|
||
Price history
-32.1% since first listed11 events — show timeline
- 2026-06-03 Listed $95,000 CRMLS
- 2025-07-12 Listing Removed — CRMLS
- 2025-07-03 Price Changed $119,999 CRMLS
- 2025-07-02 Listed $11,900 CRMLS
- 2024-05-14 Listing Removed — CRMLS
- 2024-03-15 Price Changed $119,999 CRMLS
- 2024-03-13 Listed $124,999 CRMLS
- 2024-01-25 Listed $120,000 CRMLS
- 2024-01-25 Listing Removed — CRMLS
- 2023-12-22 Listing Removed — CRMLS
- 2023-12-22 Listed $139,999 CRMLS
Cash-flow waterfall
monthlySold comps — $/sqft
last 12 mo · ≤1 miLoading sold comps…