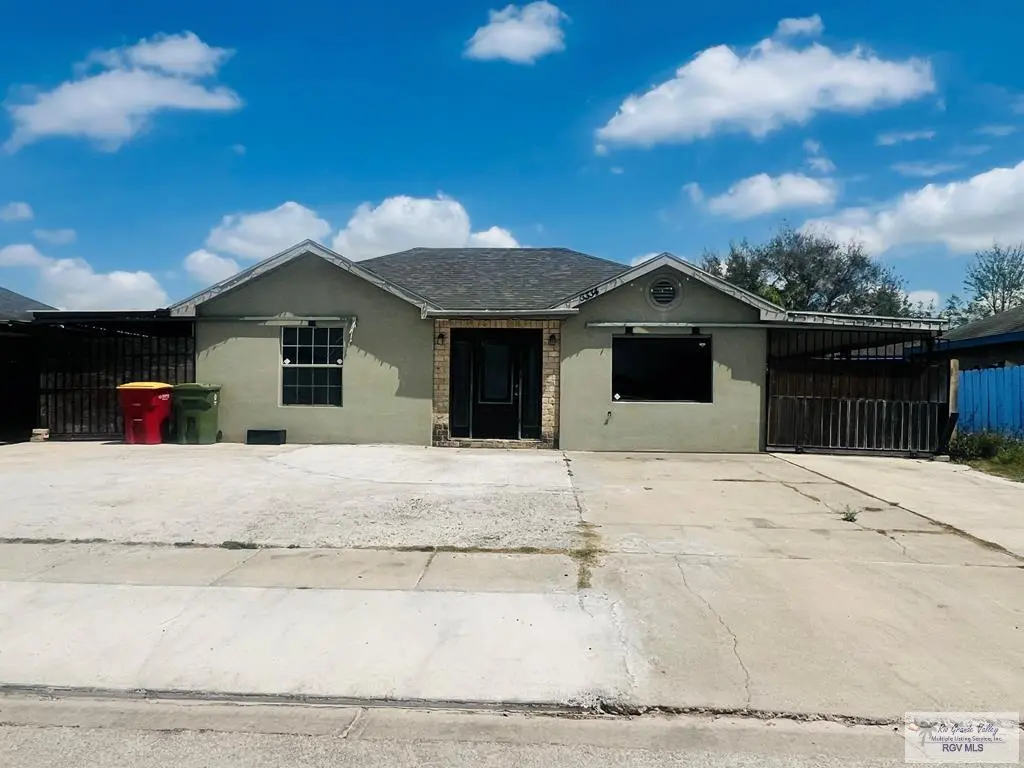
6334 Achievement Ave · Brownsville, TX
Flood risk 1/10 · Minimal
- FEMA flood zone
- X (unshaded)
- Chance of flooding over 30 yrs
- 0.0%
- Est. flood insurance / yr
- $507 – $1,088
Fire risk 5/10 · Moderate
- Est. fire insurance / yr
- $1,222 – $2,270
Heat risk 9/10 · Severe
- Hot days now (above 110°F)
- 7 days/yr
- Hot days in 30 yrs
- 26 days/yr
Wind risk 9/10 · Severe
- Chance of severe wind over 30 yrs
- 99.0%
Air-quality risk 2/10 · Minimal
- Unhealthy air days now
- 1 days/yr
- Unhealthy air days in 30 yrs
- 1 days/yr
Risk factors via First Street. Map © Google.
Why this score? — see what drove the C grade
The composite is a weighted blend of 9 inputs, each scored 0–100. Each bar is that input's sub-score; the figure is the points it added to the 100-point composite (weight × sub-score).
- Cash flow +18.5/30.0
- ARV discount +15.0/15.0
- 1% rule +5.8/10.0
- DSCR +5.8/10.0
- Livability +4.0/5.0
- Schools +3.3/10.0
- Rent growth +3.2/5.0
- Condition / age +2.5/5.0
- Appreciation +0.0/10.0
$189,000
🖨 Deal sheet 📄 Offer letter ✓ Due diligence
Listing remarks MLS
Cozy 3-bedroom, 2-bath home with a versatile bonus room perfect as a home office, or game room! This property offers two covered carports, providing ample space for multiple vehicles, a boat, or work equipment. The flexible layout makes it ideal for families, first-time buyers, or those working from home. Enjoy comfortable living with plenty of space to grow and customize. Conveniently located near schools, shopping, and everyday essentials. A great opportunity to own a home with extra functionality and value!
Key facts
- 5,782 sq ft lot
- Built 2018
- Listed 78 days
Neighborhood map
What this means for you Summary
Snapshot
- This is a 3-bed/2.0-bath single-family listed at $189k.
Deal economics
- At list price, monthly cash flow is $180 ($2k/yr) — positive.
- The deal already cash-flows at list — no discount required.
- Meets the 1% rule at list price ($2k rent vs $189k).
- Recommended offer: $178k (6.0% below list) — sets the bar for market timing.
- Cap rate 7.4% vs local median 5.0% in Brownsville — top-decile yield for the area; either an underpriced asset or a hidden risk that comps aren't pricing in. Stress-test before assuming the spread holds.
Location & tenants
- Location reads 79/100 on livability (#62 in TX, #2,311 nationally) — a middle-class / working-renter tenant base. Strengths: commute A+, cost of living A+, housing A+; Watch: schools C-, amenities D, crime D-.
- Los Fresnos CISD (suburban): math 34% / reading 44% proficiency, ranked #444 of 826 in TX (top 54%) — families likely to look elsewhere, expect single-tenant / working-renter base with shorter leases.
- Market conditions: Rents rising (+2.8%/yr); 413 active listings in the ZIP; 18 comparable units currently listed for rent nearby; rentals at typical pace (median 21d on market — plan ~3-4 weeks tenant-placement turnaround); 2,326 units permitted in Cameron County in 2024 (503 in 5+ unit buildings).
- This rent runs 35% of the median local income ($71k/yr) — at the standard rent-burdened threshold; future hikes will face affordability resistance.
Forward outlook
- Local home prices are declining (-3.0%/yr); year-one equity from $1k of loan paydown is wiped out by about $6k of value loss. Plan a longer hold.
- Cameron County population projected at +3% by 2050 — modest demand growth; plan on rents tracking national, not racing it.
Negotiation context
- It's been on market 78 days — a 6% lower offer ($178k) is reasonable based on typical stale-listing flexibility.
- 2 sale attempts since 6y ago; this cycle's ask has dropped $21k (10%) from the opening price — seller is motivated, your offer sets the floor, not the list.
Risks & watch-outs
- Climate carrying-cost: severe wind risk, 99% chance of damaging wind over 30y; moderate wildfire risk; extreme-heat days projected 7→26/yr by 2055 (HVAC capex compounding) — expect insurance premiums to compound above CPI over the hold.
Questions for the listing agent
- It's been on market 78 days. Have you received any prior offers? Is the seller open to a 6% concession, seller financing, or rate buy-down credit?
- Why hasn't it sold? Are there any deal-killer items the seller is aware of (foundation, flood, title, zoning, code violations)?
- Is there a deadline driving the sale (1031 exchange, divorce, estate, relocation)? That informs how much negotiation room exists.
- Crime grade is D in this area — have there been break-ins, vandalism, or insurance claims at this property in the last 3 years? What carrier currently insures it and at what premium?
- What's the average days-on-market for RENTAL listings here right now (not sales)? A rising rental-DOM trend means longer vacancies and softer asking-rent achievability than the comps imply.
- What's the recent tenant-quality profile in this submarket — average credit score on applications, eviction rate, late-payment / NSF rate, and stable-employment percentage? A property-management company in the area should have these aggregated.
- How much new for-sale + rental construction is in the pipeline within 1–3 miles? Heavy new supply typically softens prices + rents 12–24 months out; constrained supply supports both.
Investment metrics
- 1% rule
- 1.08% ✓
- Cap rate
- 7.43%
- Cash-on-cash
- 4.08%
- DSCR
- 1.18
- GRM
- 7.7
CMA / ARV
- ARV (median comp)
- $243,052
- List price
- $189,000
- Delta
- -22.24%
- Verdict
- UNDERPRICED
- Comps
- 9 within 1.0 mi
Projected returns pro-forma
-3.0% appreciation · 2.77% rent growth · sell at horizon
- IRR
- -10.1%
- Equity multiple
- 0.63×
- Total profit
- $-19,544
- Equity at exit
- $28,181
- IRR
- -1.0%
- Equity multiple
- 0.93×
- Total profit
- $-3,769
- Equity at exit
- $16,341
Cash invested: $52,920 (down + closing). Projections, not guarantees.
Landlord ↔ Tenant lean methodology
- Overall (STATE)
- 87 Strongly Landlord-Friendly
- State Texas
- 87 Strongly Landlord-Friendly · R+5
- County
- — inherits STATE
- City
- — inherits STATE
ZIP-level market 78526
- Home prices YoY
- -12.1%
- Rents YoY
- 2.8%
- Active inventory
- 413
- Price-to-rent
- 7.7×
Monthly cashflow live
- Estimated rent
- $2,037 high interval (Pro) →
- Mortgage (P&I)
- −$991
- Tax from tax record
- −$359 /mo · $4,314/yr
- Insurance
- −$79
- HOA
- −$0
- Vacancy / Maint / Mgmt
- −$428
- Net cashflow
- $180
Break-even live
UW: 25.0% down · 7.5% · 30yr · 1.5% tax · 5.0% vac · 8.0% maint · 8.0% mgmt
Financing live
Cash to close
- Down payment
- $47,250
- Closing costs
- $5,670
- Reserves months
- —
- Total cash needed
- —
Loan-product check · same deal, 3 products live
Conventional
25% down · 7.5% · 30yr
- Down + closing
- —
- Monthly P&I
- —
- Monthly cashflow
- —
- DSCR
- —
- Eligible?
- —
Personal DTI + credit; lowest rate.
DSCR
20% down · 8.5% · 30yr
- Down + closing
- —
- Monthly P&I
- —
- Monthly cashflow
- —
- DSCR
- —
- Eligible?
- —
No personal income docs; deal must DSCR.
Hard money
10% down · 12.0% · 12mo
- Down + closing
- —
- Monthly P&I
- —
- Monthly cashflow
- —
- DSCR
- —
- Eligible?
- —
Short-term bridge; refi at stabilization.
Rent comps 18 comps
| Address | Beds | Baths | Sqft | Rent | $/sqft | DOM | Units | Dist |
|---|---|---|---|---|---|---|---|---|
| 6978 Heritage Oak Dr Brownsville, TX | 3.0 | 2.0 | 1476 | $2,250 | $1.52 | 21d | 1 | 0.21mi |
| 6601 Garden Woods Ave Brownsville, TX | 3.0 | 2.0 | 1291 | $1,600 | $1.24 | 43d | 1 | 0.22mi |
| 6705 Garden Woods Ave Unit B Brownsville, TX | 3.0 | 2.0 | 1350 | $1,550 | $1.15 | 13d | 1 | 0.28mi |
| 5871 Greenwood Dr Brownsville, TX | 3.0 | 2.5 | 1820 | $1,950 | $1.07 | 13d | 1 | 0.30mi |
| 6732 Stone Oak Brownsville, TX | 3.0 | 2.0 | 1786 | $2,300 | $1.29 | 13d | 1 | 0.35mi |
| 1587 Pinion Dr Brownsville, TX | 3.0 | 2.0 | 1226 | $1,750 | $1.43 | 43d | 1 | 0.96mi |
| 4951 Daffodil Dr Brownsville, TX | 3.0 | 2.0 | 1498 | $2,400 | $1.60 | 43d | 1 | 1.04mi |
| 4951 Daffodil Dr Brownsville, TX | 3.0 | 2.0 | 1498 | $2,400 | $1.60 | 21d | 1 | 1.04mi |
| 1315 Pinion Dr Brownsville, TX | 3.0 | 2.0 | 1600 | $1,950 | $1.22 | 43d | 1 | 1.17mi |
| 2018 Diamond Dr Unit A Brownsville, TX | 2.0 | 2.5 | 1465 | $1,750 | $1.19 | 43d | 1 | 1.32mi |
| 2107 Carlos Ave Unit A Brownsville, TX | 3.0 | 2.0 | 1500 | $1,500 | $1.00 | 13d | 1 | 1.33mi |
| 1124 Sierra Grande Dr Brownsville, TX | 3.0 | 2.0 | 1308 | $1,599 | $1.22 | 21d | 1 | 1.34mi |
| 2019 Diamond Dr Unit B Brownsville, TX | 3.0 | 2.5 | 1565 | $1,950 | $1.25 | 21d | 1 | 1.35mi |
| 2011 Diamond Dr Unit A Brownsville, TX | 2.0 | 2.5 | 1465 | $2,900 | $1.98 | 21d | 1 | 1.35mi |
| 4883 Camino Verde Dr Brownsville, TX | 3.0 | 2.0 | 1302 | $1,800 | $1.38 | 21d | 1 | 1.36mi |
| 2066 Saketa Ln Brownsville, TX | 3.0 | 2.0 | 1184 | $1,700 | $1.44 | 13d | 1 | 1.36mi |
| 2043 Saketa Ln Unit A Brownsville, TX | 3.0 | 2.0 | 910 | $1,700 | $1.87 | 21d | 1 | 1.39mi |
| 1044 Alta Mesa Blvd Brownsville, TX | 3.0 | 2.0 | 1276 | $1,700 | $1.33 | 13d | 1 | 1.50mi |
Listing history 22 events
-
2026-06-18days on market $189,000 Active 78 DOM
-
2026-06-17days on market $189,000 Active 77 DOM
-
2026-06-16days on market $189,000 Active 76 DOM
-
2026-06-15days on market $189,000 Active 75 DOM
-
2026-06-14days on market $189,000 Active 73 DOM
-
2026-06-13days on market $189,000 Active 72 DOM
-
2026-06-10days on market $189,000 Active 70 DOM
-
2026-06-09days on market $189,000 Active 69 DOM
-
2026-06-08days on market $189,000 Active 68 DOM
-
2026-06-07days on market $189,000 Active 67 DOM
-
2026-06-05days on market $189,000 Active 64 DOM
-
2026-06-03days on market $189,000 Active 63 DOM
-
2026-06-02days on market $189,000 Active 62 DOM
-
2026-06-01days on market $189,000 Active 61 DOM
-
2026-05-31days on market $189,000 Active 60 DOM
-
2026-05-30days on market $189,000 Active 59 DOM
-
2026-04-27price $199,999 515-char remark
Show marketing remark (515 chars)
Cozy 3-bedroom, 2-bath home with a versatile bonus room perfect as a home office, or game room! This property offers two covered carports, providing ample space for multiple vehicles, a boat, or work equipment. The flexible layout makes it ideal for families, first-time buyers, or those working from home. Enjoy comfortable living with plenty of space to grow and customize. Conveniently located near schools, shopping, and everyday essentials. A great opportunity to own a home with extra functionality and value!
-
2026-03-30$210,000 Active 515-char remark
Show marketing remark (515 chars)
Cozy 3-bedroom, 2-bath home with a versatile bonus room perfect as a home office, or game room! This property offers two covered carports, providing ample space for multiple vehicles, a boat, or work equipment. The flexible layout makes it ideal for families, first-time buyers, or those working from home. Enjoy comfortable living with plenty of space to grow and customize. Conveniently located near schools, shopping, and everyday essentials. A great opportunity to own a home with extra functionality and value!
-
2020-09-08soldstatus
-
2020-02-03$119,000
-
2015-12-28soldstatus
-
2014-01-23soldstatus
ⓘ Source: listings_history table (triggers on properties + properties_extension) + one-shot
backfill from property_details.listing_events for pre-trigger history.
Tax reassessment forecast TX · Resets to sale price
- Current annual tax
- $4,314 · $359/mo
- Projected year-2 tax
- $4,314 · $359/mo
- Expected delta
- $0/yr ($0/mo · 0.0%)
ⓘ Screening estimate from a state-policy table — verify with the county assessor before closing.
Climate risk First Street
- Flood 1/10 Low FEMA zone X (unshaded) · 0% chance over 30 yrs
- Wildfire 5/10 Major
- Heat 9/10 Extreme 7 d/yr ≥110°F today · 26 d/yr by 30 yrs out
- Wind 9/10 Extreme 99% chance of damaging wind over 30 yrs
- Air quality 2/10 Low 1 unhealthy d/yr today · 1 by 30 yrs out
Nearby sold comps map
Loading sold comps map…
Walkable amenities ~0.75 mi
Loading nearby amenities…
Taxation est. · year 1
- Rental income
- $24,442
- − Mortgage interest
- −$10,587
- − Property taxes
- −$4,314
- − Insurance
- −$945
- − Repairs & maintenance
- −$1,955
- − Management
- −$1,955
- − Depreciation
- −$5,498
- Taxable loss
- −$813
- Est. tax savings @ 24.0%
- +$195
- After-tax cash flow
- $2,352/yr
For passive investors: Depreciation is non-cash, so a rental often shows a tax loss while cash-flowing — sheltering income. Rental losses are passive: they offset passive income freely, and up to $25,000/yr can offset ordinary (W-2) income if you actively participate and your MAGI is under $100k (phasing out to $0 by $150k); unused losses carry forward. On sale, claimed depreciation is recaptured at up to 25%, and gains may owe capital-gains tax (a 1031 exchange can defer both). Figures are a year-1 estimate at your 24.0% rate — not tax advice; consult a CPA.
Schools (NCES district)
- District
- Los Fresnos CISD
- NCES district ID
- 4828290
- Math proficiency
- 34% ▼ -30.00%
- Reading proficiency
- 44% ▼ -10.00%
- Median HH income
- $42,586
- Composite
- 32.92/100
- National rank
- #5601
- State rank
- #444 of 826 in TX
Livability — Brownsville
- Score
- 79/100
- State rank
- #62
- US rank
- #2311
Category grades
Schools grade is shown separately in the Schools card above.
Census & demographics
- Census place
- Brownsville, TX
- County
- Cameron County · 310,734 people
- City population
- 212,132
- Metro
- Brownsville-Harlingen, TX
- Population (ZIP)
- 60,012
- Household income
- $70,565
- Rent vs Own
- Severe rent burden
- 1063.0
Population outlook (Cameron County) Hauer SSP2
- Today (2025)
- 441,603 people
- By 2030
- 448,113 · +1.5%
- By 2040
- 456,385 · +3.3%
- By 2050
- 456,294 · +3.3%
- By 2075
- 423,851 · -4.0%
- By 2100
- 342,787 · -22.4%
Race, ethnicity, and origin ACS 2023
- Neighborhood character
- Predominantly Hispanic (93%)
- Race & ethnicity
- Hispanic / Latino 93% Two or more races 45% White 4% Asian 2%
- Hispanic origin (detail)
- Mexican 87%
- Foreign-born
- 25% · Canada, Vietnam
- Languages at home
- 19% English-only · Spanish 79% Tagalog/Filipino 1%
Political lean MEDSL · Cameron
- 2024 margin
- Lean R (+5.8) · D 46.7% · R 52.5%
- 2008→2024 swing
- -34.6pp toward R · 2008: 28.8pp · 2024: -5.8pp
- All cycles
- 2024: R+5.8 2020: D+13.2 2016: D+32.5 2012: D+32.4 2008: D+28.8
Not yet ingested
- Civics
- —
Market trends
- HPI YoY
- ▼ -30.28%
- Current HPI
- 220.5233
- Rent YoY
- ▲ 2.77%
- Metro
- Brownsville-Harlingen, TX
- State GDP YoY
- ▲ 3.95%
- F500 in state
- 110
Industry mix (Fortune 500 HQ in TX)
| Industry | F500 HQs | Revenue |
|---|---|---|
| Energy | 16 | $1,198B |
|
||
| Technology | 5 | $198B |
|
||
| Engineering / Construction | 4 | $72B |
|
||
| Energy Services | 3 | $60B |
|
||
| Utilities | 3 | $41B |
|
||
| Healthcare | 2 | $330B |
|
||
Price history
+68.1% since first listed6 events — show timeline
- 2026-04-27 Price Changed $199,999 RGVMLS
- 2026-03-30 Listed $210,000 RGVMLS
- 2020-09-08 Sold (Public Records) — Public Records
- 2020-02-03 Listed $119,000 RGVMLS
- 2015-12-28 Sold (Public Records) — Public Records
- 2014-01-23 Sold (Public Records) — Public Records
Property tax history
+7.7%/yrLatest (2025): $4,314 · +1.9% YoY. Source: county tax records.
Cash-flow waterfall
monthlySold comps — $/sqft
last 12 mo · ≤1 miLoading sold comps…