4601 Carmen Ave #2104 · Rancho Viejo, TX
Flood risk 5/10 · Moderate
- FEMA flood zone
- X (unshaded)
- Chance of flooding over 30 yrs
- 0.66%
- Est. flood insurance / yr
- $507 – $1,088
Fire risk 3/10 · Minor
- Est. fire insurance / yr
- $1,222 – $2,270
Heat risk 9/10 · Severe
- Hot days now (above 111°F)
- 6 days/yr
- Hot days in 30 yrs
- 21 days/yr
Wind risk 9/10 · Severe
- Chance of severe wind over 30 yrs
- 99.0%
Air-quality risk 1/10 · Minimal
- Unhealthy air days now
- 0 days/yr
- Unhealthy air days in 30 yrs
- 0 days/yr
Risk factors via First Street. Map © Google.
Why this score? — see what drove the C- grade
The composite is a weighted blend of 9 inputs, each scored 0–100. Each bar is that input's sub-score; the figure is the points it added to the 100-point composite (weight × sub-score).
- Cash flow +23.6/30.0
- 1% rule +8.1/10.0
- DSCR +7.6/10.0
- Livability +3.5/5.0
- Rent growth +2.5/5.0
- Condition / age +2.5/5.0
- Appreciation +2.3/10.0
- Schools +2.2/10.0
- ARV discount +0.0/15.0
$160,000
🖨 Deal sheet 📄 Offer letter ✓ Due diligence
Listing remarks MLS
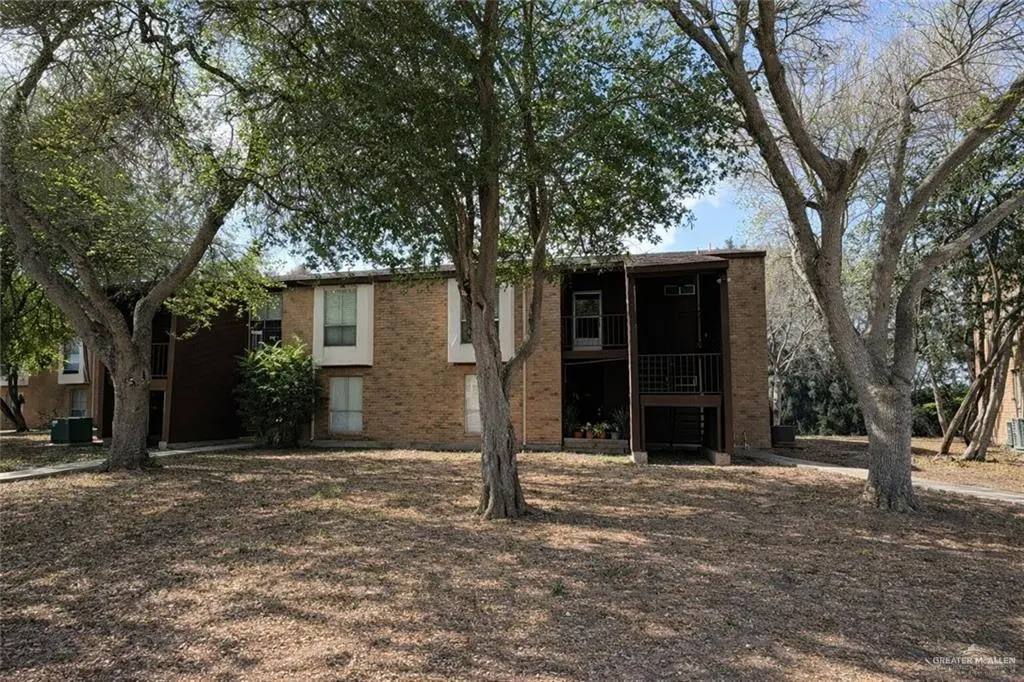
Charming 2-bedroom, 2-bath townhome located in the desirable Lago Viejo South community in Rancho Viejo! This second-floor unit features two private balconies and a cozy indoor fireplace, perfect for relaxing or entertaining. The open-concept living area includes a convenient bar area, ideal for casual dining or hosting guests. Recently updated throughout, this home offers new flooring and an updated kitchen with modern finishes and ample cabinet space. The spacious layout provides comfortable living and dining areas filled with natural light. The primary suite includes his-and-her closets along with generous linen storage. Community amenities include access to two swimming pools, enhancing the low-maintenance lifestyle. Conveniently located near shopping, dining, and major roadways—ideal for homeowners or investors alike!
Key facts
- Private balconies
- Two swimming pools
- Bar area
Tags
Neighborhood map
What this means for you Summary
Snapshot
- This is a 2-bed/2.0-bath single-family listed at $160k.
Deal economics
- At list price, monthly cash flow is $303 ($4k/yr) — positive.
- The deal already cash-flows at list — no discount required.
- Meets the 1% rule at list price ($2k rent vs $160k).
- Recommended offer: $150k (6.0% below list) — sets the bar for market timing.
Location & tenants
- Location reads 70/100 on livability (#341 in TX) — a middle-class / working-renter tenant base. Strengths: crime A+, cost of living A+, housing A+; Watch: schools D, amenities F, commute F.
- Brownsville ISD (urban): math 20% / reading 34% proficiency, ranked #710 of 826 in TX (top 86%) — low school quality limits family demand, transient renter base, plan for 1-2y turnover; 83% free/reduced lunch — lower-income household profile, screen leases tightly.
- Market conditions: 75 active listings in the ZIP; 9 comparable units currently listed for rent nearby; rentals leasing fast (median 14d on market — plan ~1-2 weeks tenant-placement turnaround); 2,326 units permitted in Cameron County in 2024 (503 in 5+ unit buildings).
Forward outlook
- Local home prices are declining (-3.0%/yr); year-one equity from $1k of loan paydown is wiped out by about $5k of value loss. Plan a longer hold.
- Cameron County population projected at +3% by 2050 — modest demand growth; plan on rents tracking national, not racing it.
Negotiation context
- It's been on market 86 days — a 6% lower offer ($150k) is reasonable based on typical stale-listing flexibility.
- 2 sale attempts with the ask held roughly flat each time — persistent listings suggest the price (not the market) is what's stuck; bring a comps-based counter.
Risks & watch-outs
- Climate carrying-cost: moderate flood risk; severe wind risk, 99% chance of damaging wind over 30y; extreme-heat days projected 6→21/yr by 2055 (HVAC capex compounding) — expect insurance premiums to compound above CPI over the hold.
Questions for the listing agent
- It's been on market 86 days. Have you received any prior offers? Is the seller open to a 6% concession, seller financing, or rate buy-down credit?
- What does the HOA fee cover, when was the last increase, and are there any pending special assessments or reserve-fund shortfalls?
- Why hasn't it sold? Are there any deal-killer items the seller is aware of (foundation, flood, title, zoning, code violations)?
- Is there a deadline driving the sale (1031 exchange, divorce, estate, relocation)? That informs how much negotiation room exists.
- Schools are D-rated, which usually means shorter tenancies and higher turnover. Who's the typical renter profile here, and what's been the actual vacancy rate?
- What's the average days-on-market for RENTAL listings here right now (not sales)? A rising rental-DOM trend means longer vacancies and softer asking-rent achievability than the comps imply.
- What's the recent tenant-quality profile in this submarket — average credit score on applications, eviction rate, late-payment / NSF rate, and stable-employment percentage? A property-management company in the area should have these aggregated.
- How much new for-sale + rental construction is in the pipeline within 1–3 miles? Heavy new supply typically softens prices + rents 12–24 months out; constrained supply supports both.
Investment metrics
- 1% rule
- 1.31% ✓
- Cap rate
- 8.56%
- Cash-on-cash
- 8.11%
- DSCR
- 1.36
- GRM
- 6.3
CMA / ARV
- ARV (median comp)
- $125,788
- List price
- $160,000
- Delta
- 27.20%
- Verdict
- OVERPRICED
- Comps
- 2 within 1.0 mi
Projected returns pro-forma
-3.0% appreciation · 3.0% rent growth · sell at horizon
- IRR
- -3.8%
- Equity multiple
- 0.86×
- Total profit
- $-6,451
- Equity at exit
- $23,857
- IRR
- 6.0%
- Equity multiple
- 1.45×
- Total profit
- $19,980
- Equity at exit
- $13,834
Cash invested: $44,800 (down + closing). Projections, not guarantees.
Landlord ↔ Tenant lean methodology
- Overall (STATE)
- 87 Strongly Landlord-Friendly
- State Texas
- 87 Strongly Landlord-Friendly · R+5
- County
- — inherits STATE
- City
- — inherits STATE
ZIP-level market 78575
- Home prices YoY
- -2.2%
- Active inventory
- 75
- Price-to-rent
- 6.3×
Monthly cashflow live
- Estimated rent
- $2,104 high interval (Pro) →
- Mortgage (P&I)
- −$839
- Tax from tax record
- −$175 /mo · $2,103/yr
- Insurance
- −$67
- HOA
- −$278
- Vacancy / Maint / Mgmt
- −$442
- Net cashflow
- $303
Break-even live
UW: 25.0% down · 7.5% · 30yr · 1.5% tax · 5.0% vac · 8.0% maint · 8.0% mgmt
Financing live
Cash to close
- Down payment
- $40,000
- Closing costs
- $4,800
- Reserves months
- —
- Total cash needed
- —
Loan-product check · same deal, 3 products live
Conventional
25% down · 7.5% · 30yr
- Down + closing
- —
- Monthly P&I
- —
- Monthly cashflow
- —
- DSCR
- —
- Eligible?
- —
Personal DTI + credit; lowest rate.
DSCR
20% down · 8.5% · 30yr
- Down + closing
- —
- Monthly P&I
- —
- Monthly cashflow
- —
- DSCR
- —
- Eligible?
- —
No personal income docs; deal must DSCR.
Hard money
10% down · 12.0% · 12mo
- Down + closing
- —
- Monthly P&I
- —
- Monthly cashflow
- —
- DSCR
- —
- Eligible?
- —
Short-term bridge; refi at stabilization.
Rent comps 9 comps
| Address | Beds | Baths | Sqft | Rent | $/sqft | DOM | Units | Dist |
|---|---|---|---|---|---|---|---|---|
| 4601 Carmen Ave #1604 Rancho Viejo, TX | 2.0 | 2.5 | 1200 | $2,200 | $1.83 | 21d | 1 | 0.02mi |
| 4601 Carmen Ave Unit 1603 Rancho Viejo, TX | 3.0 | 2.5 | 1328 | $2,400 | $1.81 | 13d | 1 | 0.04mi |
| 4601 Carmen Ave Unit 2204 Rancho Viejo, TX | 2.0 | 2.0 | 1138 | $2,000 | $1.76 | 13d | 1 | 0.04mi |
| 4601 Carmen Ave Unit 1903 Rancho Viejo, TX | 2.0 | 2.0 | 1169 | $2,000 | $1.71 | 43d | 1 | 0.04mi |
| 3500 Carmen Ave Rancho Viejo, TX | 2.0 | 1.0–2.5 | 1145 | $1,825 | $1.59 | 13d | 2 | 0.87mi |
| 3500 Carmen Ave #408 Rancho Viejo, TX | 2.0 | 1.0 | 1070 | $2,300 | $2.15 | 13d | 1 | 0.88mi |
| 3500 Carmen Ave #1103 Rancho Viejo, TX | 2.0 | 2.5 | 1222 | $1,500 | $1.23 | 43d | 1 | 0.88mi |
| 2515 El Dorado Ave Rancho Viejo, TX | 3.0 | 2.0 | 1420 | $1,550 | $1.09 | 13d | 1 | 1.13mi |
| 2101 El Dorado Ave Rancho Viejo, TX | 3.0 | 2.0 | 1420 | $1,600 | $1.13 | 13d | 1 | 1.14mi |
HOA detail
- Monthly dues
- $278 · $3,336/yr
- Likely covers
- pool
Listing history 21 events
-
2026-06-18days on market $160,000 Active 86 DOM
-
2026-06-17days on market $160,000 Active 85 DOM
-
2026-06-16days on market $160,000 Active 84 DOM
-
2026-06-15days on market $160,000 Active 83 DOM
-
2026-06-14days on market $160,000 Active 81 DOM
-
2026-06-13days on market $160,000 Active 80 DOM
-
2026-06-10days on market $160,000 Active 78 DOM
-
2026-06-09days on market $160,000 Active 77 DOM
-
2026-06-08days on market $160,000 Active 76 DOM
-
2026-06-07days on market $160,000 Active 75 DOM
-
2026-06-05days on market $160,000 Active 72 DOM
-
2026-06-03days on market $160,000 Active 71 DOM
-
2026-06-02days on market $160,000 Active 70 DOM
-
2026-06-01days on market $160,000 Active 69 DOM
-
2026-05-31days on market $160,000 Active 68 DOM
-
2026-05-30days on market $160,000 Active 67 DOM
-
2026-03-24$160,000 Active 840-char remark
Show marketing remark (840 chars)
Charming 2-bedroom, 2-bath townhome located in the desirable Lago Viejo South community in Rancho Viejo! This second-floor unit features two private balconies and a cozy indoor fireplace, perfect for relaxing or entertaining. The open-concept living area includes a convenient bar area, ideal for casual dining or hosting guests. Recently updated throughout, this home offers new flooring and an updated kitchen with modern finishes and ample cabinet space. The spacious layout provides comfortable living and dining areas filled with natural light. The primary suite includes his-and-her closets along with generous linen storage. Community amenities include access to two swimming pools, enhancing the low-maintenance lifestyle. Conveniently located near shopping, dining, and major roadways—ideal for homeowners or investors alike!
-
2020-08-03soldstatus
-
2014-04-25soldstatus
-
1992-12-01soldstatus
ⓘ Source: listings_history table (triggers on properties + properties_extension) + one-shot
backfill from property_details.listing_events for pre-trigger history.
Tax reassessment forecast TX · Resets to sale price
- Current annual tax
- $2,103 · $175/mo
- Projected year-2 tax
- $2,928 · $244/mo
- Expected delta
- +$825/yr (+$69/mo · 39.2%)
ⓘ Screening estimate from a state-policy table — verify with the county assessor before closing.
Climate risk First Street
- Flood 5/10 Major FEMA zone X (unshaded) · 66% chance over 30 yrs
- Wildfire 3/10 Moderate
- Heat 9/10 Extreme 6 d/yr ≥111°F today · 21 d/yr by 30 yrs out
- Wind 9/10 Extreme 99% chance of damaging wind over 30 yrs
- Air quality 1/10 Low 0 unhealthy d/yr today · 0 by 30 yrs out
Nearby sold comps map
Loading sold comps map…
Walkable amenities ~0.75 mi
Loading nearby amenities…
Taxation est. · year 1
- Rental income
- $25,242
- − Mortgage interest
- −$8,962
- − Property taxes
- −$2,103
- − Insurance
- −$800
- − Repairs & maintenance
- −$2,019
- − Management
- −$2,019
- − HOA
- −$3,336
- − Depreciation
- −$4,655
- Taxable income
- $1,348
- Est. tax owed @ 24.0%
- −$324
- After-tax cash flow
- $3,311/yr
For passive investors: Depreciation is non-cash, so a rental often shows a tax loss while cash-flowing — sheltering income. Rental losses are passive: they offset passive income freely, and up to $25,000/yr can offset ordinary (W-2) income if you actively participate and your MAGI is under $100k (phasing out to $0 by $150k); unused losses carry forward. On sale, claimed depreciation is recaptured at up to 25%, and gains may owe capital-gains tax (a 1031 exchange can defer both). Figures are a year-1 estimate at your 24.0% rate — not tax advice; consult a CPA.
Schools (NCES district)
- District
- Brownsville ISD
- NCES district ID
- 4811680
- Math proficiency
- 20% ▼ -36.00%
- Reading proficiency
- 34% ▼ -13.00%
- Median HH income
- $30,490
- Composite
- 21.8/100
- National rank
- #8249
- State rank
- #710 of 826 in TX
Livability — Rancho Viejo
- Score
- 70/100
- State rank
- #341
- US rank
- #7444
Category grades
Schools grade is shown separately in the Schools card above.
Census & demographics
- Census place
- Rancho Viejo, TX
- City population
- 4,728
- Population (ZIP)
- 4,728
Population outlook (Cameron County) Hauer SSP2
- Today (2025)
- 441,603 people
- By 2030
- 448,113 · +1.5%
- By 2040
- 456,385 · +3.3%
- By 2050
- 456,294 · +3.3%
- By 2075
- 423,851 · -4.0%
- By 2100
- 342,787 · -22.4%
Race, ethnicity, and origin ACS 2023
- Neighborhood character
- Predominantly Hispanic (78%)
- Race & ethnicity
- Hispanic / Latino 78% Two or more races 36% White 19% Asian 3%
- Hispanic origin (detail)
- Mexican 75%
- Common ancestry
- Lithuanian 2% Slovak 1% Italian 1%
- Foreign-born
- 28% · Canada, China, Dominican Republic
- Languages at home
- 27% English-only · Spanish 70% Chinese 1% Other Indo-European 1%
Political lean MEDSL · Cameron
- 2024 margin
- Lean R (+5.8) · D 46.7% · R 52.5%
- 2008→2024 swing
- -34.6pp toward R · 2008: 28.8pp · 2024: -5.8pp
- All cycles
- 2024: R+5.8 2020: D+13.2 2016: D+32.5 2012: D+32.4 2008: D+28.8
Not yet ingested
- Civics
- —
Market trends
- HPI YoY
- ▼ -5.34%
- Current HPI
- 240.4582
- Rent YoY
- —
- Metro
- —
- State GDP YoY
- ▲ 3.95%
- F500 in state
- 110
Industry mix (Fortune 500 HQ in TX)
| Industry | F500 HQs | Revenue |
|---|---|---|
| Energy | 16 | $1,198B |
|
||
| Technology | 5 | $198B |
|
||
| Engineering / Construction | 4 | $72B |
|
||
| Energy Services | 3 | $60B |
|
||
| Utilities | 3 | $41B |
|
||
| Healthcare | 2 | $330B |
|
||
Price history
+0.0% since first listed5 events — show timeline
- 2026-03-24 Listed $160,000 RGVMLS
- 2026-03-24 Listed $160,000 MCALLENMLS
- 2020-08-03 Sold (Public Records) — Public Records
- 2014-04-25 Sold (Public Records) — Public Records
- 1992-12-01 Sold (Public Records) — Public Records
Property tax history
+2.9%/yrLatest (2025): $2,103 · +4.8% YoY. Source: county tax records.
Cash-flow waterfall
monthlySold comps — $/sqft
last 12 mo · ≤1 miLoading sold comps…