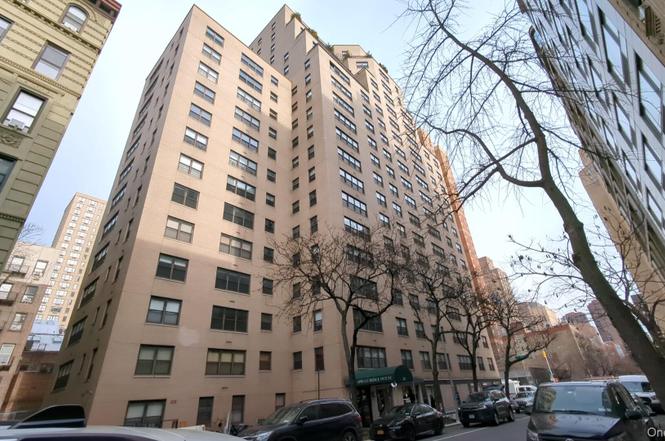
245 E 25th St Unit 15E · New York, NY
Flood risk 1/10 · Minimal
- FEMA flood zone
- X (unshaded)
- Chance of flooding over 30 yrs
- 0.0%
- Est. flood insurance / yr
- $507 – $1,088
Fire risk 1/10 · Minimal
- Est. fire insurance / yr
- $691 – $1,283
Heat risk 6/10 · Moderate
- Hot days now (above 99°F)
- 7 days/yr
- Hot days in 30 yrs
- 15 days/yr
Wind risk 6/10 · Moderate
- Chance of severe wind over 30 yrs
- 27.0%
Air-quality risk 4/10 · Minor
- Unhealthy air days now
- 5 days/yr
- Unhealthy air days in 30 yrs
- 7 days/yr
Risk factors via First Street. Map © Google.
Why this score? — see what drove the C grade
The composite is a weighted blend of 9 inputs, each scored 0–100. Each bar is that input's sub-score; the figure is the points it added to the 100-point composite (weight × sub-score).
- Cash flow +13.2/30.0
- 1% rule +8.0/10.0
- Appreciation +7.9/10.0
- ARV discount +7.5/15.0
- Schools +5.0/10.0
- DSCR +4.0/10.0
- Rent growth +3.8/5.0
- Livability +3.8/5.0
- Condition / age +2.5/5.0
$525,000
🖨 Deal sheet 📄 Offer letter ✓ Due diligence
Listing remarks
Step into this bright, southern-facing 1 bedroom retreat on the 15th floor of the Spruce Ridge House and find your own personal sanctuary. This 720 square foot home is light, airy and remarkably quiet, offering a serene escape from the city below. The expansive, flexible layout provides incredible potential— whether you want to refresh it, reimagine it, or simply make it your own. Life in Kips Bay puts the best of Manhattan at your doorstep. You are just moments away from great shopping (Trader Joe’s, Fairway, and Target), plus an array of vibrant cafes and local favorites nearby. Commuting is a breeze thanks to excellent access to the 6 train, multiple bus lines, and the nearby
Key facts
- 15th floor
- Kips bay
- Target
Tags
Property features AI
Finance
- HOA & community: Building amenities: doorman, elevators, live-in super, parking, roof deck, trash service
Exterior
- Parking: Underground parking (waitlist); Has garage
- Security: Doorman; Live-in superintendent
- Utilities: Con Edison electric service; Public sewer; Cable available; Electricity connected; Natural gas available; Sewer connected; Public trash collection; Water connected
- Home design: Stock cooperative; One level unit on the 15th entry level; 21-story building; Outdoor space
- Construction: Brick construction
- Exterior features: No notable exterior features listed; Not waterfront
Interior
- Kitchen: Dishwasher; Gas range; Oven; Refrigerator
- Bedrooms: 3 total rooms (includes bedroom spaces)
- Bathrooms: 1 full bathroom
- Heating & cooling: Central air; Other heating (see remarks)
- Interior features: Other interior features; In-basement laundry; Common basement with storage space; Outdoor space
- Laundry & utility: Laundry in basement
Neighborhood map
What this means for you Summary
Snapshot
- This is a 1-bed/1.0-bath condo listed at $525k.
Deal economics
- At list price, monthly cash flow is $-12 ($-142/yr) — negative.
- The deal already cash-flows at list — no discount required.
- Meets the 1% rule at list price ($7k rent vs $525k).
- Recommended offer: $478k (9.0% below list) — sets the bar for market timing.
- Cap rate 6.3% vs local median 2.6% in New York — top-decile yield for the area; either an underpriced asset or a hidden risk that comps aren't pricing in. Stress-test before assuming the spread holds.
Location & tenants
- Location reads 75/100 on livability (#268 in NY, #4,188 nationally) — a middle-class / working-renter tenant base. Strengths: amenities A+, commute A+, health & safety A; Watch: crime F, cost of living F.
- Market conditions: Rents rising fast (+5.1%/yr); 232 active listings in the ZIP; 40 comparable units currently listed for rent nearby; rentals leasing fast (median 7d on market — plan ~1-2 weeks tenant-placement turnaround); high-income renter base; 4,467 units permitted in New York County in 2024 (4,463 in 5+ unit buildings).
- At $6,816/mo this rent would consume 56% of the median local household income ($145k/yr) (locally 2470% of renters already pay >50% of income on rent) — very limited rent-growth headroom before tenants either downsize or default.
Forward outlook
- In year one you build about $34k of equity ($4k loan paydown + $30k appreciation (5.7% local appreciation)).
- New York County population projected at +21% by 2050 — long-run rental-demand tailwind backs the buy-and-hold thesis.
- At projected returns (5.7% appreciation + 5.1% rent growth), your $147k cash investment doubles in ~4 years — after that, you're playing with house money.
- By year 2, paydown + projected appreciation supports a ~$54k cash-out refi (75% LTV) — recoverable capital for the next deal without selling this one.
Negotiation context
- It's been on market 116 days — a 9% lower offer ($478k) is reasonable based on typical stale-listing flexibility.
- 2 sale attempts with the ask held roughly flat each time — persistent listings suggest the price (not the market) is what's stuck; bring a comps-based counter.
Risks & watch-outs
- Watch-outs: HOA is 26% of rent.
- Climate carrying-cost: major wind risk, 27% chance of damaging wind over 30y; extreme-heat days projected 7→15/yr by 2055 (HVAC capex compounding) — expect insurance premiums to compound above CPI over the hold.
Questions for the listing agent
- What do current leases actually rent for vs. the listed asking? Can we see a recent rent roll and the last 12 months of T-12 income?
- It's been on market 116 days. Have you received any prior offers? Is the seller open to a 9% concession, seller financing, or rate buy-down credit?
- Built in 1964 — when were the roof, HVAC, electrical panel, plumbing, and water heater last replaced?
- What does the HOA fee cover, when was the last increase, and are there any pending special assessments or reserve-fund shortfalls?
- Any open or pending special assessments — roof, HVAC, plumbing, elevator, façade? What's the per-unit balance and payoff schedule, and is the seller paying it off at close or rolling it to the buyer?
- Why hasn't it sold? Are there any deal-killer items the seller is aware of (foundation, flood, title, zoning, code violations)?
- Is there a deadline driving the sale (1031 exchange, divorce, estate, relocation)? That informs how much negotiation room exists.
- Schools are B-rated — typically a magnet for longer-tenancy family renters. What's the average tenant stay here, and is there a school-zone premium baked into asking?
- Crime grade is F in this area — have there been break-ins, vandalism, or insurance claims at this property in the last 3 years? What carrier currently insures it and at what premium?
- What's the average days-on-market for RENTAL listings here right now (not sales)? A rising rental-DOM trend means longer vacancies and softer asking-rent achievability than the comps imply.
- What's the recent tenant-quality profile in this submarket — average credit score on applications, eviction rate, late-payment / NSF rate, and stable-employment percentage? A property-management company in the area should have these aggregated.
- How much new apartment / multifamily construction is in the pipeline within 1–3 miles? Heavy new supply (>2% of stock underway) typically softens rents 12–24 months out; light construction supports rent growth.
Investment metrics
- 1% rule
- 1.30% ✓
- Cap rate
- 6.27%
- Cash-on-cash
- -0.10%
- DSCR
- 1.00
- GRM
- 6.4
CMA / ARV
No comps found within radius.
Projected returns pro-forma
5.7% appreciation · 5.08% rent growth · sell at horizon
- IRR
- 16.0%
- Equity multiple
- 2.07×
- Total profit
- $157,271
- Equity at exit
- $320,139
- IRR
- 17.3%
- Equity multiple
- 4.40×
- Total profit
- $500,380
- Equity at exit
- $572,201
Cash invested: $147,000 (down + closing). Projections, not guarantees.
Landlord ↔ Tenant lean methodology
- Overall (CITY)
- 0 Strongly Tenant-Friendly
- State New York
- 15 Strongly Tenant-Friendly · D+10
- County
- — inherits STATE
- City New York
- 0 Strongly Tenant-Friendly · D+34
ZIP-level market 10010
- Home prices YoY
- 2.0%
- Rents YoY
- 5.1%
- Active inventory
- 232
- Price-to-rent
- 6.4×
Monthly cashflow live
- Estimated rent
- $6,816 high interval (Pro) →
- Mortgage (P&I)
- −$2,753
- Tax est. 1.5%
- −$656 /mo · $7,875/yr
- Insurance
- −$219
- HOA est. from 3 same-building comps
- −$1,768
- Vacancy / Maint / Mgmt
- −$1,431
- Net cashflow
- $-12
Break-even live
UW: 25.0% down · 7.5% · 30yr · 1.5% tax · 5.0% vac · 8.0% maint · 8.0% mgmt
Financing live
Cash to close
- Down payment
- $131,250
- Closing costs
- $15,750
- Reserves months
- —
- Total cash needed
- —
Loan-product check · same deal, 3 products live
Conventional
25% down · 7.5% · 30yr
- Down + closing
- —
- Monthly P&I
- —
- Monthly cashflow
- —
- DSCR
- —
- Eligible?
- —
Personal DTI + credit; lowest rate.
DSCR
20% down · 8.5% · 30yr
- Down + closing
- —
- Monthly P&I
- —
- Monthly cashflow
- —
- DSCR
- —
- Eligible?
- —
No personal income docs; deal must DSCR.
Hard money
10% down · 12.0% · 12mo
- Down + closing
- —
- Monthly P&I
- —
- Monthly cashflow
- —
- DSCR
- —
- Eligible?
- —
Short-term bridge; refi at stabilization.
Rent comps 40 comps
| Address | Beds | Baths | Sqft | Rent | $/sqft | DOM | Units | Dist |
|---|---|---|---|---|---|---|---|---|
| 290 3rd Ave #279 New York, NY | 1.0 | 1.0 | 607 | $9,740 | $16.03 | 3d | 2 | 0.22mi |
| 250 E 21st St Unit 8D New York, NY | 1.0 | 1.0 | 688 | $9,525 | $13.84 | 2d | 1 | 0.26mi |
| 155 E 31st St #2190 New York, NY | 1.0–2.0 | 1.0–1.5 | 725 | $5,610 | $7.74 | 8d | 2 | 0.30mi |
| 222 E 34th St #999 New York, NY | 1.0 | 1.0 | 554 | $5,490 | $9.91 | 6d | 1 | 0.38mi |
| 141 E 33rd St #1278 New York, NY | 2.0 | 1.0–1.5 | 683 | $6,230 | $9.12 | 8d | 3 | 0.39mi |
| 30 Waterside Plz New York, NY | 2.0 | 1.0–2.0 | 743 | $5,218 | $7.02 | 2d | 33 | 0.40mi |
| 346 E 18th St Unit 1254596P New York, NY | 2.0 | 2.0 | 699 | $12,979 | $18.57 | 22d | 1 | 0.43mi |
| 20 Waterside Plz #978 New York, NY | 1.0 | 1.0 | 682 | $4,760 | $6.98 | 6d | 1 | 0.43mi |
| 399 E 34th St Unit 1025362P New York, NY | 1.0 | 1.0 | 570 | $9,174 | $16.09 | 22d | 1 | 0.44mi |
| 401 E 34th St New York, NY | 3.0 | 1.0–2.0 | 887 | $5,532 | $6.23 | 2d | 55 | 0.46mi |
| 309 5th Ave New York, NY | 1.0 | 1.0 | 597 | $7,596 | $12.72 | 8d | 13 | 0.54mi |
| 556 3rd Ave Unit 2244 New York, NY | 1.0 | 1.0 | 500 | $5,650 | $11.30 | 3d | 1 | 0.55mi |
| 556 3rd Ave New York, NY | 1.0 | 1.0 | 580 | $5,240 | $9.03 | 20d | 2 | 0.55mi |
| 556 3rd Ave New York, NY | 1.0 | 1.0 | 540 | $5,635 | $10.44 | 2d | 2 | 0.55mi |
| 30 Park Ave #1347 New York, NY | 2.0 | 1.0 | 950 | $7,890 | $8.31 | 2d | 3 | 0.57mi |
| 41 Park Ave New York, NY | 2.0 | 1.0–2.0 | 815 | $6,555 | $8.04 | 8d | 3 | 0.59mi |
| 138 E 38th St New York, NY | 3.0 | 1.0–2.0 | 750 | $4,510 | $6.01 | 24d | 4 | 0.61mi |
| 43 W 27th St #1055 New York, NY | 2.0 | 1.0 | 740 | $9,940 | $13.43 | 24d | 1 | 0.63mi |
| 1 Union Sq S #1174 New York, NY | 2.0 | 1.0–2.0 | 775 | $10,120 | $13.06 | 10d | 3 | 0.66mi |
| 776 6th Ave New York, NY | 2.0 | 1.0–2.0 | 756 | $7,743 | $10.24 | 1d | 18 | 0.68mi |
| 209 1st Ave Unit 1370708P New York, NY | 1.0 | 1.0 | 602 | $12,000 | $19.93 | 24d | 1 | 0.68mi |
| 815 Broadway #204 New York, NY | 1.0 | 1.0 | 522 | $8,250 | $15.80 | 8d | 1 | 0.77mi |
| 101 E 10th St #1153 New York, NY | 1.0–2.0 | 1.0–2.0 | 575 | $6,740 | $11.72 | 2d | 2 | 0.78mi |
| 120 W 21st St New York, NY | 2.0 | 1.0–2.0 | 676 | $7,070 | $10.46 | 4d | 14 | 0.79mi |
| 112 E 10th St Unit 1021937P New York, NY | 1.0–3.0 | 1.0–2.5 | 1296 | $5,772 | $4.45 | 3d | 2 | 0.80mi |
| 160 W 24th St New York, NY | 2.0 | 1.0–2.0 | 731 | $7,896 | $10.79 | 1d | 12 | 0.84mi |
| 101 W 15th St New York, NY | 1.0 | 1.0 | 562 | $9,550 | $16.98 | 2d | 2 | 0.87mi |
| 230 E 44th St #2165 New York, NY | 1.0–2.0 | 1.0 | 568 | $3,150 | $5.54 | 24d | 2 | 0.88mi |
| 180 W 20th St #1202 New York, NY | 2.0 | 1.0–2.0 | 791 | $9,505 | $12.01 | 2d | 3 | 0.89mi |
| 108 W 15th St #205 New York, NY | 1.0–2.0 | 1.0 | 697 | $6,050 | $8.67 | 3d | 2 | 0.90mi |
| 130 W 15th St #1383 New York, NY | 1.0–2.0 | 1.0–2.0 | 844 | $9,200 | $10.90 | 2d | 2 | 0.92mi |
| 93 1/2 E 7th St Unit 1054297P New York, NY | 2.0 | 1.0 | 495 | $10,000 | $20.20 | 22d | 1 | 0.94mi |
| 244 W 29th St Unit 2149 New York, NY | 1.0 | 1.0 | 490 | $9,720 | $19.84 | 6d | 2 | 0.97mi |
| 300 E 46th St New York, NY | 2.0–3.0 | 1.0 | 716 | $4,300 | $6.00 | 24d | 2 | 0.98mi |
| 243 W 28th St #2143 New York, NY | 1.0 | 1.0 | 580 | $8,960 | $15.45 | 19d | 1 | 0.99mi |
| 330 E 46th St #1794 New York, NY | 1.0 | 1.0 | 489 | $4,990 | $10.19 | 24d | 2 | 0.99mi |
| 301 E 47th St #1737 New York, NY | 2.0 | 1.0 | 600 | $5,380 | $8.97 | 21d | 1 | 1.06mi |
| 135 E 47th St Unit 22F New York, NY | 1.0 | 1.0 | 700 | $7,500 | $10.71 | 22d | 1 | 1.06mi |
| 135 E 47th St New York, NY | 1.0 | 1.0 | 572 | $6,600 | $11.53 | 6d | 1 | 1.07mi |
| 2 Blue Slip Brooklyn, NY | 2.0 | 1.0–2.0 | 819 | $5,922 | $7.23 | 2d | 7 | 1.09mi |
HOA detail condo
- Monthly dues
- $0 · $0/yr
- Assessments
- None detected in remarks — confirm with the listing agent.
Listing history 14 events
-
2026-06-17status $525,000 Pending 116 DOM
-
2026-06-17days on market $525,000 Active 116 DOM
-
2026-06-15days on market $525,000 Active 114 DOM
-
2026-06-13days on market $525,000 Active 112 DOM
-
2026-06-10days on market $525,000 Active 108 DOM
-
2026-06-08days on market $525,000 Active 107 DOM
-
2026-06-08days on market $525,000 Active 106 DOM
-
2026-06-04days on market $525,000 Active 103 DOM
-
2026-06-03days on market $525,000 Active 102 DOM
-
2026-06-01days on market $525,000 Active 100 DOM
-
2026-05-31days on market $525,000 Active 99 DOM
-
2026-05-08status Active
-
2026-04-20status Pending
-
2026-02-03$525,000 Active
ⓘ Source: listings_history table (triggers on properties + properties_extension) + one-shot
backfill from property_details.listing_events for pre-trigger history.
Climate risk First Street
- Flood 1/10 Low FEMA zone X (unshaded) · 0% chance over 30 yrs
- Wildfire 1/10 Low
- Heat 6/10 Major 7 d/yr ≥99°F today · 15 d/yr by 30 yrs out
- Wind 6/10 Major 27% chance of damaging wind over 30 yrs
- Air quality 4/10 Moderate 5 unhealthy d/yr today · 7 by 30 yrs out
Nearby sold comps map
Loading sold comps map…
Walkable amenities ~0.75 mi
Loading nearby amenities…
Taxation est. · year 1
- Rental income
- $81,787
- − Mortgage interest
- −$29,408
- − Property taxes
- −$7,875
- − Insurance
- −$2,625
- − Repairs & maintenance
- −$6,543
- − Management
- −$6,543
- − HOA
- −$21,216
- − Depreciation
- −$15,273
- Taxable loss
- −$7,696
- Est. tax savings @ 24.0%
- +$1,847
- After-tax cash flow
- $1,705/yr
For passive investors: Depreciation is non-cash, so a rental often shows a tax loss while cash-flowing — sheltering income. Rental losses are passive: they offset passive income freely, and up to $25,000/yr can offset ordinary (W-2) income if you actively participate and your MAGI is under $100k (phasing out to $0 by $150k); unused losses carry forward. On sale, claimed depreciation is recaptured at up to 25%, and gains may owe capital-gains tax (a 1031 exchange can defer both). Figures are a year-1 estimate at your 24.0% rate — not tax advice; consult a CPA.
Schools (NCES district)
No district data.
Livability — New York
- Score
- 75/100
- State rank
- #268
- US rank
- #4188
Category grades
Schools grade is shown separately in the Schools card above.
Census & demographics
- Census place
- New York, NY
- County
- New York County · 1,599,927 people
- City population
- 7,731,280
- Metro
- New York-Newark-Jersey City, NY-NJ-PA
- Population (ZIP)
- 30,702
- Household income
- $144,969
- Rent vs Own
- Severe rent burden
- 2470.0
Population outlook (New York County) Hauer SSP2
- Today (2025)
- 1,825,725 people
- By 2030
- 1,904,611 · +4.3%
- By 2040
- 2,052,719 · +12.4%
- By 2050
- 2,206,601 · +20.9%
- By 2075
- 2,509,427 · +37.4%
- By 2100
- 2,702,933 · +48.0%
Race, ethnicity, and origin ACS 2023
- Neighborhood character
- Diverse neighborhood (Simpson 0.57)
- Race & ethnicity
- White 63% Asian 14% Black 9% Two or more races 9% Hispanic / Latino 8%
- Hispanic origin (detail)
- Mexican 1% Puerto Rican 2%
- Common ancestry
- Romanian 5% Italian 3% Scotch-Irish 2%
- Foreign-born
- 21% · Canada, China, South Korea
- Languages at home
- 80% English-only · Spanish 4% Chinese 4% Other Indo-European 3%
Political lean MEDSL · New York
- 2024 margin
- Solid D (+64.8) · D 82.4% · R 17.6%
- 2008→2024 swing
- -7.4pp toward R · 2008: 72.2pp · 2024: 64.8pp
- All cycles
- 2024: D+64.8 2020: D+74.5 2016: D+77.2 2012: D+69.6 2008: D+72.2
Not yet ingested
- Civics
- —
Market trends
- HPI YoY
- ▲ 5.70%
- Current HPI
- 293.8611
- Rent YoY
- ▲ 5.08%
- Metro
- New York-Newark-Jersey City, NY-NJ-PA
- State GDP YoY
- ▲ 2.60%
- F500 in state
- 92
Industry mix (Fortune 500 HQ in NY)
| Industry | F500 HQs | Revenue |
|---|---|---|
| Financial Services | 10 | $950B |
|
||
| Consumer Goods | 9 | $162B |
|
||
| Insurance | 4 | $225B |
|
||
| Telecommunications | 2 | $144B |
|
||
| Pharmaceuticals | 2 | $112B |
|
||
| Media / Entertainment | 2 | $69B |
|
||
Price history
3 events — show timeline
- 2026-05-08 Relisted — OneKey® MLS as Distributed by MLS Grid
- 2026-04-20 Pending — OneKey® MLS as Distributed by MLS Grid
- 2026-02-03 Listed $525,000 OneKey® MLS as Distributed by MLS Grid
Cash-flow waterfall
monthlySold comps — $/sqft
last 12 mo · ≤1 miLoading sold comps…