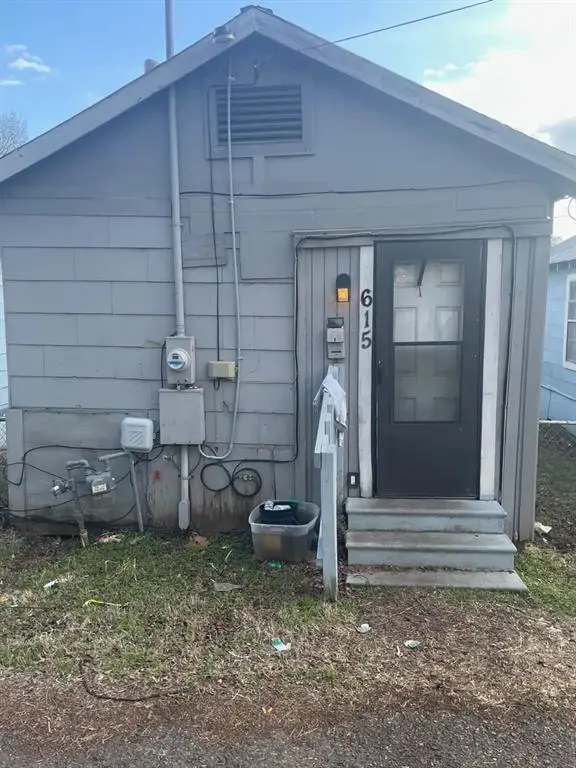
615 Montgomery St · Bossier City, LA
Flood risk No data
- FEMA flood zone
- —
- Chance of flooding over 30 yrs
- —
- Est. flood insurance / yr
- —
Fire risk No data
- Est. fire insurance / yr
- —
Heat risk No data
- Hot days now (above threshold)
- —
- Hot days in 30 yrs
- —
Wind risk No data
- Chance of severe wind over 30 yrs
- —
Air-quality risk No data
- Unhealthy air days now
- —
- Unhealthy air days in 30 yrs
- —
Risk factors via First Street. Map © Google.
Why this score? — see what drove the D+ grade
The composite is a weighted blend of 9 inputs, each scored 0–100. Each bar is that input's sub-score; the figure is the points it added to the 100-point composite (weight × sub-score).
- Cash flow +15.0/30.0
- ARV discount +7.5/15.0
- 1% rule +5.0/10.0
- DSCR +5.0/10.0
- Rent growth +4.1/5.0
- Schools +3.8/10.0
- Livability +3.6/5.0
- Condition / age +2.2/5.0
- Appreciation +0.0/10.0
$25,000
🖨 Deal sheet (PDF) 📄 Offer letter ✓ Due diligence
Listing remarks
1 Bed 1 Bath property in Bossier City, Louisiana. This property is rented for $411.95 per month. This is a great opportunity for any owner, occupant, or buyer looking to expand their rental portfolio. This is part of a large portfolio. Please see the agent for details.
Key facts
- 5,009 sq ft lot
- Built 1932
- Listed 14 days
Property features AI
Finance
- Other: Property classified as single family residence; Property not attached to another unit
- Financial info: Treat as clear loan type; No second mortgage
- HOA & community: No homeowners association
Exterior
- Parking: No covered or carport spaces listed; Other parking features
- Utilities: City water; City sewer; No municipal utility district
- Home design: Single family residence; One story; Residential property; Built in 1932
- Construction: Built in 1932
- Exterior features: Lot less than 0.5 acre (about 0.115 acres); Subdivision: Cumberland
Interior
- Kitchen: Other appliances
- Bedrooms: 1 bedroom (Primary Bedroom on level 1)
- Bathrooms: 1 full bathroom
- Interior features: Two total rooms; One living area; One dining area; Other interior features
Neighborhood map
What this means for you Summary
Snapshot
- This is a 1-bed/1.0-bath single-family listed at $25k. Condition is rated fair.
Deal economics
- At list price, monthly cash flow is $664 ($8k/yr) — positive.
- The deal already cash-flows at list — no discount required.
- Meets the 1% rule at list price ($1k rent vs $25k).
- Cap rate 38.1% vs local median 4.7% in Bossier City — top-decile yield for the area; either an underpriced asset or a hidden risk that comps aren't pricing in. Stress-test before assuming the spread holds.
Location & tenants
- Location reads 71/100 on livability (#47 in LA) — a middle-class / working-renter tenant base. Strengths: commute A+, cost of living A+, housing A+; Watch: employment D+, crime F, amenities F.
- Bossier Parish (urban): math 40% / reading 47% proficiency, ranked #17 of 98 in LA (top 17%) — families likely to look elsewhere, expect single-tenant / working-renter base with shorter leases.
- Market conditions: Rents rising fast (+6.6%/yr); 421 active listings in the ZIP; 6 comparable units currently listed for rent nearby; rentals lingering (median 45d on market — plan ~5-8 weeks vacancy on turnover, expect pricing pressure); 67% of comp listings sitting > 30 days — soft ceiling on asking rent; 716 units permitted in Bossier Parish in 2024 (0 in 5+ unit buildings).
Forward outlook
- Local home prices are declining (-3.0%/yr); year-one equity from $173 of loan paydown is wiped out by about $750 of value loss. Plan a longer hold.
- Bossier County population projected at +28% by 2050 — long-run rental-demand tailwind backs the buy-and-hold thesis.
- At projected returns (-3.0% appreciation + 6.6% rent growth), your $7k cash investment doubles in ~1 year — after that, you're playing with house money.
Negotiation context
- Only 14 days on market — expect competitive offers; lowballing is unlikely to land.
Risks & watch-outs
- Watch-outs: built in 1932 — expect roof / HVAC / electrical / plumbing capex.
Questions for the listing agent
- Have any recent inspections been done? Can we get a copy of the seller's disclosures and any deferred-maintenance estimates?
- Built in 1932 — when were the roof, HVAC, electrical panel, plumbing, and water heater last replaced?
- Is there a deadline driving the sale (1031 exchange, divorce, estate, relocation)? That informs how much negotiation room exists.
- Schools are B-rated — typically a magnet for longer-tenancy family renters. What's the average tenant stay here, and is there a school-zone premium baked into asking?
- Crime grade is F in this area — have there been break-ins, vandalism, or insurance claims at this property in the last 3 years? What carrier currently insures it and at what premium?
- The area grade is low — what's the realistic commute time and amenity access for the typical tenant pool here? Any planned neighborhood developments (good or bad) we should know about?
- What's the average days-on-market for RENTAL listings here right now (not sales)? A rising rental-DOM trend means longer vacancies and softer asking-rent achievability than the comps imply.
- What's the recent tenant-quality profile in this submarket — average credit score on applications, eviction rate, late-payment / NSF rate, and stable-employment percentage? A property-management company in the area should have these aggregated.
- How much new for-sale + rental construction is in the pipeline within 1–3 miles? Heavy new supply typically softens prices + rents 12–24 months out; constrained supply supports both.
Investment metrics
- 1% rule
- 4.23% ✓
- Cap rate
- 38.14%
- Cash-on-cash
- 113.74%
- DSCR
- 6.06
- GRM
- 2.0
CMA / ARV
No comps found within radius.
Projected returns pro-forma
-3.0% appreciation · 6.56% rent growth · sell at horizon
- IRR
- —
- Equity multiple
- 7.02×
- Total profit
- $42,151
- Equity at exit
- $3,728
- IRR
- —
- Equity multiple
- 16.50×
- Total profit
- $108,525
- Equity at exit
- $2,162
Cash invested: $7,000 (down + closing). Projections, not guarantees.
Landlord ↔ Tenant lean methodology
- Overall (STATE)
- 90 Strongly Landlord-Friendly
- State Louisiana
- 90 Strongly Landlord-Friendly · R+12
- County
- — inherits STATE
- City
- — inherits STATE
ZIP-level market 71111
- Home prices YoY
- -34.8%
- Rents YoY
- 6.6%
- Active inventory
- 421
- Price-to-rent
- 2.0×
Monthly cashflow live
- Estimated rent
- $1,059 high interval (Pro) →
- Mortgage (P&I)
- −$131
- Tax est. 1.5%
- −$31 /mo · $375/yr
- Insurance
- −$10
- HOA
- −$0
- Vacancy / Maint / Mgmt
- −$222
- Net cashflow
- $664
Break-even live
Sensitivity live
| Price | -10% $681 | -5% $672 | +0% $664 | +5% $655 | +10% $646 |
|---|---|---|---|---|---|
| Rent | -10% $580 | -5% $622 | +0% $664 | +5% $705 | +10% $747 |
| Rate | -1.0pp $676 | -0.5pp $670 | base $664 | +0.5pp $657 | +1.0pp $650 |
UW: 25.0% down · 7.5% · 30yr · 1.5% tax · 5.0% vac · 8.0% maint · 8.0% mgmt
Financing live
Cash to close
- Down payment
- $6,250
- Closing costs
- $750
- Reserves months
- —
- Total cash needed
- —
Loan-product check · same deal, 3 products live
Conventional
25% down · 7.5% · 30yr
- Down + closing
- —
- Monthly P&I
- —
- Monthly cashflow
- —
- DSCR
- —
- Eligible?
- —
Personal DTI + credit; lowest rate.
DSCR
20% down · 8.5% · 30yr
- Down + closing
- —
- Monthly P&I
- —
- Monthly cashflow
- —
- DSCR
- —
- Eligible?
- —
No personal income docs; deal must DSCR.
Hard money
10% down · 12.0% · 12mo
- Down + closing
- —
- Monthly P&I
- —
- Monthly cashflow
- —
- DSCR
- —
- Eligible?
- —
Short-term bridge; refi at stabilization.
Rent comps 6 comps
| Address | Beds | Baths | Sqft | Rent | $/sqft | DOM | Units | Dist |
|---|---|---|---|---|---|---|---|---|
| 321 Edwards St Bossier City, LA | 2.0 | 1.0 | 676 | $750 | $1.11 | 44d | 1 | 0.24mi |
| 213 Kelly St Bossier City, LA | 2.0 | 1.0 | 598 | $1,300 | $2.17 | 14d | 1 | 0.29mi |
| 1820 E Texas St Bossier City, LA | 2.0 | 1.0 | 750 | $850 | $1.13 | 44d | 1 | 0.43mi |
| 719 Edwards St Shreveport, LA | 1.0–2.0 | 1.0 | 810 | $791 | $0.98 | 21d | 7 | 1.32mi |
| 100 Crossroads Blvd Bossier City, LA | 1.0–2.0 | 1.0–2.0 | 858 | $1,059 | $1.23 | 44d | 1 | 1.33mi |
| 400 Preston Blvd Bossier City, LA | 1.0 | 1.0 | 706 | $870 | $1.23 | 44d | 1 | 1.37mi |
Listing history 11 events
-
2026-06-18days on market $25,000 Active 14 DOM
-
2026-06-17days on market $25,000 Active 13 DOM
-
2026-06-16days on market $25,000 Active 12 DOM
-
2026-06-15days on market $25,000 Active 11 DOM
-
2026-06-14days on market $25,000 Active 9 DOM
-
2026-06-13days on market $25,000 Active 8 DOM
-
2026-06-10days on market $25,000 Active 6 DOM
-
2026-06-09days on market $25,000 Active 5 DOM
-
2026-06-08days on market $25,000 Active 4 DOM
-
2026-06-07remarks 269-char remark
-
2026-06-07$25,000 Active 3 DOM
ⓘ Source: listings_history table (triggers on properties + properties_extension) + one-shot
backfill from property_details.listing_events for pre-trigger history.
Nearby sold comps map
Loading sold comps map…
Walkable amenities ~0.75 mi
Loading nearby amenities…
Taxation est. · year 1
- Rental income
- $12,703
- − Mortgage interest
- −$1,400
- − Property taxes
- −$375
- − Insurance
- −$125
- − Repairs & maintenance
- −$1,016
- − Management
- −$1,016
- − Depreciation
- −$727
- Taxable income
- $8,043
- Est. tax owed @ 24.0%
- −$1,930
- After-tax cash flow
- $6,032/yr
For passive investors: Depreciation is non-cash, so a rental often shows a tax loss while cash-flowing — sheltering income. Rental losses are passive: they offset passive income freely, and up to $25,000/yr can offset ordinary (W-2) income if you actively participate and your MAGI is under $100k (phasing out to $0 by $150k); unused losses carry forward. On sale, claimed depreciation is recaptured at up to 25%, and gains may owe capital-gains tax (a 1031 exchange can defer both). Figures are a year-1 estimate at your 24.0% rate — not tax advice; consult a CPA.
Condition & rehab AI · 0 photos
This single-family home in Bossier City, LA, requires moderate renovations to improve its condition and value. Key areas needing attention include the kitchen, bathrooms, and exterior. Upgrading these areas will significantly enhance its resale and rental potential.
Repairs flagged
- Major Kitchen countertops — The countertops are visibly worn and need replacement.
- Major Bathroom fixtures — The fixtures are outdated and need to be replaced.
- Moderate Exterior siding — The siding shows signs of wear and tear, indicating a need for repair or replacement.
- Major Flooring — The flooring in the kitchen and bathrooms is in poor condition and needs replacement.
Value-add opportunities
- Resale Replace kitchen countertops and cabinets — New countertops and cabinets will significantly improve the kitchen's appearance and functionality, enhancing the home's resale value.
- Resale Replace bathroom fixtures — Upgrading the bathroom fixtures will improve the home's appeal and functionality, boosting its resale value.
- Both Paint interior walls and exterior siding — Painting will improve the home's curb appeal and interior aesthetics, benefiting both resale and rental value.
Renovation cost estimate screening
| Repair item | Severity | Est. cost |
|---|---|---|
| Kitchen countertops · The countertops are visibly worn and need replacement. | Major | $15,000–50,000 |
| Bathroom fixtures · The fixtures are outdated and need to be replaced. | Major | $15,000–50,000 |
| Exterior siding · The siding shows signs of wear and tear, indicating a need for repair or replacement. | Moderate | $3,000–15,000 |
| Flooring · The flooring in the kitchen and bathrooms is in poor condition and needs replacement. | Major | $15,000–50,000 |
| Total estimated repair cost · 4 items | $48,000–165,000 |
Value-add ROI direction
- Resale Replace kitchen countertops and cabinets — New countertops and cabinets will significantly improve the kitchen's appearance and functionality, enhancing the home's resale value. ↑
- Resale Replace bathroom fixtures — Upgrading the bathroom fixtures will improve the home's appeal and functionality, boosting its resale value. ↑
- Both Paint interior walls and exterior siding — Painting will improve the home's curb appeal and interior aesthetics, benefiting both resale and rental value. ↑
ⓘ Cost ranges are severity-bucket heuristics (US national rule-of-thumb). Get contractor quotes + a written scope before underwriting a rehab budget.
Schools (NCES district)
- District
- Bossier Parish
- NCES district ID
- 2200270
- Math proficiency
- 40% ▼ -32.00%
- Reading proficiency
- 47% ▼ -28.00%
- Median HH income
- $51,326
- Composite
- 37.5/100
- National rank
- #4402
- State rank
- #17 of 98 in LA
Livability — Bossier City
- Score
- 71/100
- State rank
- #47
- US rank
- #7044
Category grades
Schools grade is shown separately in the Schools card above.
Census & demographics
- Census place
- Bossier City, LA
- County
- Bossier Parish · 98,704 people
- City population
- 91,925
- Metro
- Shreveport-Bossier City, LA
- Population (ZIP)
- 43,925
- Household income
- $65,292
- Rent vs Own
- Severe rent burden
- 1942.0
Population outlook (Bossier County) Hauer SSP2
- Today (2025)
- 143,247 people
- By 2030
- 151,802 · +6.0%
- By 2040
- 168,194 · +17.4%
- By 2050
- 183,533 · +28.1%
- By 2075
- 217,009 · +51.5%
- By 2100
- 230,091 · +60.6%
Race, ethnicity, and origin ACS 2023
- Neighborhood character
- Diverse neighborhood (Simpson 0.60)
- Race & ethnicity
- White 56% Black 29% Hispanic / Latino 9% Two or more races 8% Asian 3%
- Hispanic origin (detail)
- Mexican 5%
- Common ancestry
- Lithuanian 2% Iranian 1% Slovak 1%
- Foreign-born
- 5% · Canada, Vietnam
- Languages at home
- 90% English-only · Spanish 7% Vietnamese 1% French/Haitian/Cajun 1%
Political lean MEDSL · Bossier
- 2024 margin
- Solid R (+43.3) · D 27.7% · R 71.0% · Other 1.3%
- 2008→2024 swing
- +0.3pp no change · 2008: -43.7pp · 2024: -43.3pp
- All cycles
- 2024: R+43.3 2020: R+41.0 2016: R+45.8 2012: R+45.4 2008: R+43.7
Not yet ingested
- Civics
- —
Market trends
- HPI YoY
- ▼ -79.78%
- Current HPI
- 149.4336
- Rent YoY
- ▲ 6.56%
- Metro
- Shreveport-Bossier City, LA
- State GDP YoY
- ▲ 3.29%
- F500 in state
- 10
Industry mix (Fortune 500 HQ in LA)
| Industry | F500 HQs | Revenue |
|---|---|---|
| Telecommunications | 2 | $23B |
|
||
| Utilities | 1 | $12B |
|
||
| Wholesale / Distribution | 1 | $5B |
|
||
| Advertising | 1 | $2B |
|
||
Price history
1 event — show timeline
- 2026-06-02 Listed $25,000 NTREIS
Cash-flow waterfall
monthlySold comps — $/sqft
last 12 mo · ≤1 miLoading sold comps…