None · Coral Springs, FL
Flood risk 1/10 · Minimal
- FEMA flood zone
- X (shaded)
- Chance of flooding over 30 yrs
- 0.0%
- Est. flood insurance / yr
- $507 – $1,088
Fire risk 1/10 · Minimal
- Est. fire insurance / yr
- $947 – $1,759
Heat risk 9/10 · Severe
- Hot days now (above 106°F)
- 7 days/yr
- Hot days in 30 yrs
- 26 days/yr
Wind risk 10/10 · Severe
- Chance of severe wind over 30 yrs
- 99.0%
Air-quality risk 2/10 · Minimal
- Unhealthy air days now
- 2 days/yr
- Unhealthy air days in 30 yrs
- 2 days/yr
Risk factors via First Street. Map © Google.
Why this score? — see what drove the C grade
The composite is a weighted blend of 9 inputs, each scored 0–100. Each bar is that input's sub-score; the figure is the points it added to the 100-point composite (weight × sub-score).
- Cash flow +18.6/30.0
- 1% rule +10.0/10.0
- ARV discount +7.5/15.0
- DSCR +5.8/10.0
- Schools +4.1/10.0
- Livability +4.0/5.0
- Condition / age +3.8/5.0
- Rent growth +2.5/5.0
- Appreciation +0.0/10.0
$130,000
🖨 Deal sheet (PDF) 📄 Offer letter ✓ Due diligence
Listing remarks
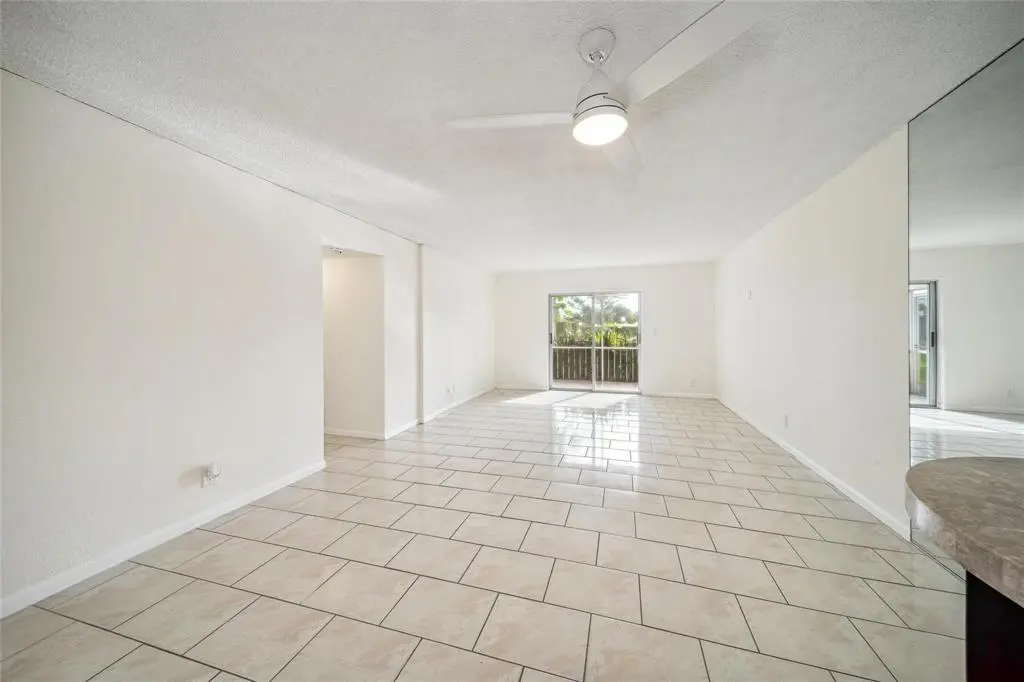
Briarwood Club in the heart of Coral Springs. Spacious 2-Beds, 2-Baths Move-In ready Condominium located on the 1st floor. Updated kitchen and tile throughout the unit. Updated bathrooms and freshly painted. Plenty of closet space, screened patio with garden & lake view with access to the yard area. All amenities included community pool, BBQ area, laundry facilities and much more. Quarterly Maintenance. Two-minute walk to the Community Pool. HOPA Community 55+. New roof - Roof assessment is paid in full. Owner is selling the property AS-IS
Key facts
- $593 HOA
- Parking
- Community pool
Property features AI
Finance
- HOA & community: Has homeowners association; Quarterly HOA fee; HOA includes maintenance of grounds and common areas; Association amenities: clubhouse, picnic area, parking, pool, trash chute; Senior community
Exterior
- Parking: Assigned parking; Guest parking; Open parking; Total of 1 parking space
- Utilities: Public water; Public sewer; Electric service available
- Home design: Condominium; One-level living; First-floor entry; West-facing
- Construction: CBS construction; Flat roof; Building name: Briarwood 1; Four-story building
- Exterior features: Screened patio; Patio; Waterfront: Yes (no waterfront features specified)
Interior
- Kitchen: Dishwasher; Electric range; Microwave; Refrigerator; Electric water heater
- Bedrooms: One main-level bedroom
- Flooring: Laminate flooring; Tile flooring
- Bathrooms: Two full bathrooms; One bathroom on the main level
- Heating & cooling: Central electric heating; Central air conditioning; Ceiling fans
- Interior features: Split bedroom floorplan
- Laundry & utility: Laundry in a common area
Neighborhood map
What this means for you Summary
Snapshot
- This is a 2-bed/2.0-bath condo listed at $130k. Condition is rated good.
Deal economics
- At list price, monthly cash flow is $126 ($2k/yr) — positive.
- The deal already cash-flows at list — no discount required.
- Meets the 1% rule at list price ($2k rent vs $130k).
- Recommended offer: $122k (6.0% below list) — sets the bar for market timing.
- Cap rate 7.5% vs local median 3.6% in Coral Springs — top-decile yield for the area; either an underpriced asset or a hidden risk that comps aren't pricing in. Stress-test before assuming the spread holds.
Location & tenants
- Location reads 79/100 on livability (#145 in FL, #2,163 nationally) — a middle-class / working-renter tenant base. Strengths: housing A+, health & safety A+, crime A; Watch: amenities F, cost of living F.
- Broward (suburban): math 42% / reading 53% proficiency, ranked #46 of 73 in FL (top 63%) — families likely to look elsewhere, expect single-tenant / working-renter base with shorter leases.
- Zoned schools: James S. Hunt Elementary School (math 49% / reading 37%, grade F, #1,366 of 2,144 statewide, top 64%, 502 students, 76% FRL); Forest Glen Middle School (math 46% / reading 49%, grade C-, #288 of 571 statewide, top 51%, 1,115 students, 62% FRL); Coral Springs High School (math 16% / reading 38%, grade F, #478 of 667 statewide, top 73%, 2,320 students, 59% FRL).
- Market conditions: Rents soft (-0.0%/yr); 370 active listings in the ZIP; 40 comparable units currently listed for rent nearby; rentals at typical pace (median 21d on market — plan ~3-4 weeks tenant-placement turnaround); 2,111 units permitted in Broward County in 2024 (1,265 in 5+ unit buildings).
- This rent runs 33% of the median local income ($74k/yr) — at the standard rent-burdened threshold; future hikes will face affordability resistance.
Forward outlook
- Local home prices are declining (-3.0%/yr); year-one equity from $899 of loan paydown is wiped out by about $4k of value loss. Plan a longer hold.
- Broward County population projected at +34% by 2050 — long-run rental-demand tailwind backs the buy-and-hold thesis.
Negotiation context
- It's been on market 88 days — a 6% lower offer ($122k) is reasonable based on typical stale-listing flexibility.
Risks & watch-outs
- Watch-outs: HOA is 29% of rent.
- Climate carrying-cost: severe wind risk, 99% chance of damaging wind over 30y; extreme-heat days projected 7→26/yr by 2055 (HVAC capex compounding) — expect insurance premiums to compound above CPI over the hold.
Questions for the listing agent
- It's been on market 88 days. Have you received any prior offers? Is the seller open to a 6% concession, seller financing, or rate buy-down credit?
- Built in 1969 — when were the roof, HVAC, electrical panel, plumbing, and water heater last replaced?
- What does the HOA fee cover, when was the last increase, and are there any pending special assessments or reserve-fund shortfalls?
- Any open or pending special assessments — roof, HVAC, plumbing, elevator, façade? What's the per-unit balance and payoff schedule, and is the seller paying it off at close or rolling it to the buyer?
- Why hasn't it sold? Are there any deal-killer items the seller is aware of (foundation, flood, title, zoning, code violations)?
- Is there a deadline driving the sale (1031 exchange, divorce, estate, relocation)? That informs how much negotiation room exists.
- Schools are A-rated — typically a magnet for longer-tenancy family renters. What's the average tenant stay here, and is there a school-zone premium baked into asking?
- What's the average days-on-market for RENTAL listings here right now (not sales)? A rising rental-DOM trend means longer vacancies and softer asking-rent achievability than the comps imply.
- What's the recent tenant-quality profile in this submarket — average credit score on applications, eviction rate, late-payment / NSF rate, and stable-employment percentage? A property-management company in the area should have these aggregated.
- How much new apartment / multifamily construction is in the pipeline within 1–3 miles? Heavy new supply (>2% of stock underway) typically softens rents 12–24 months out; light construction supports rent growth.
Investment metrics
- 1% rule
- 1.57% ✓
- Cap rate
- 7.45%
- Cash-on-cash
- 4.15%
- DSCR
- 1.18
- GRM
- 5.3
CMA / ARV
No comps found within radius.
Projected returns pro-forma
-3.0% appreciation · 0.0% rent growth · sell at horizon
- IRR
- -15.0%
- Equity multiple
- 0.49×
- Total profit
- $-18,660
- Equity at exit
- $19,383
- IRR
- -17.8%
- Equity multiple
- 0.24×
- Total profit
- $-27,513
- Equity at exit
- $11,240
Cash invested: $36,400 (down + closing). Projections, not guarantees.
Landlord ↔ Tenant lean methodology
- Overall (STATE)
- 87 Strongly Landlord-Friendly
- State Florida
- 87 Strongly Landlord-Friendly · R+3
- County
- — inherits STATE
- City
- — inherits STATE
ZIP-level market 33065
- Home prices YoY
- -22.0%
- Rents YoY
- -0.0%
- Active inventory
- 370
- Price-to-rent
- 5.3×
Monthly cashflow live
- Estimated rent
- $2,047 high interval (Pro) →
- Mortgage (P&I)
- −$682
- Tax est. 1.5%
- −$162 /mo · $1,950/yr
- Insurance
- −$54
- HOA
- −$593
- Vacancy / Maint / Mgmt
- −$430
- Net cashflow
- $126
Break-even live
Sensitivity live
| Price | -10% $216 | -5% $171 | +0% $126 | +5% $81 | +10% $36 |
|---|---|---|---|---|---|
| Rent | -10% $-36 | -5% $45 | +0% $126 | +5% $207 | +10% $287 |
| Rate | -1.0pp $191 | -0.5pp $159 | base $126 | +0.5pp $92 | +1.0pp $58 |
UW: 25.0% down · 7.5% · 30yr · 1.5% tax · 5.0% vac · 8.0% maint · 8.0% mgmt
Financing live
Cash to close
- Down payment
- $32,500
- Closing costs
- $3,900
- Reserves months
- —
- Total cash needed
- —
Loan-product check · same deal, 3 products live
Conventional
25% down · 7.5% · 30yr
- Down + closing
- —
- Monthly P&I
- —
- Monthly cashflow
- —
- DSCR
- —
- Eligible?
- —
Personal DTI + credit; lowest rate.
DSCR
20% down · 8.5% · 30yr
- Down + closing
- —
- Monthly P&I
- —
- Monthly cashflow
- —
- DSCR
- —
- Eligible?
- —
No personal income docs; deal must DSCR.
Hard money
10% down · 12.0% · 12mo
- Down + closing
- —
- Monthly P&I
- —
- Monthly cashflow
- —
- DSCR
- —
- Eligible?
- —
Short-term bridge; refi at stabilization.
Rent comps 40 comps
| Address | Beds | Baths | Sqft | Rent | $/sqft | DOM | Units | Dist |
|---|---|---|---|---|---|---|---|---|
| #8455 Pompano Beach, FL | 2.0 | 2.0 | 910 | $2,000 | $2.20 | 15d | 1 | 0.02mi |
| 3205 NW 103rd Ter Unit 103C Coral Springs, FL | 2.0 | 2.0 | 767 | $1,750 | $2.28 | 4d | 1 | 0.22mi |
| 3282 NW 102nd Ter Unit 204E Coral Springs, FL | 2.0 | 2.0 | 767 | $1,800 | $2.35 | 19d | 1 | 0.22mi |
| 3212 NW 103rd Ter Unit 107B Coral Springs, FL | 2.0 | 2.0 | 767 | $1,750 | $2.28 | 26d | 1 | 0.22mi |
| 3213 NW 103rd Ter Unit 107C Coral Springs, FL | 2.0 | 2.0 | 767 | $1,800 | $2.35 | 26d | 1 | 0.22mi |
| 3247 NW 103rd Ter Unit 308C Coral Springs, FL | 2.0 | 2.0 | 1050 | $1,800 | $1.71 | 26d | 1 | 0.24mi |
| 3258 NW 104th Ave #3258 Coral Springs, FL | 2.0 | 2.0 | 870 | $1,900 | $2.18 | 26d | 1 | 0.33mi |
| 3258 NW 104th Ave #3258 Coral Springs, FL | 2.0 | 2.0 | 870 | $1,900 | $2.18 | 14d | 1 | 0.33mi |
| 10379 NW 35th St Unit 10379 Coral Springs, FL | 2.0 | 2.0 | 740 | $2,350 | $3.18 | 5d | 1 | 0.34mi |
| 10379 NW 35th St Unit 10379 Coral Springs, FL | 2.0 | 2.0 | 740 | $2,350 | $3.18 | 26d | 1 | 0.34mi |
| 3249 Coral Hills Dr Coral Springs, FL | 1.0 | 1.0 | 624 | $1,725 | $2.76 | 20d | 1 | 0.40mi |
| 3162 Coral Springs Dr #4 Coral Springs, FL | 2.0 | 2.0 | 1100 | $2,100 | $1.91 | 5d | 1 | 0.42mi |
| 3162 Coral Springs Dr #4 Coral Springs, FL | 2.0 | 2.0 | 1100 | $2,125 | $1.93 | 26d | 1 | 0.42mi |
| 3100 Coral Springs Dr Coral Springs, FL | 2.0 | 2.0 | 1131 | $1,962 | $1.74 | 19d | 2 | 0.43mi |
| 10700 W Sample Rd Coral Springs, FL | 1.0–3.0 | 1.0–3.0 | 1141 | $2,298 | $2.01 | 0d | 5 | 0.46mi |
| 2966 Coral Springs Dr Coral Springs, FL | 2.0 | 2.0 | 1020 | $1,950 | $1.91 | 26d | 1 | 0.47mi |
| 10534 NW 29th Ct Coral Springs, FL | 2.0 | 2.0 | 1075 | $2,350 | $2.19 | 7d | 1 | 0.51mi |
| 3210 N University Dr Coral Springs, FL | 3.0 | 1.0–2.0 | 994 | $2,858 | $2.87 | 0d | 90 | 0.55mi |
| 2864 Coral Springs Dr #2864 Coral Springs, FL | 2.0 | 2.0 | 860 | $2,200 | $2.56 | 20d | 1 | 0.57mi |
| 2854 Coral Springs Dr #2854 Coral Springs, FL | 2.0 | 2.0 | 860 | $1,900 | $2.21 | 0d | 1 | 0.58mi |
| 3225 N University Dr Coral Springs, FL | 2.0 | 2.0 | 737 | $1,900 | $2.58 | 6d | 1 | 0.63mi |
| 3578 N University Dr Unit I5 Coral Springs, FL | 1.0 | 1.0 | 621 | $1,650 | $2.66 | 26d | 1 | 0.66mi |
| 3596 N University Dr Coral Springs, FL | 2.0 | 2.0 | 731 | $2,000 | $2.74 | 26d | 1 | 0.66mi |
| 3554 N University Dr Unit 3554 Coral Springs, FL | 2.0 | 2.0 | 737 | $1,700 | $2.31 | 26d | 1 | 0.66mi |
| 3712 N University Dr #3712 Coral Springs, FL | 2.0 | 2.0 | 737 | $1,700 | $2.31 | 24d | 1 | 0.66mi |
| 3662 N University Dr Unit F7 Coral Springs, FL | 2.0 | 2.0 | 737 | $1,999 | $2.71 | 26d | 1 | 0.66mi |
| 3664 N University Dr Unit C7 Coral Springs, FL | 2.0 | 2.0 | 737 | $1,800 | $2.44 | 26d | 1 | 0.66mi |
| 10722 La Placida Dr S Unit 9-B2 Coral Springs, FL | 2.0 | 2.0 | 1000 | $2,050 | $2.05 | 26d | 1 | 0.67mi |
| 3748 N University Dr Unit A8 Coral Springs, FL | 2.0 | 2.0 | 737 | $1,650 | $2.24 | 12d | 1 | 0.70mi |
| 3748 N University Dr Unit A8 Coral Springs, FL | 2.0 | 2.0 | 737 | $1,650 | $2.24 | 26d | 1 | 0.70mi |
| 9203 NW 38th Dr #2 Coral Springs, FL | 2.0 | 1.0 | 950 | $1,850 | $1.95 | 7d | 1 | 0.79mi |
| 10890 W Sample Rd Coral Springs, FL | 1.0–3.0 | 1.0–2.0 | 1102 | $2,540 | $2.30 | 0d | 17 | 0.82mi |
| 2801 NW 91st Ave Coral Springs, FL | 1.0–2.0 | 1.0–1.5 | 987 | $2,085 | $2.11 | 4d | 11 | 0.83mi |
| 9150 NW 38th Dr Coral Springs, FL | 1.0–2.0 | 1.5–2.0 | 950 | $2,280 | $2.40 | 26d | 2 | 0.84mi |
| 9150 NW 38th Dr Coral Springs, FL | 1.0–2.0 | 1.5–2.0 | 950 | $2,200 | $2.32 | 4d | 2 | 0.84mi |
| 9286 NW 40th St Coral Springs, FL | 2.0 | 1.5 | 910 | $1,725 | $1.90 | 26d | 1 | 0.86mi |
| 9270 NW 40th St Coral Springs, FL | 2.0 | 1.5 | 988 | $2,200 | $2.23 | 15d | 1 | 0.88mi |
| 8958 W Sample Rd #8958 Coral Springs, FL | 2.0 | 1.5 | 970 | $2,250 | $2.32 | 26d | 1 | 0.88mi |
| 8958 W Sample Rd Coral Springs, FL | 2.0 | 1.5 | 970 | $2,250 | $2.32 | 4d | 1 | 0.88mi |
| 9022 NW 28th Dr Unit 2-312 Coral Springs, FL | 3.0 | 2.0 | 1054 | $2,495 | $2.37 | 12d | 1 | 0.90mi |
HOA detail condo
- Monthly dues
- $593 · $7,116/yr
- Likely covers
- pool
- ⚠ Special-assessment mentions
-
…facilities and much more. Quarterly Maintenance. Two-minute walk to the Community Pool. HOPA Community 55+. New roof - Roof assessment is paid in full. Owner is selling the property AS-IS
Listing history 17 events
-
2026-06-21remarks 547-char remark
-
2026-06-21days on market $130,000 Active 88 DOM
-
2026-06-18days on market $130,000 Active 85 DOM
-
2026-06-17days on market $130,000 Active 84 DOM
-
2026-06-16days on market $130,000 Active 83 DOM
-
2026-06-15days on market $130,000 Active 82 DOM
-
2026-06-13days on market $130,000 Active 80 DOM
-
2026-06-09days on market $130,000 Active 76 DOM
-
2026-06-08days on market $130,000 Active 75 DOM
-
2026-06-07days on market $130,000 Active 74 DOM
-
2026-06-04days on market $130,000 Active 71 DOM
-
2026-06-03days on market $130,000 Active 70 DOM
-
2026-06-02days on market $130,000 Active 69 DOM
-
2026-06-01days on market $130,000 Active 68 DOM
-
2026-05-31days on market $130,000 Active 67 DOM
-
2026-05-10price $130,000
-
2026-03-25$159,000 Active
ⓘ Source: listings_history table (triggers on properties + properties_extension) + one-shot
backfill from property_details.listing_events for pre-trigger history.
Climate risk First Street
- Flood 1/10 Low FEMA zone X (shaded) · 0% chance over 30 yrs
- Wildfire 1/10 Low
- Heat 9/10 Extreme 7 d/yr ≥106°F today · 26 d/yr by 30 yrs out
- Wind 10/10 Extreme 99% chance of damaging wind over 30 yrs
- Air quality 2/10 Low 2 unhealthy d/yr today · 2 by 30 yrs out
Nearby sold comps map
Loading sold comps map…
Walkable amenities ~0.75 mi
Loading nearby amenities…
Taxation est. · year 1
- Rental income
- $24,564
- − Mortgage interest
- −$7,282
- − Property taxes
- −$1,950
- − Insurance
- −$650
- − Repairs & maintenance
- −$1,965
- − Management
- −$1,965
- − HOA
- −$7,116
- − Depreciation
- −$3,782
- Taxable loss
- −$146
- Est. tax savings @ 24.0%
- +$35
- After-tax cash flow
- $1,544/yr
For passive investors: Depreciation is non-cash, so a rental often shows a tax loss while cash-flowing — sheltering income. Rental losses are passive: they offset passive income freely, and up to $25,000/yr can offset ordinary (W-2) income if you actively participate and your MAGI is under $100k (phasing out to $0 by $150k); unused losses carry forward. On sale, claimed depreciation is recaptured at up to 25%, and gains may owe capital-gains tax (a 1031 exchange can defer both). Figures are a year-1 estimate at your 24.0% rate — not tax advice; consult a CPA.
Condition & rehab AI · 13 photos
This move-in ready condo in Briarwood Club offers updated kitchens and bathrooms, fresh paint, and tile flooring throughout. It's located in a desirable community with amenities and a lake view.
Value-add opportunities
- Both Painting the exterior and interior walls — Fresh paint enhances curb appeal and interior aesthetics.
- Both Updating the flooring — New flooring can improve the overall look and feel of the home.
- Both Upgrading the kitchen appliances — Modern appliances can attract more buyers and renters.
- Both Renovating the bathrooms — Fresh bathrooms can make the home more appealing to potential buyers and renters.
Renovation cost estimate screening
Value-add ROI direction
- Both Painting the exterior and interior walls — Fresh paint enhances curb appeal and interior aesthetics. ↑
- Both Updating the flooring — New flooring can improve the overall look and feel of the home. ↑
- Both Upgrading the kitchen appliances — Modern appliances can attract more buyers and renters. ↑
- Both Renovating the bathrooms — Fresh bathrooms can make the home more appealing to potential buyers and renters. ↑
ⓘ Cost ranges are severity-bucket heuristics (US national rule-of-thumb). Get contractor quotes + a written scope before underwriting a rehab budget.
Schools (NCES district)
- District
- Broward
- NCES district ID
- 1200180
- Math proficiency
- 42% ▼ -18.00%
- Reading proficiency
- 53% ▼ -5.00%
- Median HH income
- $52,139
- Composite
- 40.88/100
- National rank
- #3621
- State rank
- #46 of 73 in FL
Livability — Coral Springs
- Score
- 79/100
- State rank
- #145
- US rank
- #2163
Category grades
Schools grade is shown separately in the Schools card above.
Census & demographics
- Census place
- Coral Springs, FL
- County
- Broward County · 1,963,430 people
- City population
- 101,171
- Metro
- Miami-Fort Lauderdale-Pompano Beach, FL
- Population (ZIP)
- 58,916
- Household income
- $74,226
- Rent vs Own
- Severe rent burden
- 3488.0
Population outlook (Broward County) Hauer SSP2
- Today (2025)
- 2,207,033 people
- By 2030
- 2,360,704 · +7.0%
- By 2040
- 2,661,208 · +20.6%
- By 2050
- 2,946,698 · +33.5%
- By 2075
- 3,602,273 · +63.2%
- By 2100
- 3,970,984 · +79.9%
Race, ethnicity, and origin ACS 2023
- Neighborhood character
- Highly diverse neighborhood (Simpson 0.72)
- Race & ethnicity
- Hispanic / Latino 33% White 30% Black 28% Two or more races 21% Asian 3%
- Hispanic origin (detail)
- Mexican 4% Puerto Rican 5% Cuban 2% Dominican 3%
- Common ancestry
- Hispanic 9% Romanian 2% Estonian 1%
- Foreign-born
- 35% · Canada, Jamaica, China
- Languages at home
- 61% English-only · Spanish 26% French/Haitian/Cajun 8% Other Indo-European 3%
Political lean MEDSL · Broward
- 2024 margin
- D (+17.0) · D 58.0% · R 41.0%
- 2008→2024 swing
- -17.8pp toward R · 2008: 34.7pp · 2024: 17.0pp
- All cycles
- 2024: D+17.0 2020: D+29.8 2016: D+35.0 2012: D+34.9 2008: D+34.7
Not yet ingested
- Civics
- —
Market trends
- HPI YoY
- ▼ -113.43%
- Current HPI
- 402.3476
- Rent YoY
- ▬ -0.03%
- Metro
- Miami-Fort Lauderdale-Pompano Beach, FL
- State GDP YoY
- ▲ 3.28%
- F500 in state
- 36
Industry mix (Fortune 500 HQ in FL)
| Industry | F500 HQs | Revenue |
|---|---|---|
| Industrial Technology | 2 | $29B |
|
||
| Insurance | 2 | $17B |
|
||
| Retail | 1 | $60B |
|
||
| Technology Distribution | 1 | $58B |
|
||
| Homebuilding | 1 | $35B |
|
||
| Technology Manufacturing | 1 | $35B |
|
||
Price history
-18.2% since first listed2 events — show timeline
- 2026-05-10 Price Changed $130,000 Beaches MLS
- 2026-03-25 Listed $159,000 Beaches MLS
Cash-flow waterfall
monthlySold comps — $/sqft
last 12 mo · ≤1 miLoading sold comps…