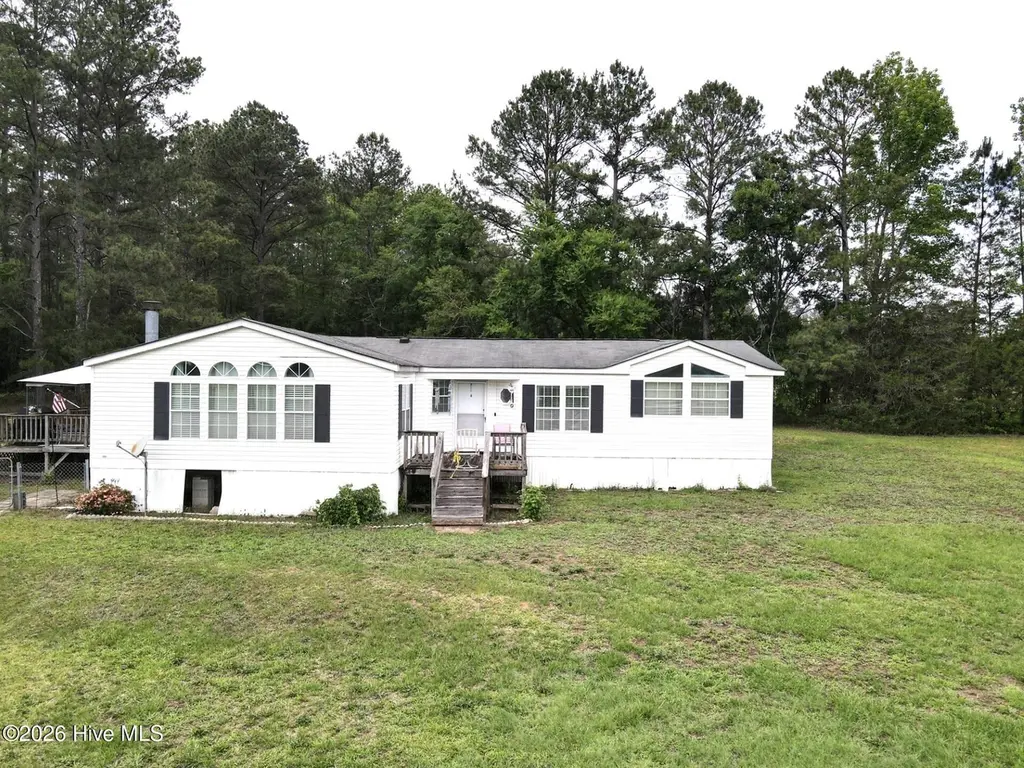
122 Langston Dr · Appling, GA
Flood risk 1/10 · Minimal
- FEMA flood zone
- X (unshaded)
- Chance of flooding over 30 yrs
- 0.0%
- Est. flood insurance / yr
- $507 – $1,088
Fire risk 4/10 · Minor
- Est. fire insurance / yr
- $963 – $1,789
Heat risk 6/10 · Moderate
- Hot days now (above 106°F)
- 7 days/yr
- Hot days in 30 yrs
- 17 days/yr
Wind risk 7/10 · Major
- Chance of severe wind over 30 yrs
- 75.0%
Air-quality risk 2/10 · Minimal
- Unhealthy air days now
- 1 days/yr
- Unhealthy air days in 30 yrs
- 1 days/yr
Risk factors via First Street. Map © Google.
Why this score? — see what drove the B grade
The composite is a weighted blend of 9 inputs, each scored 0–100. Each bar is that input's sub-score; the figure is the points it added to the 100-point composite (weight × sub-score).
- Cash flow +30.0/30.0
- ARV discount +13.7/15.0
- DSCR +10.0/10.0
- 1% rule +8.6/10.0
- Schools +4.5/10.0
- Livability +2.9/5.0
- Rent growth +2.8/5.0
- Condition / age +2.5/5.0
- Appreciation +0.0/10.0
$165,000
🖨 Deal sheet 📄 Offer letter ✓ Due diligence
Listing remarks
Enjoy Country Living on this 2.5 acre retreat! This well loved home offers a split floor plan with 3 bedrooms and 2 baths, a large living room and a separate family room with wood burning fireplace for cozy winter nights. Primary Suite features a walk in closet, jetted tub and walk in shower.
Key facts
- Split floor plan
- Walk in closet
- Jetted tub
Tags
Property features AI
Exterior
- Parking: Unpaved parking
- Security: Pets allowed; Horses allowed
- Utilities: Public water available; Septic tank; Water service available
- Home design: Residential manufactured home; One-story (entry level is 1); One level
- Construction: Vinyl siding over frame construction; Composition roof; Other foundation
- Exterior features: Deck; Chain link fencing; Property has a view; Other structures (see remarks); Secluded setting
Interior
- Kitchen: Refrigerator; Dishwasher; Electric range; Vented exhaust fan
- Bedrooms: Bedrooms: total not specified (master downstairs noted)
- Flooring: Carpet; Vinyl
- Bathrooms: 2 full bathrooms; Accessible full bath; Therapeutic whirlpool
- Heating & cooling: Central air; Heat pump for heating and cooling; Fireplace(s); Electric heating
- Interior features: Master suite on the main level; Walk-in closet(s); Kitchen island; Ceiling fan(s); Pantry; Eat-in kitchen; Tile counters; Window coverings; Negotiable furnishing
- Laundry & utility: Laundry room with washer hookup; Electric water heater
Neighborhood map
What this means for you Summary
Snapshot
- This is a 4-bed/2.0-bath manufactured listed at $165k.
Deal economics
- At list price, monthly cash flow is $634 ($8k/yr) — positive.
- The deal already cash-flows at list — no discount required.
- Meets the 1% rule at list price ($2k rent vs $165k).
- Recommended offer: $163k (1.5% below list) — sets the bar for market timing.
- Cap rate 10.9% vs local median 1.1% in Appling — top-decile yield for the area; either an underpriced asset or a hidden risk that comps aren't pricing in. Stress-test before assuming the spread holds.
Location & tenants
- Location reads 57/100 on livability (#457 in GA) — a working-class tenant base; expect higher turnover. Strengths: cost of living A; Watch: housing D+, amenities F, commute F.
- Columbia County (suburban): math 49% / reading 52% proficiency, ranked #13 of 174 in GA (top 8%) — acceptable for families but not a draw, mixed tenant base, ~2y average lease.
- Zoned schools: Euchee Creek Elementary School (math 53% / reading 42%, grade D, #298 of 1,228 statewide, top 24%, 657 students, 36% FRL); Harlem Middle School (math 36% / reading 42%, grade F, #155 of 470 statewide, top 33%, 981 students, 39% FRL); Harlem High School (math 8% / reading 22%, grade F, #297 of 424 statewide, top 74%, 1,223 students, 33% FRL).
- Zoned-school proficiency averages 34% at this address vs 50% district-wide (-17 pts) — the specific schools serving this property underperform the Columbia County average; the district grade overstates school quality for this exact location.
- Market conditions: Rents rising (+1.1%/yr); 724 active listings in the ZIP; solid renter incomes; 1,213 units permitted in Columbia County in 2024 (0 in 5+ unit buildings).
- This rent runs 31% of the median local income ($87k/yr) — at the standard rent-burdened threshold; future hikes will face affordability resistance.
Forward outlook
- Local home prices are declining (-3.0%/yr); year-one equity from $1k of loan paydown is wiped out by about $5k of value loss. Plan a longer hold.
- Columbia County population projected at +62% by 2050 — long-run rental-demand tailwind backs the buy-and-hold thesis.
- At projected returns (-3.0% appreciation + 1.1% rent growth), your $46k cash investment doubles in ~9 years — after that, you're playing with house money.
Negotiation context
- It's been on market 21 days — a 2% lower offer ($163k) is reasonable based on typical stale-listing flexibility.
- Current owner paid $70k; list at $165k implies a 136% gain — meaningful room to come down on a strong offer.
Risks & watch-outs
- Climate carrying-cost: major wind risk, 75% chance of damaging wind over 30y; extreme-heat days projected 7→17/yr by 2055 (HVAC capex compounding) — expect insurance premiums to compound above CPI over the hold.
Questions for the listing agent
- Is there a deadline driving the sale (1031 exchange, divorce, estate, relocation)? That informs how much negotiation room exists.
- What's the average days-on-market for RENTAL listings here right now (not sales)? A rising rental-DOM trend means longer vacancies and softer asking-rent achievability than the comps imply.
- What's the recent tenant-quality profile in this submarket — average credit score on applications, eviction rate, late-payment / NSF rate, and stable-employment percentage? A property-management company in the area should have these aggregated.
- How much new for-sale + rental construction is in the pipeline within 1–3 miles? Heavy new supply typically softens prices + rents 12–24 months out; constrained supply supports both.
Investment metrics
- 1% rule
- 1.36% ✓
- Cap rate
- 10.91%
- Cash-on-cash
- 16.48%
- DSCR
- 1.73
- GRM
- 6.1
CMA / ARV
- ARV (on-the-fly)
- $191,565
- Comps found
- 1
Show comp detail 1 sale within ~0.75 mi
| Address | Dist | Beds/Ba | Sqft | Sold | Price | $/sf | Match |
|---|---|---|---|---|---|---|---|
| 322 Annie Laurie Dr | 0.50mi | 4/2.0 | 1,674 (-14%) | 14mo | $165,000 | $99 | 43 |
Match score weights: distance 35% · size 25% · config 20% · recency 20%. Top-matched comps best support the ARV.
Projected returns pro-forma
-3.0% appreciation · 1.15% rent growth · sell at horizon
- IRR
- 5.5%
- Equity multiple
- 1.21×
- Total profit
- $9,595
- Equity at exit
- $24,602
- IRR
- 13.1%
- Equity multiple
- 1.96×
- Total profit
- $44,285
- Equity at exit
- $14,266
Cash invested: $46,200 (down + closing). Projections, not guarantees.
Landlord ↔ Tenant lean methodology
- Overall (STATE)
- 90 Strongly Landlord-Friendly
- State Georgia
- 90 Strongly Landlord-Friendly · R+3
- County
- — inherits STATE
- City
- — inherits STATE
ZIP-level market 30813
- Home prices YoY
- -29.2%
- Rents YoY
- 1.1%
- Active inventory
- 724
- Price-to-rent
- 6.1×
Monthly cashflow live
- Estimated rent
- $2,246 medium interval (Pro) →
- Mortgage (P&I)
- −$865
- Tax est. 1.5%
- −$206 /mo · $2,475/yr
- Insurance
- −$69
- HOA
- −$0
- Vacancy / Maint / Mgmt
- −$472
- Net cashflow
- $634
Break-even live
UW: 25.0% down · 7.5% · 30yr · 1.5% tax · 5.0% vac · 8.0% maint · 8.0% mgmt
Financing live
Cash to close
- Down payment
- $41,250
- Closing costs
- $4,950
- Reserves months
- —
- Total cash needed
- —
Loan-product check · same deal, 3 products live
Conventional
25% down · 7.5% · 30yr
- Down + closing
- —
- Monthly P&I
- —
- Monthly cashflow
- —
- DSCR
- —
- Eligible?
- —
Personal DTI + credit; lowest rate.
DSCR
20% down · 8.5% · 30yr
- Down + closing
- —
- Monthly P&I
- —
- Monthly cashflow
- —
- DSCR
- —
- Eligible?
- —
No personal income docs; deal must DSCR.
Hard money
10% down · 12.0% · 12mo
- Down + closing
- —
- Monthly P&I
- —
- Monthly cashflow
- —
- DSCR
- —
- Eligible?
- —
Short-term bridge; refi at stabilization.
Listing history 17 events
-
2026-06-18days on market $165,000 Active 21 DOM
-
2026-06-17days on market $165,000 Active 20 DOM
-
2026-06-16days on market $165,000 Active 19 DOM
-
2026-06-15days on market $165,000 Active 18 DOM
-
2026-06-14days on market $165,000 Active 16 DOM
-
2026-06-13pricedays on market $165,000 Active 15 DOM
-
2026-06-10days on market $170,000 Active 13 DOM
-
2026-06-09days on market $170,000 Active 12 DOM
-
2026-06-08days on market $170,000 Active 11 DOM
-
2026-06-07days on market $170,000 Active 10 DOM
-
2026-06-03days on market $170,000 Active 6 DOM
-
2026-06-02days on market $170,000 Active 5 DOM
-
2026-06-01days on market $170,000 Active 4 DOM
-
2026-05-31days on market $170,000 Active 3 DOM
-
2026-05-30days on market $170,000 Active 2 DOM
-
2026-05-28$170,000 Active
-
2020-06-17soldstatus $70,000
ⓘ Source: listings_history table (triggers on properties + properties_extension) + one-shot
backfill from property_details.listing_events for pre-trigger history.
Climate risk First Street
- Flood 1/10 Low FEMA zone X (unshaded) · 0% chance over 30 yrs
- Wildfire 4/10 Moderate
- Heat 6/10 Major 7 d/yr ≥106°F today · 17 d/yr by 30 yrs out
- Wind 7/10 Severe 75% chance of damaging wind over 30 yrs
- Air quality 2/10 Low 1 unhealthy d/yr today · 1 by 30 yrs out
Nearby sold comps map
Loading sold comps map…
Walkable amenities ~0.75 mi
Loading nearby amenities…
Taxation est. · year 1
- Rental income
- $26,957
- − Mortgage interest
- −$9,243
- − Property taxes
- −$2,475
- − Insurance
- −$825
- − Repairs & maintenance
- −$2,157
- − Management
- −$2,157
- − Depreciation
- −$4,800
- Taxable income
- $5,301
- Est. tax owed @ 24.0%
- −$1,272
- After-tax cash flow
- $6,340/yr
For passive investors: Depreciation is non-cash, so a rental often shows a tax loss while cash-flowing — sheltering income. Rental losses are passive: they offset passive income freely, and up to $25,000/yr can offset ordinary (W-2) income if you actively participate and your MAGI is under $100k (phasing out to $0 by $150k); unused losses carry forward. On sale, claimed depreciation is recaptured at up to 25%, and gains may owe capital-gains tax (a 1031 exchange can defer both). Figures are a year-1 estimate at your 24.0% rate — not tax advice; consult a CPA.
Schools (NCES district)
- District
- Columbia County
- NCES district ID
- 1301410
- Math proficiency
- 49% ▼ -6.00%
- Reading proficiency
- 52% ▼ -4.00%
- Median HH income
- $69,358
- Composite
- 45.04/100
- National rank
- #2695
- State rank
- #13 of 174 in GA
Livability — Appling
- Score
- 57/100
- State rank
- #457
- US rank
- #21719
Category grades
Schools grade is shown separately in the Schools card above.
Census & demographics
- County
- Columbia County · 154,184 people
- Metro
- Augusta-Richmond County, GA-SC
- Population (ZIP)
- 52,466
- Household income
- $86,923
- Rent vs Own
- Severe rent burden
- 960.0
Population outlook (Columbia County) Hauer SSP2
- Today (2025)
- 189,073 people
- By 2030
- 212,277 · +12.3%
- By 2040
- 259,480 · +37.2%
- By 2050
- 306,991 · +62.4%
- By 2075
- 421,213 · +122.8%
- By 2100
- 496,722 · +162.7%
Race, ethnicity, and origin ACS 2023
- Neighborhood character
- Diverse neighborhood (Simpson 0.65)
- Race & ethnicity
- White 51% Black 29% Hispanic / Latino 11% Two or more races 10% Asian 2%
- Hispanic origin (detail)
- Mexican 5% Puerto Rican 3%
- Common ancestry
- Italian 2% Serbian 1% Lithuanian 1%
- Foreign-born
- 6% · Canada, Vietnam
- Languages at home
- 88% English-only · Spanish 7% German/W. Germanic 2% Other Indo-European 1%
Political lean MEDSL · Columbia
- 2024 margin
- Strong R (+25.6) · D 36.8% · R 62.5%
- 2008→2024 swing
- +17.0pp toward D · 2008: -42.7pp · 2024: -25.6pp
- All cycles
- 2024: R+25.6 2020: R+25.8 2016: R+37.7 2012: R+43.0 2008: R+42.7
Not yet ingested
- Civics
- —
Market trends
- HPI YoY
- ▼ -96.24%
- Current HPI
- 233.821
- Rent YoY
- ▲ 1.15%
- Metro
- Augusta-Richmond County, GA-SC
- State GDP YoY
- ▲ 2.66%
- F500 in state
- 28
Industry mix (Fortune 500 HQ in GA)
| Industry | F500 HQs | Revenue |
|---|---|---|
| Paper / Packaging | 2 | $29B |
|
||
| Retail | 1 | $160B |
|
||
| Transportation / Logistics | 1 | $91B |
|
||
| Airlines | 1 | $62B |
|
||
| Consumer Goods | 1 | $47B |
|
||
| Utilities | 1 | $25B |
|
||
Price history
+142.9% since first listed2 events — show timeline
- 2026-05-28 Listed $170,000 Hive MLS
- 2020-06-17 Sold (Public Records) $70,000 Public Records
Cash-flow waterfall
monthlySold comps — $/sqft
last 12 mo · ≤1 miLoading sold comps…