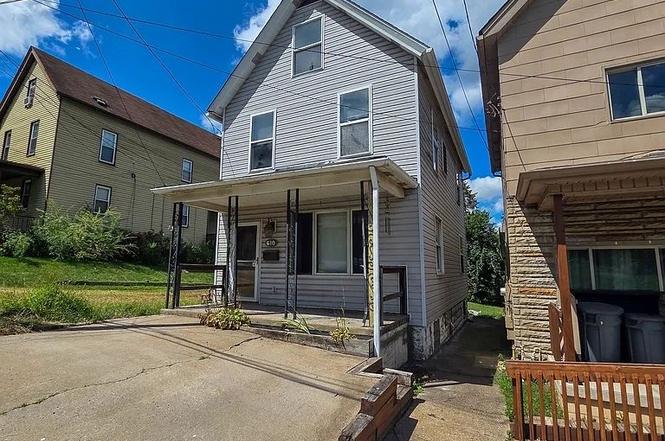
610 Dawson St · Wall, PA
Flood risk 1/10 · Minimal
- FEMA flood zone
- X (unshaded)
- Chance of flooding over 30 yrs
- 0.0%
- Est. flood insurance / yr
- $473 – $860
Fire risk 1/10 · Minimal
- Est. fire insurance / yr
- $511 – $949
Heat risk 4/10 · Minor
- Hot days now (above 96°F)
- 7 days/yr
- Hot days in 30 yrs
- 19 days/yr
Wind risk 2/10 · Minimal
- Chance of severe wind over 30 yrs
- 0.0%
Air-quality risk 4/10 · Minor
- Unhealthy air days now
- 5 days/yr
- Unhealthy air days in 30 yrs
- 7 days/yr
Risk factors via First Street. Map © Google.
Why this score? — see what drove the C- grade
The composite is a weighted blend of 9 inputs, each scored 0–100. Each bar is that input's sub-score; the figure is the points it added to the 100-point composite (weight × sub-score).
- Cash flow +24.5/30.0
- DSCR +7.9/10.0
- 1% rule +5.7/10.0
- Appreciation +3.7/10.0
- Livability +3.1/5.0
- Rent growth +2.5/5.0
- Condition / age +2.5/5.0
- Schools +1.8/10.0
- ARV discount +0.0/15.0
$99,500
🖨 Deal sheet 📄 Offer letter ✓ Due diligence
Listing remarks
Welcome to 610 Dawson Street!! This turnkey 2-bedroom, 1-bathroom rental property offers more than meets the eye!! Upon entry, you will find the large living room that offers plenty of space perfect for family gatherings. The eat-in kitchen boasts shaker-style cabinets, stainless steel stove/microware, and durable tiled countertops. On the second level, you will find two spacious bedrooms that provides great spaces making the property even more appealing to renters. On the third level is an attic space that can be finished as a 3rd bedroom adding the potential for additional income. With the electrical already in place, all that is needed is the finishing touches. The large dry basement i
Key facts
- Large living room
- Eat-in kitchen
- 2,178 sq ft lot
Tags
Neighborhood map
What this means for you Summary
Snapshot
- This is a 3-bed/1.0-bath single-family listed at $100k.
Deal economics
- At list price, monthly cash flow is $203 ($2k/yr) — positive.
- The deal already cash-flows at list — no discount required.
- Meets the 1% rule at list price ($1k rent vs $100k).
- Recommended offer: $97k (3.0% below list) — sets the bar for market timing.
Location & tenants
- Location reads 61/100 on livability (#1,405 in PA) — a middle-class / working-renter tenant base. Strengths: cost of living A+, housing A+; Watch: crime C-, employment D, schools F.
- East Allegheny SD (suburban): math 14% / reading 30% proficiency, ranked #485 of 539 in PA (top 90%) — low school quality limits family demand, transient renter base, plan for 1-2y turnover.
- Market conditions: 13 active listings in the ZIP; 5 comparable units currently listed for rent nearby; rentals at typical pace (median 17d on market — plan ~3-4 weeks tenant-placement turnaround); 2,996 units permitted in Allegheny County in 2024 (1,588 in 5+ unit buildings).
Forward outlook
- Local home prices are declining (-2.6%/yr); year-one equity from $688 of loan paydown is wiped out by about $3k of value loss. Plan a longer hold.
Negotiation context
- It's been on market 46 days — a 3% lower offer ($97k) is reasonable based on typical stale-listing flexibility.
- 2 sale attempts with the ask held roughly flat each time — persistent listings suggest the price (not the market) is what's stuck; bring a comps-based counter.
- Current owner paid $26k; list at $100k implies a 283% gain — meaningful room to come down on a strong offer.
Risks & watch-outs
- Watch-outs: built in 1925 — expect roof / HVAC / electrical / plumbing capex.
Questions for the listing agent
- It's been on market 46 days. Have you received any prior offers? Is the seller open to a 3% concession, seller financing, or rate buy-down credit?
- Built in 1925 — when were the roof, HVAC, electrical panel, plumbing, and water heater last replaced?
- Is there a deadline driving the sale (1031 exchange, divorce, estate, relocation)? That informs how much negotiation room exists.
- Schools are F-rated, which usually means shorter tenancies and higher turnover. Who's the typical renter profile here, and what's been the actual vacancy rate?
- What's the average days-on-market for RENTAL listings here right now (not sales)? A rising rental-DOM trend means longer vacancies and softer asking-rent achievability than the comps imply.
- What's the recent tenant-quality profile in this submarket — average credit score on applications, eviction rate, late-payment / NSF rate, and stable-employment percentage? A property-management company in the area should have these aggregated.
- How much new for-sale + rental construction is in the pipeline within 1–3 miles? Heavy new supply typically softens prices + rents 12–24 months out; constrained supply supports both.
Investment metrics
- 1% rule
- 1.07% ✓
- Cap rate
- 8.74%
- Cash-on-cash
- 8.75%
- DSCR
- 1.39
- GRM
- 7.8
CMA / ARV
- ARV (on-the-fly)
- $85,050
- Comps found
- 7
Show comp detail 7 sales within ~0.75 mi
| Address | Dist | Beds/Ba | Sqft | Sold | Price | $/sf | Match |
|---|---|---|---|---|---|---|---|
| 533 3rd St | 0.54mi | 4/1.0 (+1) | 1,400 (+4%) | 1mo | $134,900 | $96 | 62 |
| 365 Kenney Ave | 0.58mi | 4/1.0 (+1) | 1,348 (-0%) | 11mo | $55,000 | $41 | 59 |
| 304 Patterson St | 0.67mi | 4/1.0 (+1) | 1,330 (-2%) | 20mo | $15,000 | $11 | 45 |
| 304 Valley Ave | 0.70mi | 3/1.5 | 1,403 (+4%) | 21mo | $100,000 | $71 | 42 |
| 215 Hillside Ave | 0.59mi | 2/1.0 (-1) | 1,240 (-8%) | 20mo | $10,000 | $8 | 37 |
| 582 4th St | 0.62mi | 2/1.0 (-1) | 1,222 (-10%) | 23mo | $76,500 | $63 | 31 |
| 721 7th St | 0.73mi | 3/1.5 | 1,152 (-15%) | 23mo | $150,000 | $130 | 20 |
Match score weights: distance 35% · size 25% · config 20% · recency 20%. Top-matched comps best support the ARV.
Projected returns pro-forma
-2.6% appreciation · 3.0% rent growth · sell at horizon
- IRR
- -1.4%
- Equity multiple
- 0.94×
- Total profit
- $-1,543
- Equity at exit
- $16,603
- IRR
- 7.5%
- Equity multiple
- 1.60×
- Total profit
- $16,688
- Equity at exit
- $11,669
Cash invested: $27,860 (down + closing). Projections, not guarantees.
Landlord ↔ Tenant lean methodology
- Overall (STATE)
- 62 Landlord-Friendly
- State Pennsylvania
- 62 Landlord-Friendly · EVEN
- County
- — inherits STATE
- City
- — inherits STATE
ZIP-level market 15148
- Home prices YoY
- -1.8%
- Active inventory
- 13
- Price-to-rent
- 7.8×
Monthly cashflow live
- Estimated rent
- $1,065 high interval (Pro) →
- Mortgage (P&I)
- −$522
- Tax from tax record
- −$75 /mo · $904/yr
- Insurance
- −$41
- HOA
- −$0
- Vacancy / Maint / Mgmt
- −$224
- Net cashflow
- $203
Break-even live
UW: 25.0% down · 7.5% · 30yr · 1.5% tax · 5.0% vac · 8.0% maint · 8.0% mgmt
Financing live
Cash to close
- Down payment
- $24,875
- Closing costs
- $2,985
- Reserves months
- —
- Total cash needed
- —
Loan-product check · same deal, 3 products live
Conventional
25% down · 7.5% · 30yr
- Down + closing
- —
- Monthly P&I
- —
- Monthly cashflow
- —
- DSCR
- —
- Eligible?
- —
Personal DTI + credit; lowest rate.
DSCR
20% down · 8.5% · 30yr
- Down + closing
- —
- Monthly P&I
- —
- Monthly cashflow
- —
- DSCR
- —
- Eligible?
- —
No personal income docs; deal must DSCR.
Hard money
10% down · 12.0% · 12mo
- Down + closing
- —
- Monthly P&I
- —
- Monthly cashflow
- —
- DSCR
- —
- Eligible?
- —
Short-term bridge; refi at stabilization.
Rent comps 5 comps
| Address | Beds | Baths | Sqft | Rent | $/sqft | DOM | Units | Dist |
|---|---|---|---|---|---|---|---|---|
| 215 Grant St Wall, PA | 2.0 | 2.5 | 960 | $750 | $0.78 | 43d | 1 | 0.98mi |
| 165 State St Wilmerding, PA | 3.0 | 1.0 | 1100 | $995 | $0.90 | 17d | 1 | 1.34mi |
| 649 Sixth St Trafford, PA | 3.0 | 2.5 | 1046 | $1,495 | $1.43 | 23d | 1 | 1.41mi |
| 569 Woodmont Ave Apt B East McKeesport, PA | 2.0 | 1.0 | 1000 | $1,200 | $1.20 | 17d | 1 | 1.42mi |
| 569 Woodmont Ave Unit C East McKeesport, PA | 2.0 | 1.0 | 1000 | $1,000 | $1.00 | 17d | 1 | 1.42mi |
Listing history 7 events
-
2026-04-23status Pending
-
2026-03-07$99,500 Active
-
2025-11-22historical $1,100
-
2025-09-26price $1,100
-
2025-09-09price $1,250
-
2025-08-26$1,400
-
1993-06-29soldstatus $26,000
ⓘ Source: listings_history table (triggers on properties + properties_extension) + one-shot
backfill from property_details.listing_events for pre-trigger history.
Tax reassessment forecast PA · Partial reset (capped growth)
- Current annual tax
- $904 · $75/mo
- Projected year-2 tax
- $1,238 · $103/mo
- Expected delta
- +$334/yr (+$28/mo · 37.0%)
ⓘ Screening estimate from a state-policy table — verify with the county assessor before closing.
Climate risk First Street
- Flood 1/10 Low FEMA zone X (unshaded) · 0% chance over 30 yrs
- Wildfire 1/10 Low
- Heat 4/10 Moderate 7 d/yr ≥96°F today · 19 d/yr by 30 yrs out
- Wind 2/10 Low 0% chance of damaging wind over 30 yrs
- Air quality 4/10 Moderate 5 unhealthy d/yr today · 7 by 30 yrs out
Nearby sold comps map
Loading sold comps map…
Walkable amenities ~0.75 mi
Loading nearby amenities…
Taxation est. · year 1
- Rental income
- $12,784
- − Mortgage interest
- −$5,574
- − Property taxes
- −$904
- − Insurance
- −$498
- − Repairs & maintenance
- −$1,023
- − Management
- −$1,023
- − Depreciation
- −$2,895
- Taxable income
- $869
- Est. tax owed @ 24.0%
- −$209
- After-tax cash flow
- $2,228/yr
For passive investors: Depreciation is non-cash, so a rental often shows a tax loss while cash-flowing — sheltering income. Rental losses are passive: they offset passive income freely, and up to $25,000/yr can offset ordinary (W-2) income if you actively participate and your MAGI is under $100k (phasing out to $0 by $150k); unused losses carry forward. On sale, claimed depreciation is recaptured at up to 25%, and gains may owe capital-gains tax (a 1031 exchange can defer both). Figures are a year-1 estimate at your 24.0% rate — not tax advice; consult a CPA.
Schools (NCES district)
- District
- East Allegheny SD
- NCES district ID
- 4208060
- Math proficiency
- 14% ▼ -13.00%
- Reading proficiency
- 30% ▼ -19.00%
- Median HH income
- $38,748
- Composite
- 18.44/100
- National rank
- #8930
- State rank
- #485 of 539 in PA
Livability — Wall
- Score
- 61/100
- State rank
- #1405
- US rank
- #17761
Category grades
Schools grade is shown separately in the Schools card above.
Census & demographics
- Census place
- Wall, PA
- City population
- 2,287
- Population (ZIP)
- 2,287
Population outlook (Allegheny County) Hauer SSP2
- Today (2025)
- 1,250,282 people
- By 2030
- 1,256,482 · +0.5%
- By 2040
- 1,256,318 · +0.5%
- By 2050
- 1,244,169 · -0.5%
- By 2075
- 1,197,693 · -4.2%
- By 2100
- 1,093,187 · -12.6%
Race, ethnicity, and origin ACS 2023
- Neighborhood character
- Predominantly White (71%)
- Race & ethnicity
- White 71% Black 25% Two or more races 3% Hispanic / Latino 2%
- Common ancestry
- Romanian 6% Slovak 2% Iranian 1%
- Foreign-born
- 1%
- Languages at home
- 97% English-only · Spanish 2%
Political lean MEDSL · Allegheny
- 2024 margin
- Strong D (+20.3) · D 59.7% · R 39.4%
- 2008→2024 swing
- +4.8pp toward D · 2008: 15.5pp · 2024: 20.3pp
- All cycles
- 2024: D+20.3 2020: D+20.4 2016: D+16.4 2012: D+14.4 2008: D+15.5
Not yet ingested
- Civics
- —
Market trends
- HPI YoY
- ▼ -2.60%
- Current HPI
- 138.7635
- Rent YoY
- —
- Metro
- —
- State GDP YoY
- ▲ 1.68%
- F500 in state
- 34
Industry mix (Fortune 500 HQ in PA)
| Industry | F500 HQs | Revenue |
|---|---|---|
| Healthcare | 2 | $309B |
|
||
| Insurance | 2 | $27B |
|
||
| Telecommunications / Media | 1 | $124B |
|
||
| Industrial Distribution | 1 | $22B |
|
||
| Financial Services | 1 | $20B |
|
||
| Chemicals / Materials | 1 | $18B |
|
||
Price history
+282.7% since first listed7 events — show timeline
- 2026-04-23 Pending — West Penn MLS
- 2026-03-07 Listed $99,500 West Penn MLS
- 2025-11-22 Rental Removed $1,100 BUILDIUM
- 2025-09-26 Price Changed $1,100 BUILDIUM
- 2025-09-09 Price Changed $1,250 BUILDIUM
- 2025-08-26 Listed for Rent $1,400 BUILDIUM
- 1993-06-29 Sold (Public Records) $26,000 Public Records
Property tax history
+0.9%/yrLatest (2026): $904 · +0.0% YoY. Source: county tax records.
Cash-flow waterfall
monthlySold comps — $/sqft
last 12 mo · ≤1 miLoading sold comps…