 Duplex
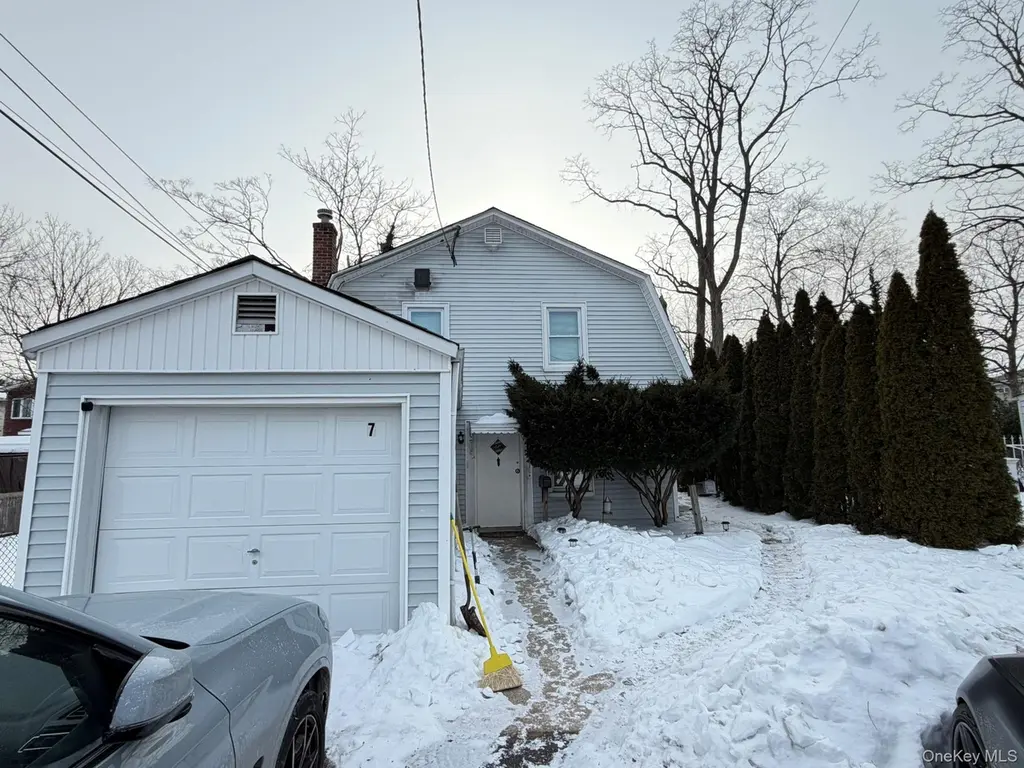
7 Sands Point Rd · Manorhaven, NY
Flood risk 1/10 · Minimal
- FEMA flood zone
- X (unshaded)
- Chance of flooding over 30 yrs
- 0.0%
- Est. flood insurance / yr
- $507 – $1,088
Fire risk 1/10 · Minimal
- Est. fire insurance / yr
- $691 – $1,283
Heat risk 6/10 · Moderate
- Hot days now (above 97°F)
- 7 days/yr
- Hot days in 30 yrs
- 16 days/yr
Wind risk 6/10 · Moderate
- Chance of severe wind over 30 yrs
- 27.0%
Air-quality risk 4/10 · Minor
- Unhealthy air days now
- 6 days/yr
- Unhealthy air days in 30 yrs
- 7 days/yr
Risk factors via First Street. Map © Google.
Why this score? — see what drove the C- grade
The composite is a weighted blend of 9 inputs, each scored 0–100. Each bar is that input's sub-score; the figure is the points it added to the 100-point composite (weight × sub-score).
- Cash flow +16.2/30.0
- ARV discount +9.4/15.0
- Schools +6.8/10.0
- DSCR +5.0/10.0
- Rent growth +5.0/5.0
- 1% rule +4.0/10.0
- Livability +3.7/5.0
- Condition / age +2.5/5.0
- Appreciation +0.0/10.0
$849,000
🖨 Deal sheet 📄 Offer letter ✓ Due diligence
Multi-family units
County records classify this as Multi-Family (2-4 Unit). Listing-text estimate: 2 units. confirmed
Listing remarks MLS
Welcome to this well maintained 2 family home in the heart of Port Washington! 40x100 lot size. the first floor features a living/dining room, kitchen, 1 bedroom, and 1 full bathroom. The second floor features a living/dining room, kitchen, 2 bedrooms, and 1 full bathroom. Generously sized backyard. 3 car driveway with 1 car garage. Close to a wide variety of shops, restaurants, parks, and schools. Close to the N23 bus. Don't miss this chance to own this charming home!
Key facts
- 4,000 sq ft lot
- Garage
- Built 1946
Neighborhood map
What this means for you Summary
Snapshot
- This is a 2 × 3-bed/2.0-bath units multifamily listed at $849k.
Deal economics
- At list price, monthly cash flow is $445 ($5k/yr) — positive. Per door: $222/mo.
- The deal already cash-flows at list — no discount required.
- To meet the 1% rule (rent ≥ 1% of price), the offer needs to be $760k (10.5% below list).
- Recommended offer: $760k (10.5% below list) — sets the bar for 1% rule.
Location & tenants
- Location reads 74/100 on livability (#279 in NY, #4,435 nationally) — a middle-class / working-renter tenant base. Strengths: crime A+, commute A+, employment A+; Watch: housing D+, amenities D-, cost of living F.
- Port Washington Union Free School District (suburban): math 75% / reading 72% proficiency, ranked #69 of 590 in NY (top 12%) — strong family-tenant draw, lease renewals of 3-5y typical; only 12% free/reduced lunch — higher-income household profile.
- Market conditions: Rents rising fast (+17.0%/yr); 152 active listings in the ZIP; high-income renter base; 824 units permitted in Nassau County in 2024 (153 in 5+ unit buildings).
- At $7,599/mo this rent would consume 59% of the median local household income ($154k/yr) (locally 857% of renters already pay >50% of income on rent) — very limited rent-growth headroom before tenants either downsize or default.
Forward outlook
- Local home prices are declining (-3.0%/yr); year-one equity from $6k of loan paydown is wiped out by about $25k of value loss. Plan a longer hold.
- Nassau County population projected at +7% by 2050 — modest demand growth; plan on rents tracking national, not racing it.
Negotiation context
- It's been on market 115 days — a 9% lower offer ($773k) is reasonable based on typical stale-listing flexibility.
- 7 sale attempts since 29y ago with the ask held roughly flat each time — persistent listings suggest the price (not the market) is what's stuck; bring a comps-based counter.
- Current owner paid $86k; list at $849k implies a 887% gain — meaningful room to come down on a strong offer.
Risks & watch-outs
- Watch-outs: built in 1946 — expect roof / HVAC / electrical / plumbing capex.
- Climate carrying-cost: major wind risk, 27% chance of damaging wind over 30y; extreme-heat days projected 7→16/yr by 2055 (HVAC capex compounding) — expect insurance premiums to compound above CPI over the hold.
Questions for the listing agent
- It's been on market 115 days. Have you received any prior offers? Is the seller open to a 10% concession, seller financing, or rate buy-down credit?
- Can we see the unit-by-unit rent roll, current vacancy, and any below-market leases? What's the average tenancy length?
- What capital expenditures (roof, boiler, parking lot, exteriors) have been made in the last 5 years, and what's planned in the next 2?
- Built in 1946 — when were the roof, HVAC, electrical panel, plumbing, and water heater last replaced?
- Why hasn't it sold? Are there any deal-killer items the seller is aware of (foundation, flood, title, zoning, code violations)?
- Is there a deadline driving the sale (1031 exchange, divorce, estate, relocation)? That informs how much negotiation room exists.
- Schools are B-rated — typically a magnet for longer-tenancy family renters. What's the average tenant stay here, and is there a school-zone premium baked into asking?
- What's the average days-on-market for RENTAL listings here right now (not sales)? A rising rental-DOM trend means longer vacancies and softer asking-rent achievability than the comps imply.
- What's the recent tenant-quality profile in this submarket — average credit score on applications, eviction rate, late-payment / NSF rate, and stable-employment percentage? A property-management company in the area should have these aggregated.
- How much new apartment / multifamily construction is in the pipeline within 1–3 miles? Heavy new supply (>2% of stock underway) typically softens rents 12–24 months out; light construction supports rent growth.
Investment metrics
- 1% rule
- 0.90% ✗
- Cap rate
- 6.92%
- Cash-on-cash
- 2.24%
- DSCR
- 1.10
- GRM
- 9.3
CMA / ARV
- ARV (median comp)
- $886,512
- List price
- $849,000
- Delta
- -4.23%
- Verdict
- FAIR
- Comps
- 4 within 1.0 mi
Projected returns pro-forma
-3.0% appreciation · 8.0% rent growth · sell at horizon
- IRR
- -7.5%
- Equity multiple
- 0.71×
- Total profit
- $-69,169
- Equity at exit
- $126,589
- IRR
- 7.3%
- Equity multiple
- 1.67×
- Total profit
- $158,713
- Equity at exit
- $73,406
Cash invested: $237,720 (down + closing). Projections, not guarantees.
Landlord ↔ Tenant lean methodology
- Overall (STATE)
- 15 Strongly Tenant-Friendly
- State New York
- 15 Strongly Tenant-Friendly · D+10
- County
- — inherits STATE
- City
- — inherits STATE
ZIP-level market 11050
- Rents YoY
- 17.0%
- Active inventory
- 152
- Price-to-rent
- 18.6×
Monthly cashflow live
- Estimated rent
- $7,599 medium interval (Pro) →
- Mortgage (P&I)
- −$4,452
- Tax from tax record
- −$753 /mo · $9,030/yr
- Insurance
- −$354
- HOA
- −$0
- Vacancy / Maint / Mgmt
- −$1,596
- Net cashflow
- $445
Break-even live
2-unit breakdown (identical units grouped — click to expand)
| Units | Beds | Baths | Est. rent |
|---|---|---|---|
| 2× units | 3 | 2 | $7,598 |
| #1 | 3 | 2 | $3,799 |
| #2 | 3 | 2 | $3,799 |
| Total (2 units) | $7,599 | ||
UW: 25.0% down · 7.5% · 30yr · 1.5% tax · 5.0% vac · 8.0% maint · 8.0% mgmt
Financing live
Cash to close
- Down payment
- $212,250
- Closing costs
- $25,470
- Reserves months
- —
- Total cash needed
- —
Loan-product check · same deal, 3 products live
Conventional
25% down · 7.5% · 30yr
- Down + closing
- —
- Monthly P&I
- —
- Monthly cashflow
- —
- DSCR
- —
- Eligible?
- —
Personal DTI + credit; lowest rate.
DSCR
20% down · 8.5% · 30yr
- Down + closing
- —
- Monthly P&I
- —
- Monthly cashflow
- —
- DSCR
- —
- Eligible?
- —
No personal income docs; deal must DSCR.
Hard money
10% down · 12.0% · 12mo
- Down + closing
- —
- Monthly P&I
- —
- Monthly cashflow
- —
- DSCR
- —
- Eligible?
- —
Short-term bridge; refi at stabilization.
Listing history 25 events
-
2026-06-18days on market $849,000 Active 115 DOM
-
2026-06-17days on market $849,000 Active 114 DOM
-
2026-06-16days on market $849,000 Active 113 DOM
-
2026-06-15days on market $849,000 Active 112 DOM
-
2026-06-13days on market $849,000 Active 110 DOM
-
2026-06-09days on market $849,000 Active 106 DOM
-
2026-06-08days on market $849,000 Active 105 DOM
-
2026-06-07days on market $849,000 Active 104 DOM
-
2026-06-04days on market $849,000 Active 101 DOM
-
2026-06-03days on market $849,000 Active 100 DOM
-
2026-06-02days on market $849,000 Active 99 DOM
-
2026-06-01days on market $849,000 Active 98 DOM
-
2026-05-31days on market $849,000 Active 97 DOM
-
2026-03-31status Active 473-char remark
Show marketing remark (473 chars)
Welcome to this well maintained 2 family home in the heart of Port Washington! 40x100 lot size. the first floor features a living/dining room, kitchen, 1 bedroom, and 1 full bathroom. The second floor features a living/dining room, kitchen, 2 bedrooms, and 1 full bathroom. Generously sized backyard. 3 car driveway with 1 car garage. Close to a wide variety of shops, restaurants, parks, and schools. Close to the N23 bus. Don't miss this chance to own this charming home!
-
2026-02-06$849,000 Active 473-char remark
Show marketing remark (473 chars)
Welcome to this well maintained 2 family home in the heart of Port Washington! 40x100 lot size. the first floor features a living/dining room, kitchen, 1 bedroom, and 1 full bathroom. The second floor features a living/dining room, kitchen, 2 bedrooms, and 1 full bathroom. Generously sized backyard. 3 car driveway with 1 car garage. Close to a wide variety of shops, restaurants, parks, and schools. Close to the N23 bus. Don't miss this chance to own this charming home!
-
2023-07-01historical
-
2023-07-01status Active
-
2023-04-27$688,000 Active
-
2020-05-01historical
-
2019-05-01$599,000 New
-
2016-09-02historical
-
2016-03-02$549,000
-
1998-09-11soldstatus $86,000
-
1998-07-10historical
-
1997-08-11$86,000
ⓘ Source: listings_history table (triggers on properties + properties_extension) + one-shot
backfill from property_details.listing_events for pre-trigger history.
Tax reassessment forecast NY · Partial reset (capped growth)
- Current annual tax
- $9,030 · $753/mo
- Projected year-2 tax
- $11,689 · $974/mo
- Expected delta
- +$2,659/yr (+$222/mo · 29.4%)
ⓘ Screening estimate from a state-policy table — verify with the county assessor before closing.
Climate risk First Street
- Flood 1/10 Low FEMA zone X (unshaded) · 0% chance over 30 yrs
- Wildfire 1/10 Low
- Heat 6/10 Major 7 d/yr ≥97°F today · 16 d/yr by 30 yrs out
- Wind 6/10 Major 27% chance of damaging wind over 30 yrs
- Air quality 4/10 Moderate 6 unhealthy d/yr today · 7 by 30 yrs out
Nearby sold comps map
Loading sold comps map…
Walkable amenities ~0.75 mi
Loading nearby amenities…
Taxation est. · year 1
- Rental income
- $91,188
- − Mortgage interest
- −$47,557
- − Property taxes
- −$9,030
- − Insurance
- −$4,245
- − Repairs & maintenance
- −$7,295
- − Management
- −$7,295
- − Depreciation
- −$24,698
- Taxable loss
- −$8,933
- Est. tax savings @ 24.0%
- +$2,144
- After-tax cash flow
- $7,480/yr
For passive investors: Depreciation is non-cash, so a rental often shows a tax loss while cash-flowing — sheltering income. Rental losses are passive: they offset passive income freely, and up to $25,000/yr can offset ordinary (W-2) income if you actively participate and your MAGI is under $100k (phasing out to $0 by $150k); unused losses carry forward. On sale, claimed depreciation is recaptured at up to 25%, and gains may owe capital-gains tax (a 1031 exchange can defer both). Figures are a year-1 estimate at your 24.0% rate — not tax advice; consult a CPA.
Schools (NCES district)
- District
- Port Washington Union Free School District
- NCES district ID
- 3623580
- Math proficiency
- 75% ▼ -2.00%
- Reading proficiency
- 72% ▲ 3.00%
- Median HH income
- $108,016
- Composite
- 67.83/100
- National rank
- #362
- State rank
- #69 of 590 in NY
Livability — Manorhaven
- Score
- 74/100
- State rank
- #279
- US rank
- #4435
Category grades
Schools grade is shown separately in the Schools card above.
Census & demographics
- Census place
- Manorhaven, NY
- County
- Nassau County · 653,051 people
- Metro
- New York-Newark-Jersey City, NY-NJ-PA
- Population (ZIP)
- 32,794
- Household income
- $154,225
- Rent vs Own
- Severe rent burden
- 857.0
Population outlook (Nassau County) Hauer SSP2
- Today (2025)
- 1,409,302 people
- By 2030
- 1,431,482 · +1.6%
- By 2040
- 1,471,607 · +4.4%
- By 2050
- 1,502,845 · +6.6%
- By 2075
- 1,575,403 · +11.8%
- By 2100
- 1,554,356 · +10.3%
Race, ethnicity, and origin ACS 2023
- Neighborhood character
- Predominantly White (67%)
- Race & ethnicity
- White 67% Hispanic / Latino 18% Two or more races 10% Asian 10% Black 2%
- Hispanic origin (detail)
- Mexican 3%
- Common ancestry
- Scotch-Irish 5% Romanian 4% Italian 3%
- Foreign-born
- 18% · Canada, China, South Korea
- Languages at home
- 75% English-only · Spanish 14% Other Indo-European 3% Chinese 3%
Political lean MEDSL · Nassau
- 2024 margin
- Toss-up / Even · D 47.9% · R 52.1%
- 2008→2024 swing
- -12.6pp toward R · 2008: 8.4pp · 2024: -4.2pp
- All cycles
- 2024: R+4.2 2020: D+9.5 2016: D+5.3 2012: D+6.7 2008: D+8.4
Not yet ingested
- Civics
- —
Market trends
- HPI YoY
- ▼ -893.18%
- Current HPI
- 260.9293
- Rent YoY
- ▲ 17.00%
- Metro
- New York-Newark-Jersey City, NY-NJ-PA
- State GDP YoY
- ▲ 2.60%
- F500 in state
- 92
Industry mix (Fortune 500 HQ in NY)
| Industry | F500 HQs | Revenue |
|---|---|---|
| Financial Services | 10 | $950B |
|
||
| Consumer Goods | 9 | $162B |
|
||
| Insurance | 4 | $225B |
|
||
| Telecommunications | 2 | $144B |
|
||
| Pharmaceuticals | 2 | $112B |
|
||
| Media / Entertainment | 2 | $69B |
|
||
Price history
+887.2% since first listed12 events — show timeline
- 2026-03-31 Relisted — OneKey® MLS as Distributed by MLS Grid
- 2026-02-06 Listed $849,000 OneKey® MLS as Distributed by MLS Grid
- 2023-07-01 Listing Removed — OneKey® MLS as Distributed by MLS Grid
- 2023-07-01 Relisted — OneKey® MLS as Distributed by MLS Grid
- 2023-04-27 Listed $688,000 OneKey® MLS as Distributed by MLS Grid
- 2020-05-01 Listing Removed — OneKey® MLS as Distributed by MLS Grid
- 2019-05-01 Listed $599,000 OneKey® MLS as Distributed by MLS Grid
- 2016-09-02 Listing Removed — OneKey® MLS as Distributed by MLS Grid
- 2016-03-02 Listed $549,000 OneKey® MLS as Distributed by MLS Grid
- 1998-09-11 Sold (MLS) $86,000 BRIGHT MLS
- 1998-07-10 Listing Removed — BRIGHT MLS
- 1997-08-11 Listed $86,000 BRIGHT MLS
Property tax history
+2.1%/yrLatest (2024): $9,030 · -12.8% YoY. Source: county tax records.
Cash-flow waterfall
monthlySold comps — $/sqft
last 12 mo · ≤1 miLoading sold comps…