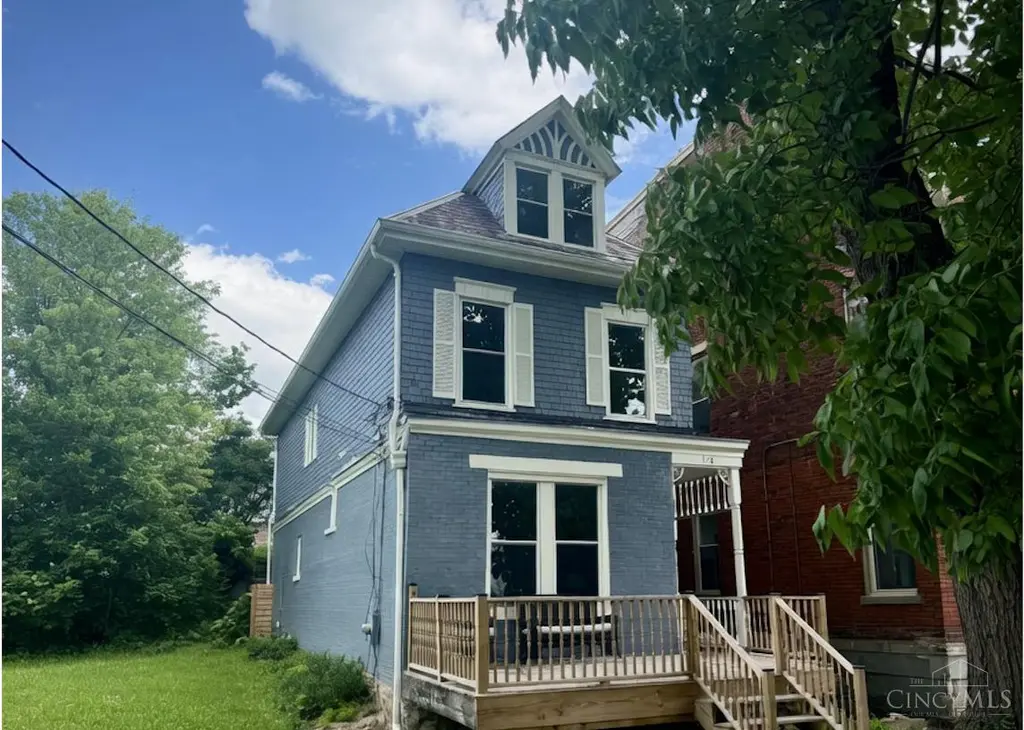
136 Dorchester Ave · Cincinnati, OH
Flood risk 1/10 · Minimal
- FEMA flood zone
- X (unshaded)
- Chance of flooding over 30 yrs
- 0.0%
- Est. flood insurance / yr
- $473 – $860
Fire risk 1/10 · Minimal
- Est. fire insurance / yr
- $713 – $1,323
Heat risk 4/10 · Minor
- Hot days now (above 103°F)
- 7 days/yr
- Hot days in 30 yrs
- 19 days/yr
Wind risk 2/10 · Minimal
- Chance of severe wind over 30 yrs
- 1.0%
Air-quality risk 3/10 · Minor
- Unhealthy air days now
- 2 days/yr
- Unhealthy air days in 30 yrs
- 3 days/yr
Risk factors via First Street. Map © Google.
Why this score? — see what drove the C grade
The composite is a weighted blend of 9 inputs, each scored 0–100. Each bar is that input's sub-score; the figure is the points it added to the 100-point composite (weight × sub-score).
- Cash flow +19.7/30.0
- ARV discount +15.0/15.0
- DSCR +6.2/10.0
- 1% rule +5.6/10.0
- Livability +4.0/5.0
- Rent growth +3.0/5.0
- Schools +2.5/10.0
- Condition / age +2.5/5.0
- Appreciation +0.0/10.0
$399,900
🖨 Deal sheet 📄 Offer letter ✓ Due diligence
Listing remarks MLS
Welcome to this fully renovated home near downtown & UC. Brand new kitchen w/modern appliances, oversized granite peninsula and high end appliances. Original pocket door, staircase and fireplace create a cozy living room. 100% remodeled 3 full baths, new furnace, refinished original pine floors on main level, & new carpet upstairs. Move-in ready with a blend of charm & style. Close to hospitals, parks, dining & entertainment. Perfect for owner-occupant or investment
Key facts
- Ambient fire pit
- Front porch
- Skyline vistas
Tags
Property features AI
Finance
- HOA & community: No HOA
Exterior
- Parking: On-street parking
- Utilities: Public water; Private sewer; Natural gas
- Home design: Colonial-style single family home; Three or more levels; Stone foundation
- Construction: Slate roof; Shingle siding and brick exterior
- Exterior features: Vinyl windows; Residential zoning
Interior
- Kitchen: Kitchen with marble/granite/slate countertops; Kitchen dimensions approximately 15 x 12
- Bedrooms: 3 bedrooms total; Primary bedroom 18 x 14 (Level 2); Second bedroom 16 x 14 (Level 2); Third bedroom 18 x 14 (Level 3)
- Bathrooms: Three full bathrooms; One half bathroom (on Level 1)
- Heating & cooling: Gas heating; Central air conditioning; Gas water heating
- Interior features: Fireplace in living room; Full basement; 11 total rooms
- Laundry & utility: Main-level laundry room (6 x 5)
Neighborhood map
What this means for you Summary
Snapshot
- This is a 3-bed/3.5-bath single-family listed at $400k.
Deal economics
- At list price, monthly cash flow is $471 ($6k/yr) — positive.
- The deal already cash-flows at list — no discount required.
- Meets the 1% rule at list price ($4k rent vs $400k).
- Recommended offer: $388k (3.0% below list) — sets the bar for market timing.
- Cap rate 7.7% vs local median 3.9% in Cincinnati — top-decile yield for the area; either an underpriced asset or a hidden risk that comps aren't pricing in. Stress-test before assuming the spread holds.
Location & tenants
- Location reads 80/100 on livability (#130 in OH, #1,856 nationally) — a professional / high-income tenant draw. Strengths: amenities A+, commute A+, cost of living A+; Watch: employment D, crime F.
- Cincinnati Public Schools (urban): math 25% / reading 36% proficiency, ranked #581 of 656 in OH (top 89%) — families likely to look elsewhere, expect single-tenant / working-renter base with shorter leases; 70% free/reduced lunch — lower-income household profile, screen leases tightly.
- Market conditions: Rents rising (+2.1%/yr); 71 active listings in the ZIP; 40 comparable units currently listed for rent nearby; rentals at typical pace (median 15d on market — plan ~3-4 weeks tenant-placement turnaround); lower-income renter base — watch delinquency; 801 units permitted in Hamilton County in 2024 (190 in 5+ unit buildings).
- At $4,241/mo this rent would consume 143% of the median local household income ($36k/yr) (locally 2461% of renters already pay >50% of income on rent) — very limited rent-growth headroom before tenants either downsize or default.
Forward outlook
- Local home prices are declining (-3.0%/yr); year-one equity from $3k of loan paydown is wiped out by about $12k of value loss. Plan a longer hold.
Negotiation context
- It's been on market 55 days — a 3% lower offer ($388k) is reasonable based on typical stale-listing flexibility.
- 9 sale attempts since 26y ago; this cycle's ask has dropped $25k (6%) from the opening price — seller is motivated, your offer sets the floor, not the list.
- Current owner paid $212k; list at $400k implies a 88% gain — meaningful room to come down on a strong offer.
Risks & watch-outs
- Watch-outs: built in 1902 — expect roof / HVAC / electrical / plumbing capex.
Questions for the listing agent
- It's been on market 55 days. Have you received any prior offers? Is the seller open to a 3% concession, seller financing, or rate buy-down credit?
- Built in 1902 — when were the roof, HVAC, electrical panel, plumbing, and water heater last replaced?
- Is there a deadline driving the sale (1031 exchange, divorce, estate, relocation)? That informs how much negotiation room exists.
- Schools are B-rated — typically a magnet for longer-tenancy family renters. What's the average tenant stay here, and is there a school-zone premium baked into asking?
- Crime grade is F in this area — have there been break-ins, vandalism, or insurance claims at this property in the last 3 years? What carrier currently insures it and at what premium?
- What's the average days-on-market for RENTAL listings here right now (not sales)? A rising rental-DOM trend means longer vacancies and softer asking-rent achievability than the comps imply.
- What's the recent tenant-quality profile in this submarket — average credit score on applications, eviction rate, late-payment / NSF rate, and stable-employment percentage? A property-management company in the area should have these aggregated.
- How much new for-sale + rental construction is in the pipeline within 1–3 miles? Heavy new supply typically softens prices + rents 12–24 months out; constrained supply supports both.
Investment metrics
- 1% rule
- 1.06% ✓
- Cap rate
- 7.70%
- Cash-on-cash
- 5.04%
- DSCR
- 1.22
- GRM
- 7.9
CMA / ARV
- ARV (on-the-fly)
- $727,120
- Comps found
- 12
Show comp detail 12 sales within ~0.75 mi
| Address | Dist | Beds/Ba | Sqft | Sold | Price | $/sf | Match |
|---|---|---|---|---|---|---|---|
| 1797 Sycamore St | 0.07mi | 3/2.5 | 2,320 (-5%) | 0mo | $560,000 | $241 | 84 |
| 1325 Republic St Unit C | 0.64mi | 3/3.0 | 2,436 (-0%) | 1mo | $850,000 | $349 | 67 |
| 2312 Highland Ave | 0.54mi | 4/3.0 (+1) | 2,434 (-0%) | 3mo | $390,000 | $160 | 65 |
| 541 Ringgold St | 0.38mi | 3/3.5 | 2,239 (-8%) | 5mo | $575,000 | $257 | 64 |
| 1707 Highland Ave | 0.46mi | 3/2.0 | 2,368 (-3%) | 4mo | $235,025 | $99 | 64 |
| 446 Boal St | 0.37mi | 3/3.0 | 2,204 (-10%) | 6mo | $695,000 | $315 | 60 |
| 2238 Maplewood Ave | 0.44mi | 4/2.5 (+1) | 2,536 (+4%) | 10mo | $475,000 | $187 | 56 |
| 423 Milton St | 0.37mi | 2/2.0 (-1) | 2,164 (-11%) | 0mo | $721,550 | $333 | 53 |
| 432 Milton St | 0.37mi | 4/4.0 (+1) | 2,664 (+9%) | 11mo | $795,000 | $298 | 52 |
| 1330 Broadway St | 0.49mi | 3/3.0 | 2,160 (-12%) | 7mo | $915,000 | $424 | 50 |
| 221 Kemp Aly | 0.64mi | 3/3.0 | 2,719 (+11%) | 1mo | $795,000 | $292 | 48 |
| 1311 Spring St | 0.54mi | 4/3.5 (+1) | 2,760 (+13%) | 11mo | $875,000 | $317 | 39 |
Match score weights: distance 35% · size 25% · config 20% · recency 20%. Top-matched comps best support the ARV.
Projected returns pro-forma
-3.0% appreciation · 2.07% rent growth · sell at horizon
- IRR
- -9.5%
- Equity multiple
- 0.66×
- Total profit
- $-38,629
- Equity at exit
- $59,626
- IRR
- -1.4%
- Equity multiple
- 0.91×
- Total profit
- $-10,333
- Equity at exit
- $34,576
Cash invested: $111,972 (down + closing). Projections, not guarantees.
Landlord ↔ Tenant lean methodology
- Overall (STATE)
- 73 Landlord-Friendly
- State Ohio
- 73 Landlord-Friendly · R+6
- County
- — inherits STATE
- City
- — inherits STATE
ZIP-level market 45219
- Home prices YoY
- -28.3%
- Rents YoY
- 2.1%
- Active inventory
- 71
- Price-to-rent
- 7.9×
Monthly cashflow live
- Estimated rent
- $4,241 high interval (Pro) →
- Mortgage (P&I)
- −$2,097
- Tax from tax record
- −$616 /mo · $7,394/yr
- Insurance
- −$167
- HOA
- −$0
- Vacancy / Maint / Mgmt
- −$891
- Net cashflow
- $471
Break-even live
UW: 25.0% down · 7.5% · 30yr · 1.5% tax · 5.0% vac · 8.0% maint · 8.0% mgmt
Financing live
Cash to close
- Down payment
- $99,975
- Closing costs
- $11,997
- Reserves months
- —
- Total cash needed
- —
Loan-product check · same deal, 3 products live
Conventional
25% down · 7.5% · 30yr
- Down + closing
- —
- Monthly P&I
- —
- Monthly cashflow
- —
- DSCR
- —
- Eligible?
- —
Personal DTI + credit; lowest rate.
DSCR
20% down · 8.5% · 30yr
- Down + closing
- —
- Monthly P&I
- —
- Monthly cashflow
- —
- DSCR
- —
- Eligible?
- —
No personal income docs; deal must DSCR.
Hard money
10% down · 12.0% · 12mo
- Down + closing
- —
- Monthly P&I
- —
- Monthly cashflow
- —
- DSCR
- —
- Eligible?
- —
Short-term bridge; refi at stabilization.
Rent comps 40 comps
| Address | Beds | Baths | Sqft | Rent | $/sqft | DOM | Units | Dist |
|---|---|---|---|---|---|---|---|---|
| 328 Mulberry St Cincinnati, OH | 3.0 | 3.5 | 2640 | $5,500 | $2.08 | 14d | 1 | 0.19mi |
| 328 Mulberry St Cincinnati, OH | 3.0 | 3.5 | 2640 | $5,500 | $2.08 | 23d | 1 | 0.19mi |
| 55 Mulberry St Cincinnati, OH | 3.0 | 3.0 | 2500 | $3,500 | $1.40 | 23d | 1 | 0.26mi |
| 216 Gilman Ave Unit 1363975P Cincinnati, OH | 3.0 | 1.0 | 1776 | $3,474 | $1.96 | 3d | 1 | 0.33mi |
| 1610 Sycamore St Cincinnati, OH | 2.0 | 2.0 | 1600 | $1,900 | $1.19 | 10d | 1 | 0.34mi |
| 236 Gilman Ave Cincinnati, OH | 3.0 | 2.5 | 1699 | $2,200 | $1.29 | 12d | 1 | 0.36mi |
| 1826 Republic St Unit 1056093P Cincinnati, OH | 2.0 | 1.0 | 1614 | $2,812 | $1.74 | 14d | 1 | 0.36mi |
| 2271 Vine St Cincinnati, OH | 4.0 | 2.0 | 2268 | $1,525 | $0.67 | 4d | 1 | 0.40mi |
| 1354 Broadway Unit 1056136P Cincinnati, OH | 4.0 | 3.0 | 2529 | $7,307 | $2.89 | 3d | 1 | 0.41mi |
| 107 E Clifton Ave Unit 1234537P Cincinnati, OH | 2.0–3.0 | 1.0–2.0 | 2260 | $6,619 | $2.93 | 14d | 2 | 0.41mi |
| 2105 Burnet Ave Unit 1056017P Cincinnati, OH | 4.0 | 2.0 | 2960 | $7,384 | $2.49 | 1d | 1 | 0.44mi |
| 21 E 15th St Unit 1512946P Cincinnati, OH | 3.0 | 2.0 | 2852 | $12,830 | $4.50 | 23d | 1 | 0.46mi |
| 111 W Elder St Unit 1056044P Cincinnati, OH | 1.0–4.0 | 1.0–4.0 | 1835 | $5,561 | $3.03 | 10d | 2 | 0.46mi |
| 1537 Republic St Unit 1058850P Cincinnati, OH | 4.0 | 3.0 | 2421 | $10,677 | $4.41 | 21d | 1 | 0.49mi |
| 1610 Pleasant St Unit 1056041P Cincinnati, OH | 3.0–4.0 | 2.0–3.0 | 2960 | $4,370 | $1.48 | 10d | 2 | 0.51mi |
| 1304 Broadway Unit 1056130P Cincinnati, OH | 1.0–5.0 | 1.0–4.0 | 2072 | $5,808 | $2.80 | 10d | 2 | 0.53mi |
| 120 E 13th St Unit 1056091P Cincinnati, OH | 4.0 | 2.0 | 3229 | $10,667 | $3.30 | 21d | 1 | 0.55mi |
| 516 E 12th St Unit 1314562P Cincinnati, OH | 4.0 | 2.0 | 2023 | $10,170 | $5.03 | 23d | 1 | 0.60mi |
| 1424 Pleasant St Unit 1056038P Cincinnati, OH | 4.0 | 3.0 | 2960 | $7,167 | $2.42 | 14d | 1 | 0.60mi |
| 1287 Ida St Cincinnati, OH | 3.0 | 2.5 | 2494 | $4,700 | $1.88 | 17d | 1 | 0.78mi |
| 2332 Chickasaw St Unit 1 Cincinnati, OH | 3.0 | 1.0 | 2000 | $1,800 | $0.90 | 23d | 1 | 0.81mi |
| 2386 Wheeler St Cincinnati, OH | 4.0 | 1.0 | 1740 | $2,700 | $1.55 | 23d | 1 | 0.82mi |
| 2388 Wheeler St Cincinnati, OH | 4.0 | 2.0 | 1740 | $2,700 | $1.55 | 23d | 1 | 0.82mi |
| 472 Dayton St Cincinnati, OH | 2.0 | 1.5 | 2519 | $1,500 | $0.60 | 4d | 1 | 0.83mi |
| 2235 Victor St Cincinnati, OH | 4.0 | 2.0 | 2043 | $2,250 | $1.10 | 23d | 1 | 0.83mi |
| 2231 Flora St Cincinnati, OH | 4.0 | 2.0 | 1728 | $1,500 | $0.87 | 23d | 1 | 0.86mi |
| 923 Paradrome St Cincinnati, OH | 3.0 | 2.5 | 2098 | $3,000 | $1.43 | 23d | 1 | 0.87mi |
| 2800 Jefferson Ave Cincinnati, OH | 4.0 | 2.0 | 2500 | $625 | $0.25 | 19d | 1 | 0.96mi |
| 634 Sycamore St Cincinnati, OH | 2.0 | 1.0–1.5 | 1261 | $2,615 | $2.07 | 4d | 9 | 0.96mi |
| 345 E 7th St Cincinnati, OH | 2.0 | 1.0–2.0 | 1184 | $4,300 | $3.63 | 3d | 18 | 0.97mi |
| 19 Garfield Pl Cincinnati, OH | 1.0–2.0 | 1.0–2.0 | 1680 | $2,260 | $1.34 | 1d | 11 | 0.97mi |
| 2813 Gerard St Unit 1540075P Cincinnati, OH | 4.0 | 3.0 | 2152 | $6,281 | $2.92 | 20d | 1 | 1.00mi |
| 2517 May St Cincinnati, OH | 3.0 | 3.5 | 2014 | $3,420 | $1.70 | 21d | 1 | 1.03mi |
| 651 William Howard Taft Rd Cincinnati, OH | 2.0 | 2.5 | 1637 | $3,070 | $1.88 | 23d | 1 | 1.05mi |
| 2601 May St Cincinnati, OH | 2.0–3.0 | 2.5–3.5 | 1737 | $3,325 | $1.91 | 1d | 12 | 1.07mi |
| 580 Walnut St Cincinnati, OH | 2.0 | 1.0–2.5 | 1101 | $4,822 | $4.38 | 1d | 19 | 1.07mi |
| 2611 May St Cincinnati, OH | 2.0 | 2.5 | 1637 | $3,070 | $1.88 | 14d | 1 | 1.10mi |
| 918 Windsor St Cincinnati, OH | 3.0 | 1.0 | 2583 | $1,675 | $0.65 | 23d | 1 | 1.10mi |
| 987 Hill St Cincinnati, OH | 3.0 | 3.0 | 2878 | $7,000 | $2.43 | 1d | 1 | 1.15mi |
| 923 Rogers Pl Cincinnati, OH | 3.0 | 1.0 | 2061 | $1,600 | $0.78 | 23d | 1 | 1.18mi |
Listing history 40 events
-
2026-06-18days on market $399,900 Active 55 DOM
-
2026-06-17days on market $399,900 Active 54 DOM
-
2026-06-16days on market $399,900 Active 53 DOM
-
2026-06-15days on market $399,900 Active 52 DOM
-
2026-06-13days on market $399,900 Active 50 DOM
-
2026-06-13pricedays on market $399,900 Active 49 DOM
-
2026-06-09days on market $425,000 Active 46 DOM
-
2026-06-08days on market $425,000 Active 45 DOM
-
2026-06-07days on market $425,000 Active 44 DOM
-
2026-06-03days on market $425,000 Active 40 DOM
-
2026-06-02days on market $425,000 Active 39 DOM
-
2026-06-01days on market $425,000 Active 38 DOM
-
2026-05-31days on market $425,000 Active 37 DOM
-
2026-04-24$425,000 Active
-
2026-03-24historical 486-char remark
Show marketing remark (486 chars)
Welcome to this fully renovated home near downtown & UC. Brand new kitchen w/modern appliances, oversized granite peninsula and high end appliances. Original pocket door, staircase and fireplace create a cozy living room. 100% remodeled 3 full baths, new furnace, refinished original pine floors on main level, & new carpet upstairs. Move-in ready with a blend of charm & style. Close to hospitals, parks, dining & entertainment. Perfect for owner-occupant or investment
-
2026-03-06price $419,900 486-char remark
Show marketing remark (486 chars)
Welcome to this fully renovated home near downtown & UC. Brand new kitchen w/modern appliances, oversized granite peninsula and high end appliances. Original pocket door, staircase and fireplace create a cozy living room. 100% remodeled 3 full baths, new furnace, refinished original pine floors on main level, & new carpet upstairs. Move-in ready with a blend of charm & style. Close to hospitals, parks, dining & entertainment. Perfect for owner-occupant or investment
-
2026-01-07price $439,900 486-char remark
Show marketing remark (486 chars)
Welcome to this fully renovated home near downtown & UC. Brand new kitchen w/modern appliances, oversized granite peninsula and high end appliances. Original pocket door, staircase and fireplace create a cozy living room. 100% remodeled 3 full baths, new furnace, refinished original pine floors on main level, & new carpet upstairs. Move-in ready with a blend of charm & style. Close to hospitals, parks, dining & entertainment. Perfect for owner-occupant or investment
-
2025-10-10price $449,900 486-char remark
Show marketing remark (486 chars)
Welcome to this fully renovated home near downtown & UC. Brand new kitchen w/modern appliances, oversized granite peninsula and high end appliances. Original pocket door, staircase and fireplace create a cozy living room. 100% remodeled 3 full baths, new furnace, refinished original pine floors on main level, & new carpet upstairs. Move-in ready with a blend of charm & style. Close to hospitals, parks, dining & entertainment. Perfect for owner-occupant or investment
-
2025-09-08price $459,900 486-char remark
Show marketing remark (486 chars)
Welcome to this fully renovated home near downtown & UC. Brand new kitchen w/modern appliances, oversized granite peninsula and high end appliances. Original pocket door, staircase and fireplace create a cozy living room. 100% remodeled 3 full baths, new furnace, refinished original pine floors on main level, & new carpet upstairs. Move-in ready with a blend of charm & style. Close to hospitals, parks, dining & entertainment. Perfect for owner-occupant or investment
-
2025-08-08$469,900 Active 486-char remark
Show marketing remark (486 chars)
Welcome to this fully renovated home near downtown & UC. Brand new kitchen w/modern appliances, oversized granite peninsula and high end appliances. Original pocket door, staircase and fireplace create a cozy living room. 100% remodeled 3 full baths, new furnace, refinished original pine floors on main level, & new carpet upstairs. Move-in ready with a blend of charm & style. Close to hospitals, parks, dining & entertainment. Perfect for owner-occupant or investment
-
2017-05-25historical
-
2017-05-01status Active
-
2017-04-27price $245,000
-
2017-04-14historical Accept Backup Offers
-
2017-04-07price $255,000
-
2017-03-07$265,000 Active
-
2016-04-13soldstatus $212,500
-
2016-04-08soldstatus $212,500 Sold
-
2016-03-01historical Accept Backup Offers
-
2015-12-18$224,900 Active
-
2015-12-14historical
-
2015-10-10price $229,900
-
2015-09-21$249,900 Active
-
2002-06-21soldstatus $167,600
-
2002-06-14soldstatus $167,600
-
2001-10-24$169,900
-
2001-08-27historical
-
2001-06-06$169,900
-
2001-04-13historical
-
2000-10-12$189,900
ⓘ Source: listings_history table (triggers on properties + properties_extension) + one-shot
backfill from property_details.listing_events for pre-trigger history.
Tax reassessment forecast OH · Partial reset (capped growth)
- Current annual tax
- $7,394 · $616/mo
- Projected year-2 tax
- $7,394 · $616/mo
- Expected delta
- $0/yr ($0/mo · 0.0%)
ⓘ Screening estimate from a state-policy table — verify with the county assessor before closing.
Climate risk First Street
- Flood 1/10 Low FEMA zone X (unshaded) · 0% chance over 30 yrs
- Wildfire 1/10 Low
- Heat 4/10 Moderate 7 d/yr ≥103°F today · 19 d/yr by 30 yrs out
- Wind 2/10 Low 100% chance of damaging wind over 30 yrs
- Air quality 3/10 Moderate 2 unhealthy d/yr today · 3 by 30 yrs out
Nearby sold comps map
Loading sold comps map…
Walkable amenities ~0.75 mi
Loading nearby amenities…
Taxation est. · year 1
- Rental income
- $50,893
- − Mortgage interest
- −$22,401
- − Property taxes
- −$7,394
- − Insurance
- −$2,000
- − Repairs & maintenance
- −$4,071
- − Management
- −$4,071
- − Depreciation
- −$11,633
- Taxable loss
- −$678
- Est. tax savings @ 24.0%
- +$163
- After-tax cash flow
- $5,809/yr
For passive investors: Depreciation is non-cash, so a rental often shows a tax loss while cash-flowing — sheltering income. Rental losses are passive: they offset passive income freely, and up to $25,000/yr can offset ordinary (W-2) income if you actively participate and your MAGI is under $100k (phasing out to $0 by $150k); unused losses carry forward. On sale, claimed depreciation is recaptured at up to 25%, and gains may owe capital-gains tax (a 1031 exchange can defer both). Figures are a year-1 estimate at your 24.0% rate — not tax advice; consult a CPA.
Schools (NCES district)
- District
- Cincinnati Public Schools
- NCES district ID
- 3904375
- Math proficiency
- 25% ▼ -19.00%
- Reading proficiency
- 36% ▼ -14.00%
- Median HH income
- $35,743
- Composite
- 25.21/100
- National rank
- #7508
- State rank
- #581 of 656 in OH
Livability — Cincinnati
- Score
- 80/100
- State rank
- #130
- US rank
- #1856
Category grades
Schools grade is shown separately in the Schools card above.
Census & demographics
- Census place
- Cincinnati, OH
- County
- Hamilton County · 701,295 people
- City population
- 505,555
- Metro
- Cincinnati, OH-KY-IN
- Population (ZIP)
- 20,012
- Household income
- $35,657
- Rent vs Own
- Severe rent burden
- 2461.0
Population outlook (Hamilton County) Hauer SSP2
- Today (2025)
- 826,054 people
- By 2030
- 830,947 · +0.6%
- By 2040
- 832,319 · +0.8%
- By 2050
- 822,428 · -0.4%
- By 2075
- 788,688 · -4.5%
- By 2100
- 710,674 · -14.0%
Race, ethnicity, and origin ACS 2023
- Neighborhood character
- Predominantly White (67%)
- Race & ethnicity
- White 67% Black 16% Asian 7% Two or more races 6% Hispanic / Latino 4%
- Common ancestry
- Romanian 3% Italian 2% Slovak 1%
- Foreign-born
- 10% · China, Canada
- Languages at home
- 88% English-only · Chinese 3% Spanish 2% Other Indo-European 2%
Political lean MEDSL · Hamilton
- 2024 margin
- D (+14.9) · D 57.0% · R 42.1%
- 2008→2024 swing
- +7.9pp toward D · 2008: 7.0pp · 2024: 14.9pp
- All cycles
- 2024: D+14.9 2020: D+15.9 2016: D+9.5 2012: D+4.9 2008: D+7.0
Not yet ingested
- Civics
- —
Market trends
- HPI YoY
- ▼ -134.46%
- Current HPI
- 340.1262
- Rent YoY
- ▲ 2.07%
- Metro
- Cincinnati, OH-KY-IN
- State GDP YoY
- ▲ 1.98%
- F500 in state
- 48
Industry mix (Fortune 500 HQ in OH)
| Industry | F500 HQs | Revenue |
|---|---|---|
| Insurance | 3 | $145B |
|
||
| Industrial Machinery | 3 | $49B |
|
||
| Financial Services | 3 | $24B |
|
||
| Consumer Goods | 2 | $93B |
|
||
| Aerospace / Defense | 2 | $47B |
|
||
| Utilities | 2 | $33B |
|
||
Price history
+123.8% since first listed27 events — show timeline
- 2026-04-24 Listed $425,000 Cincy MLS
- 2026-03-24 Listing Removed — Cincy MLS
- 2026-03-06 Price Changed $419,900 Cincy MLS
- 2026-01-07 Price Changed $439,900 Cincy MLS
- 2025-10-10 Price Changed $449,900 Cincy MLS
- 2025-09-08 Price Changed $459,900 Cincy MLS
- 2025-08-08 Listed $469,900 Cincy MLS
- 2017-05-25 Listing Removed — Cincy MLS
- 2017-05-01 Relisted — Cincy MLS
- 2017-04-27 Price Changed $245,000 Cincy MLS
- 2017-04-14 Contingent — Cincy MLS
- 2017-04-07 Price Changed $255,000 Cincy MLS
- 2017-03-07 Listed $265,000 Cincy MLS
- 2016-04-13 Sold (Public Records) $212,500 Public Records
- 2016-04-08 Sold (MLS) $212,500 Cincy MLS
- 2016-03-01 Contingent — Cincy MLS
- 2015-12-18 Listed $224,900 Cincy MLS
- 2015-12-14 Listing Removed — Cincy MLS
- 2015-10-10 Price Changed $229,900 Cincy MLS
- 2015-09-21 Listed $249,900 Cincy MLS
- 2002-06-21 Sold (Public Records) $167,600 Public Records
- 2002-06-14 Sold (MLS) $167,600 Cincy MLS
- 2001-10-24 Listed $169,900 Cincy MLS
- 2001-08-27 Listing Removed — Cincy MLS
- 2001-06-06 Listed $169,900 Cincy MLS
- 2001-04-13 Listing Removed — Cincy MLS
- 2000-10-12 Listed $189,900 Cincy MLS
Property tax history
+6.9%/yrLatest (2025): $7,394 · +9.0% YoY. Source: county tax records.
Cash-flow waterfall
monthlySold comps — $/sqft
last 12 mo · ≤1 miLoading sold comps…