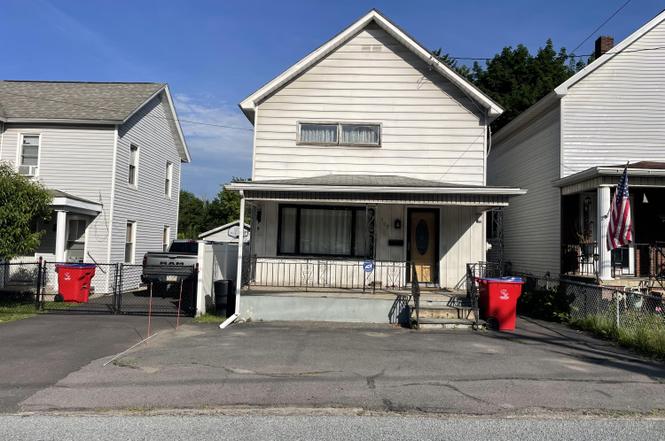
303 Belmont St · Carbondale, PA
Flood risk 4/10 · Minor
- FEMA flood zone
- X (unshaded)
- Chance of flooding over 30 yrs
- 0.24%
- Est. flood insurance / yr
- $473 – $860
Fire risk 3/10 · Minor
- Est. fire insurance / yr
- $511 – $949
Heat risk 3/10 · Minor
- Hot days now (above 90°F)
- 8 days/yr
- Hot days in 30 yrs
- 20 days/yr
Wind risk 2/10 · Minimal
- Chance of severe wind over 30 yrs
- 4.0%
Air-quality risk 2/10 · Minimal
- Unhealthy air days now
- 1 days/yr
- Unhealthy air days in 30 yrs
- 1 days/yr
Risk factors via First Street. Map © Google.
Why this score? — see what drove the D+ grade
The composite is a weighted blend of 9 inputs, each scored 0–100. Each bar is that input's sub-score; the figure is the points it added to the 100-point composite (weight × sub-score).
- Cash flow +15.6/30.0
- ARV discount +14.3/15.0
- DSCR +4.8/10.0
- 1% rule +4.3/10.0
- Livability +3.6/5.0
- Rent growth +2.5/5.0
- Condition / age +2.5/5.0
- Schools +2.0/10.0
- Appreciation +0.0/10.0
$139,000
🖨 Deal sheet 📄 Offer letter ✓ Due diligence
Listing remarks
A little TLC can make this a cozy home. Fenced in backyard. Move right in. Additional adjoining small parcel:Parcel ID: 04506010023
Key facts
- Fenced in backyard
- Built 1920
Tags
Property features AI
Exterior
- Parking: Off-street parking
- Utilities: Public water; Public sewer; 100 amp electric service; Cable available; Electricity connected; Water connected; Sewer connected; Natural gas connected
- Home design: Single family residence; Residential property; Built in 1920
- Construction: Aluminum siding; Stone foundation; Asbestos shingle and metal roof
- Exterior features: Garden; Private yard; Cleared, interior lot; Asphalt road frontage
Interior
- Kitchen: Eat-in kitchen; No appliances included
- Bedrooms: 3 bedrooms (sizes: 9 x 18; 7 x 10; 8 x 8)
- Flooring: Wood floors
- Bathrooms: 1 full bathroom
- Heating & cooling: Natural gas heating; No cooling
- Interior features: Eat-in kitchen; Crawl opening attic; Full unfinished basement
- Laundry & utility: No laundry appliances listed
Neighborhood map
What this means for you Summary
Snapshot
- This is a 3-bed/1.0-bath single-family listed at $139k.
Deal economics
- At list price, monthly cash flow is $59 ($706/yr) — positive.
- The deal already cash-flows at list — no discount required.
- To meet the 1% rule (rent ≥ 1% of price), the offer needs to be $129k (7.2% below list).
- Recommended offer: $129k (7.2% below list) — sets the bar for 1% rule.
- Cap rate 6.8% vs local median 4.8% in Carbondale — top-decile yield for the area; either an underpriced asset or a hidden risk that comps aren't pricing in. Stress-test before assuming the spread holds.
Location & tenants
- Location reads 72/100 on livability (#648 in PA) — a middle-class / working-renter tenant base. Strengths: crime A+, cost of living A+, housing A+; Watch: amenities D+, schools D, employment D.
- Carbondale Area SD (suburban): math 15% / reading 33% proficiency, ranked #480 of 539 in PA (top 89%) — low school quality limits family demand, transient renter base, plan for 1-2y turnover.
- Market conditions: 110 active listings in the ZIP; 8 comparable units currently listed for rent nearby; rentals lingering (median 44d on market — plan ~5-8 weeks vacancy on turnover, expect pricing pressure); 50% of comp listings sitting > 30 days — soft ceiling on asking rent; 251 units permitted in Lackawanna County in 2024 (0 in 5+ unit buildings).
Forward outlook
- Local home prices are declining (-3.0%/yr); year-one equity from $961 of loan paydown is wiped out by about $4k of value loss. Plan a longer hold.
- Lackawanna County population projected to shrink 4% by 2050 — rents likely to lag national; underwrite the cash flow, not the appreciation.
Negotiation context
- Only 1 days on market — expect competitive offers; lowballing is unlikely to land.
Risks & watch-outs
- Watch-outs: built in 1920 — expect roof / HVAC / electrical / plumbing capex.
Questions for the listing agent
- Built in 1920 — when were the roof, HVAC, electrical panel, plumbing, and water heater last replaced?
- Is there a deadline driving the sale (1031 exchange, divorce, estate, relocation)? That informs how much negotiation room exists.
- Schools are D-rated, which usually means shorter tenancies and higher turnover. Who's the typical renter profile here, and what's been the actual vacancy rate?
- The area grade is low — what's the realistic commute time and amenity access for the typical tenant pool here? Any planned neighborhood developments (good or bad) we should know about?
- What's the average days-on-market for RENTAL listings here right now (not sales)? A rising rental-DOM trend means longer vacancies and softer asking-rent achievability than the comps imply.
- What's the recent tenant-quality profile in this submarket — average credit score on applications, eviction rate, late-payment / NSF rate, and stable-employment percentage? A property-management company in the area should have these aggregated.
- How much new for-sale + rental construction is in the pipeline within 1–3 miles? Heavy new supply typically softens prices + rents 12–24 months out; constrained supply supports both.
Investment metrics
- 1% rule
- 0.93% ✗
- Cap rate
- 6.80%
- Cash-on-cash
- 1.81%
- DSCR
- 1.08
- GRM
- 9.0
CMA / ARV
- ARV (on-the-fly)
- $163,822
- Comps found
- 11
Show comp detail 11 sales within ~0.75 mi
| Address | Dist | Beds/Ba | Sqft | Sold | Price | $/sf | Match |
|---|---|---|---|---|---|---|---|
| 109 Farview St | 0.75mi | 3/2.0 | 1,700 (+5%) | 1mo | $95,000 | $56 | 52 |
| 172 Belmont St | 0.23mi | 4/1.0 (+1) | 1,468 (-10%) | 20mo | $100,000 | $68 | 52 |
| 30 Belmont St | 0.69mi | 3/1.5 | 1,730 (+7%) | 6mo | $126,950 | $73 | 50 |
| 16 Oak Ave | 0.60mi | 3/1.5 | 1,573 (-3%) | 20mo | $159,574 | $101 | 48 |
| 267 Dundaff St | 0.69mi | 3/2.5 | 1,760 (+8%) | 1mo | $226,000 | $128 | 47 |
| 21 Prospect St Unit L 38 | 0.43mi | 3/2.0 | 1,519 (-6%) | 23mo | $212,000 | $140 | 46 |
| 232 Dundaff St | 0.64mi | 3/1.0 | 1,715 (+6%) | 18mo | $145,000 | $85 | 46 |
| 154 Dundaff St | 0.73mi | 3/2.0 | 1,700 (+5%) | 11mo | $205,000 | $121 | 45 |
| 20 42nd St | 0.74mi | 3/2.0 | 1,404 (-13%) | 0mo | $155,000 | $110 | 39 |
| 264 Dundaff St | 0.66mi | 4/2.5 (+1) | 1,700 (+5%) | 15mo | $154,000 | $91 | 38 |
| 10 Lord St | 0.73mi | 3/2.0 | 1,840 (+13%) | 21mo | $202,500 | $110 | 22 |
Match score weights: distance 35% · size 25% · config 20% · recency 20%. Top-matched comps best support the ARV.
Projected returns pro-forma
-3.0% appreciation · 3.0% rent growth · sell at horizon
- IRR
- -13.4%
- Equity multiple
- 0.52×
- Total profit
- $-18,756
- Equity at exit
- $20,725
- IRR
- -4.5%
- Equity multiple
- 0.71×
- Total profit
- $-11,427
- Equity at exit
- $12,018
Cash invested: $38,920 (down + closing). Projections, not guarantees.
Landlord ↔ Tenant lean methodology
- Overall (STATE)
- 62 Landlord-Friendly
- State Pennsylvania
- 62 Landlord-Friendly · EVEN
- County
- — inherits STATE
- City
- — inherits STATE
ZIP-level market 18407
- Home prices YoY
- -29.8%
- Active inventory
- 110
- Price-to-rent
- 9.0×
Monthly cashflow live
- Estimated rent
- $1,290 high interval (Pro) →
- Mortgage (P&I)
- −$729
- Tax est. 1.5%
- −$174 /mo · $2,085/yr
- Insurance
- −$58
- HOA
- −$0
- Vacancy / Maint / Mgmt
- −$271
- Net cashflow
- $59
Break-even live
UW: 25.0% down · 7.5% · 30yr · 1.5% tax · 5.0% vac · 8.0% maint · 8.0% mgmt
Financing live
Cash to close
- Down payment
- $34,750
- Closing costs
- $4,170
- Reserves months
- —
- Total cash needed
- —
Loan-product check · same deal, 3 products live
Conventional
25% down · 7.5% · 30yr
- Down + closing
- —
- Monthly P&I
- —
- Monthly cashflow
- —
- DSCR
- —
- Eligible?
- —
Personal DTI + credit; lowest rate.
DSCR
20% down · 8.5% · 30yr
- Down + closing
- —
- Monthly P&I
- —
- Monthly cashflow
- —
- DSCR
- —
- Eligible?
- —
No personal income docs; deal must DSCR.
Hard money
10% down · 12.0% · 12mo
- Down + closing
- —
- Monthly P&I
- —
- Monthly cashflow
- —
- DSCR
- —
- Eligible?
- —
Short-term bridge; refi at stabilization.
Rent comps 8 comps
| Address | Beds | Baths | Sqft | Rent | $/sqft | DOM | Units | Dist |
|---|---|---|---|---|---|---|---|---|
| 418 N Main St Unit 1B Simpson, PA | 2.0 | 1.0 | 1050 | $1,175 | $1.12 | 43d | 1 | 0.26mi |
| 25 Richmond St Carbondale, PA | 3.0 | 1.0 | 1500 | $1,300 | $0.87 | 13d | 1 | 0.38mi |
| 175 Dundaff St Carbondale, PA | 3.0 | 1.0 | 1300 | $1,300 | $1.00 | 13d | 1 | 0.73mi |
| 28 Wyoming St Carbondale, PA | 2.0 | 1.0 | 1200 | $1,045 | $0.87 | 43d | 1 | 0.93mi |
| 29 Park St Carbondale, PA | 4.0 | 1.5 | 1290 | $1,500 | $1.16 | 44d | 1 | 1.05mi |
| 26 S Church St Unit 1st floor Carbondale, PA | 2.0 | 1.0 | 1680 | $995 | $0.59 | 43d | 1 | 1.20mi |
| 151 Wyoming St Carbondale, PA | 3.0 | 1.0 | 1200 | $1,300 | $1.08 | 13d | 1 | 1.30mi |
| 18 Parish Ct Carbondale, PA | 2.0 | 1.0 | 1050 | $1,300 | $1.24 | 13d | 1 | 1.48mi |
Listing history 2 events
-
2026-06-18remarks 131-char remark
-
2026-06-18$139,000 Active 1 DOM
ⓘ Source: listings_history table (triggers on properties + properties_extension) + one-shot
backfill from property_details.listing_events for pre-trigger history.
Climate risk First Street
- Flood 4/10 Moderate FEMA zone X (unshaded) · 24% chance over 30 yrs
- Wildfire 3/10 Moderate
- Heat 3/10 Moderate 8 d/yr ≥90°F today · 20 d/yr by 30 yrs out
- Wind 2/10 Low 4% chance of damaging wind over 30 yrs
- Air quality 2/10 Low 1 unhealthy d/yr today · 1 by 30 yrs out
Nearby sold comps map
Loading sold comps map…
Walkable amenities ~0.75 mi
Loading nearby amenities…
Taxation est. · year 1
- Rental income
- $15,485
- − Mortgage interest
- −$7,786
- − Property taxes
- −$2,085
- − Insurance
- −$695
- − Repairs & maintenance
- −$1,239
- − Management
- −$1,239
- − Depreciation
- −$4,044
- Taxable loss
- −$1,602
- Est. tax savings @ 24.0%
- +$385
- After-tax cash flow
- $1,091/yr
For passive investors: Depreciation is non-cash, so a rental often shows a tax loss while cash-flowing — sheltering income. Rental losses are passive: they offset passive income freely, and up to $25,000/yr can offset ordinary (W-2) income if you actively participate and your MAGI is under $100k (phasing out to $0 by $150k); unused losses carry forward. On sale, claimed depreciation is recaptured at up to 25%, and gains may owe capital-gains tax (a 1031 exchange can defer both). Figures are a year-1 estimate at your 24.0% rate — not tax advice; consult a CPA.
Schools (NCES district)
- District
- Carbondale Area SD
- NCES district ID
- 4204980
- Math proficiency
- 15% ▼ -14.00%
- Reading proficiency
- 33% ▼ -23.00%
- Median HH income
- $35,070
- Composite
- 19.73/100
- National rank
- #8714
- State rank
- #480 of 539 in PA
Livability — Carbondale
- Score
- 72/100
- State rank
- #648
- US rank
- #6298
Category grades
Schools grade is shown separately in the Schools card above.
Census & demographics
- Census place
- Carbondale, PA
- County
- Lackawanna County · 134,448 people
- City population
- 14,445
- Metro
- Scranton--Wilkes-Barre, PA
- Population (ZIP)
- 14,445
- Household income
- $59,652
- Rent vs Own
- Severe rent burden
- 430.0
Population outlook (Lackawanna County) Hauer SSP2
- Today (2025)
- 210,652 people
- By 2030
- 208,623 · -1.0%
- By 2040
- 203,980 · -3.2%
- By 2050
- 201,069 · -4.5%
- By 2075
- 205,026 · -2.7%
- By 2100
- 210,851 · +0.1%
Race, ethnicity, and origin ACS 2023
- Neighborhood character
- Predominantly White (85%)
- Race & ethnicity
- White 85% Hispanic / Latino 9% Two or more races 6% Black 1% Asian 1%
- Hispanic origin (detail)
- Mexican 2% Puerto Rican 5%
- Common ancestry
- Romanian 11% Scotch-Irish 3% Subsaharan African 1%
- Foreign-born
- 2% · Canada, Vietnam
- Languages at home
- 95% English-only · Spanish 3% Other Indo-European 1% Russian/Polish/Slavic 1%
Political lean MEDSL · Lackawanna
- 2024 margin
- Toss-up / Even · D 51.0% · R 48.3%
- 2008→2024 swing
- -23.2pp toward R · 2008: 26.0pp · 2024: 2.8pp
- All cycles
- 2024: D+2.8 2020: D+8.4 2016: D+3.4 2012: D+27.4 2008: D+26.0
Not yet ingested
- Civics
- —
Market trends
- HPI YoY
- ▼ -59.46%
- Current HPI
- 140.1227
- Rent YoY
- —
- Metro
- Scranton--Wilkes-Barre, PA
- State GDP YoY
- ▲ 1.68%
- F500 in state
- 34
Industry mix (Fortune 500 HQ in PA)
| Industry | F500 HQs | Revenue |
|---|---|---|
| Healthcare | 2 | $309B |
|
||
| Insurance | 2 | $27B |
|
||
| Telecommunications / Media | 1 | $124B |
|
||
| Industrial Distribution | 1 | $22B |
|
||
| Financial Services | 1 | $20B |
|
||
| Chemicals / Materials | 1 | $18B |
|
||
Price history
1 event — show timeline
- 2026-06-14 Listed $139,000 GSBR as distributed by MLS GRID
Property tax history
+36.3%/yrLatest (2026): $38,991 · +2445.3% YoY. Source: county tax records.
Cash-flow waterfall
monthlySold comps — $/sqft
last 12 mo · ≤1 miLoading sold comps…