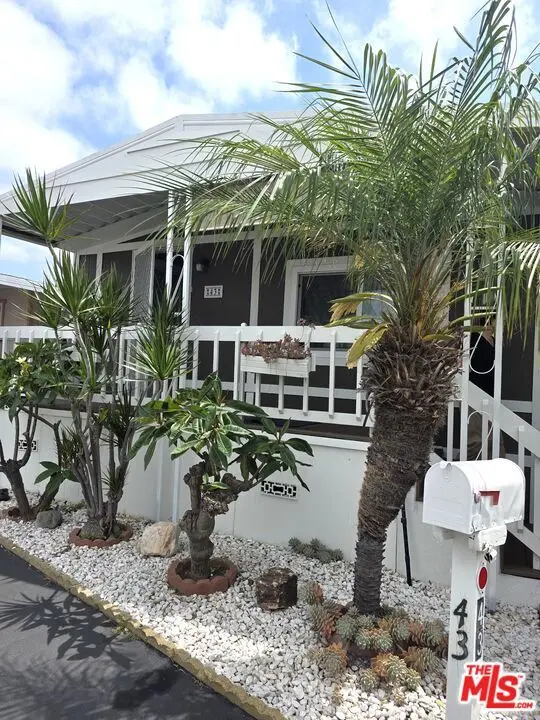
12550 Carson St #43 · Hawaiian Gardens, CA
Flood risk 3/10 · Minor
- FEMA flood zone
- X
- Chance of flooding over 30 yrs
- 0.1%
- Est. flood insurance / yr
- $507 – $1,088
Fire risk 1/10 · Minimal
- Est. fire insurance / yr
- $659 – $1,223
Heat risk 5/10 · Moderate
- Hot days now (above 89°F)
- 7 days/yr
- Hot days in 30 yrs
- 22 days/yr
Wind risk 1/10 · Minimal
- Chance of severe wind over 30 yrs
- —
Air-quality risk 5/10 · Moderate
- Unhealthy air days now
- 7 days/yr
- Unhealthy air days in 30 yrs
- 9 days/yr
Risk factors via First Street. Map © Google.
Why this score? — see what drove the B- grade
The composite is a weighted blend of 9 inputs, each scored 0–100. Each bar is that input's sub-score; the figure is the points it added to the 100-point composite (weight × sub-score).
- Cash flow +30.0/30.0
- 1% rule +10.0/10.0
- DSCR +10.0/10.0
- Schools +7.3/10.0
- Livability +3.3/5.0
- Rent growth +2.5/5.0
- Condition / age +2.5/5.0
- ARV discount +0.0/15.0
- Appreciation +0.0/10.0
$180,000
🖨 Deal sheet 📄 Offer letter ✓ Due diligence
Listing remarks MLS
Charming Manufactured Home in a Senior 55+ Park with Low Space Rent of $510/month. Features Master Suite Upgrade Throughout Newer Central Heat & Air Condition Newer Cabinet, Counter Top, Stove, Microwave, Refrigerator. Totally remodel Master Suite Bathroom. Copper Pipping, Earthquake Brace. Dual Pane Windows. Concrete Driveway and Much Much More. Welcome to the Lovely Senior Life Style.
Key facts
- Indoor laundry area
- Dual-pane windows
- Shaded outdoor area
Tags
Property features AI
Finance
- Other: Listing terms: Cash or cash to new loan; Manager approval required for sale; One shed on the property; Directions: Bloomfield Ave + Carson St; Disclosures: Selling as-is; senior community
- Financial info: Land lease (lease amount shown separately)
- HOA & community: Clubhouse; Billiard room; Pool; Manager approval required; Association pet rules: call; Approximately 200 units in the community; Park manager on site
Exterior
- Parking: Carport; Two covered parking spaces; Two carport spaces
- Security: Carbon monoxide detectors; Smoke detector; Community security
- Utilities: Public water
- Home design: Residential mobile home; Located in a senior park (Lakewood Mobil Estate)
- Construction: Mobile home 44 x 10
- Exterior features: Community pool; Located in city
Interior
- Kitchen: Range/oven; Microwave; Refrigerator
- Flooring: Laminate floors
- Bathrooms: One full bath; One 3/4 bath
- Heating & cooling: Central heat; Central cooling; A/C
- Interior features: Double pane windows; Ceiling fan
- Laundry & utility: Washer; Dryer; Laundry inside; Water heater unit
Neighborhood map
What this means for you Summary
Snapshot
- This is a 2-bed/2.0-bath manufactured listed at $180k.
Deal economics
- At list price, monthly cash flow is $1k ($13k/yr) — positive.
- The deal already cash-flows at list — no discount required.
- Meets the 1% rule at list price ($3k rent vs $180k).
- Recommended offer: $177k (1.5% below list) — sets the bar for market timing.
Location & tenants
- Location reads 66/100 on livability (#341 in CA) — a middle-class / working-renter tenant base. Strengths: amenities A, commute A, housing B; Watch: health & safety D+, schools F, crime F.
- Abc Unified (suburban): math 77% / reading 90% proficiency, ranked #24 of 517 in CA (top 5%) — strong family-tenant draw, lease renewals of 3-5y typical.
- Market conditions: 13 active listings in the ZIP; 28 comparable units currently listed for rent nearby; rentals leasing fast (median 7d on market — plan ~1-2 weeks tenant-placement turnaround); 19,697 units permitted in Los Angeles County in 2024 (9,426 in 5+ unit buildings).
Forward outlook
- Local home prices are declining (-3.0%/yr); year-one equity from $1k of loan paydown is wiped out by about $5k of value loss. Plan a longer hold.
- Los Angeles County population projected at +9% by 2050 — modest demand growth; plan on rents tracking national, not racing it.
- At projected returns (-3.0% appreciation + 3.0% rent growth), your $50k cash investment doubles in ~5 years — after that, you're playing with house money.
Negotiation context
- It's been on market 26 days — a 2% lower offer ($177k) is reasonable based on typical stale-listing flexibility.
- 3 sale attempts since 24y ago with the ask held roughly flat each time — persistent listings suggest the price (not the market) is what's stuck; bring a comps-based counter.
- Current owner paid $50k; list at $180k implies a 260% gain — meaningful room to come down on a strong offer.
Risks & watch-outs
- Climate carrying-cost: extreme-heat days projected 7→22/yr by 2055 (HVAC capex compounding) — expect insurance premiums to compound above CPI over the hold.
Questions for the listing agent
- Built in 1977 — when were the roof, HVAC, electrical panel, plumbing, and water heater last replaced?
- Is there a deadline driving the sale (1031 exchange, divorce, estate, relocation)? That informs how much negotiation room exists.
- Schools are F-rated, which usually means shorter tenancies and higher turnover. Who's the typical renter profile here, and what's been the actual vacancy rate?
- Crime grade is F in this area — have there been break-ins, vandalism, or insurance claims at this property in the last 3 years? What carrier currently insures it and at what premium?
- What's the average days-on-market for RENTAL listings here right now (not sales)? A rising rental-DOM trend means longer vacancies and softer asking-rent achievability than the comps imply.
- What's the recent tenant-quality profile in this submarket — average credit score on applications, eviction rate, late-payment / NSF rate, and stable-employment percentage? A property-management company in the area should have these aggregated.
- How much new for-sale + rental construction is in the pipeline within 1–3 miles? Heavy new supply typically softens prices + rents 12–24 months out; constrained supply supports both.
Investment metrics
- 1% rule
- 1.64% ✓
- Cap rate
- 13.51%
- Cash-on-cash
- 25.77%
- DSCR
- 2.15
- GRM
- 5.1
CMA / ARV
- ARV (on-the-fly)
- $145,200
- Comps found
- 7
Show comp detail 7 sales within ~0.75 mi
| Address | Dist | Beds/Ba | Sqft | Sold | Price | $/sf | Match |
|---|---|---|---|---|---|---|---|
| 12550 Carson St #57 | 0.00mi | 2/2.0 | 880 (0%) | 8mo | $175,000 | $199 | 94 |
| 12550 Carson St #96 | 0.00mi | 2/2.0 | 880 (0%) | 11mo | $145,000 | $165 | 91 |
| 12550 E Carson St #29 | 0.00mi | 2/2.0 | 880 (0%) | 12mo | $175,000 | $199 | 90 |
| 12550 Carson St #113 | 0.07mi | 2/2.0 | 960 (+9%) | 13mo | $150,000 | $156 | 71 |
| 12550 Carson St #124 | 0.00mi | 2/2.0 | 1,000 (+14%) | 13mo | $200,000 | $200 | 67 |
| 22221 Bloomfield St #12 | 0.23mi | 2/1.5 | 800 (-9%) | 18mo | $70,000 | $88 | 57 |
| 9080 Bloomfield Ave #86 | 0.30mi | 2/2.0 | 1,000 (+14%) | 23mo | $35,000 | $35 | 44 |
Match score weights: distance 35% · size 25% · config 20% · recency 20%. Top-matched comps best support the ARV.
Projected returns pro-forma
-3.0% appreciation · 3.0% rent growth · sell at horizon
- IRR
- 19.4%
- Equity multiple
- 1.79×
- Total profit
- $39,825
- Equity at exit
- $26,839
- IRR
- 27.7%
- Equity multiple
- 3.45×
- Total profit
- $123,641
- Equity at exit
- $15,563
Cash invested: $50,400 (down + closing). Projections, not guarantees.
Landlord ↔ Tenant lean methodology
- Overall (STATE)
- 18 Strongly Tenant-Friendly
- State California
- 18 Strongly Tenant-Friendly · D+13
- County
- — inherits STATE
- City
- — inherits STATE
ZIP-level market 90716
- Home prices YoY
- -19.9%
- Active inventory
- 13
- Price-to-rent
- 5.1×
Monthly cashflow live
- Estimated rent
- $2,945 high interval (Pro) →
- Mortgage (P&I)
- −$944
- Tax est. 1.5%
- −$225 /mo · $2,700/yr
- Insurance
- −$75
- HOA
- −$0
- Vacancy / Maint / Mgmt
- −$618
- Net cashflow
- $1,083
Break-even live
UW: 25.0% down · 7.5% · 30yr · 1.5% tax · 5.0% vac · 8.0% maint · 8.0% mgmt
Financing live
Cash to close
- Down payment
- $45,000
- Closing costs
- $5,400
- Reserves months
- —
- Total cash needed
- —
Loan-product check · same deal, 3 products live
Conventional
25% down · 7.5% · 30yr
- Down + closing
- —
- Monthly P&I
- —
- Monthly cashflow
- —
- DSCR
- —
- Eligible?
- —
Personal DTI + credit; lowest rate.
DSCR
20% down · 8.5% · 30yr
- Down + closing
- —
- Monthly P&I
- —
- Monthly cashflow
- —
- DSCR
- —
- Eligible?
- —
No personal income docs; deal must DSCR.
Hard money
10% down · 12.0% · 12mo
- Down + closing
- —
- Monthly P&I
- —
- Monthly cashflow
- —
- DSCR
- —
- Eligible?
- —
Short-term bridge; refi at stabilization.
Rent comps 28 comps
| Address | Beds | Baths | Sqft | Rent | $/sqft | DOM | Units | Dist |
|---|---|---|---|---|---|---|---|---|
| 21600 Bloomfield Ave Hawaiian Gardens, CA | 1.0 | 1.0 | 650 | $2,020 | $3.11 | 7d | 2 | 0.21mi |
| 4455 Casa Grande Cir Cypress, CA | 1.0–2.0 | 1.0–1.5 | 811 | $2,837 | $3.50 | 1d | 6 | 0.49mi |
| 12750 Centralia St Lakewood, CA | 2.0 | 1.0–1.5 | 1056 | $3,350 | $3.17 | 3d | 2 | 0.50mi |
| 12750 Centralia St #43 Lakewood, CA | 2.0 | 1.5 | 1056 | $3,500 | $3.31 | 17d | 1 | 0.53mi |
| 4550 Lincoln Ave Cypress, CA | 1.0–2.0 | 1.0–2.0 | 860 | $3,225 | $3.75 | 1d | 3 | 0.62mi |
| 8120 E Turbo St Long Beach, CA | 3.0 | 1.5 | 1120 | $3,900 | $3.48 | 43d | 1 | 0.64mi |
| 12100 226th St Hawaiian Gardens, CA | 2.0 | 1.0 | 757 | $2,195 | $2.90 | 3d | 1 | 0.71mi |
| 9802 Bloomfield Ave Cypress, CA | 1.0 | 1.0 | 770 | $2,490 | $3.23 | 1d | 2 | 0.77mi |
| 20817 Ely Ave Lakewood, CA | 3.0 | 1.0 | 1102 | $3,550 | $3.22 | 2d | 1 | 0.79mi |
| 12050 226th St Hawaiian Gardens, CA | 3.0 | 2.0 | 1063 | $3,100 | $2.92 | 43d | 1 | 0.80mi |
| 12610 Vandemere St Lakewood, CA | 3.0 | 2.0 | 1056 | $8,250 | $7.81 | 1d | 1 | 0.95mi |
| 4812 Grace Ave Unit C Cypress, CA | 2.0 | 2.0 | 900 | $2,395 | $2.66 | 13d | 1 | 0.99mi |
| 20743 Elaine Ave Lakewood, CA | 2.0 | 1.0 | 740 | $2,650 | $3.58 | 7d | 1 | 1.06mi |
| 12022 207th St Lakewood, CA | 3.0 | 2.0 | 1088 | $3,950 | $3.63 | 7d | 1 | 1.07mi |
| 12022 207th St Lakewood, CA | 3.0 | 2.0 | 1088 | $3,950 | $3.63 | 24d | 1 | 1.07mi |
| 12350 Del Amo Blvd Lakewood, CA | 1.0–3.0 | 1.0–2.0 | 866 | $2,616 | $3.02 | 2d | 27 | 1.07mi |
| 21525 Pioneer Blvd Lakewood, CA | 2.0 | 2.0 | 910 | $2,595 | $2.85 | 43d | 1 | 1.08mi |
| 20810 Arline Ave Apt 14 Lakewood, CA | 2.0 | 1.5 | 896 | $2,495 | $2.78 | 43d | 1 | 1.20mi |
| 11754 Walcroft St Lakewood, CA | 3.0 | 2.0 | 1050 | $3,200 | $3.05 | 43d | 1 | 1.28mi |
| 4002 Bryant Ct Cypress, CA | 3.0 | 1.5 | 1046 | $3,400 | $3.25 | 22d | 1 | 1.30mi |
| 3190 Claremore Ave Long Beach, CA | 1.0 | 1.0 | 850 | $2,050 | $2.41 | 5d | 1 | 1.33mi |
| 11555 216th St Lakewood, CA | 1.0 | 1.0 | 630 | $2,315 | $3.67 | 7d | 2 | 1.33mi |
| 11839 205th St Lakewood, CA | 3.0 | 1.0 | 1000 | $4,500 | $4.50 | 43d | 1 | 1.38mi |
| 11839 205th St Lakewood, CA | 3.0 | 1.0 | 1060 | $4,500 | $4.25 | 7d | 1 | 1.38mi |
| 11509 216th St Lakewood, CA | 1.0–2.0 | 1.0–2.0 | 816 | $2,950 | $3.62 | 2d | 1 | 1.39mi |
| 11624 208th St Lakewood, CA | 3.0 | 2.0 | 961 | $3,195 | $3.32 | 43d | 1 | 1.46mi |
| 11441 216th St Unit 215-09 Lakewood, CA | 2.0 | 2.0 | 975 | $2,650 | $2.72 | 19d | 1 | 1.46mi |
| 11441 216th St Lakewood, CA | 2.0 | 2.0 | 975 | $2,650 | $2.72 | 43d | 1 | 1.46mi |
Listing history 20 events
-
2026-06-18days on market $180,000 Active 26 DOM
-
2026-06-17days on market $180,000 Active 25 DOM
-
2026-06-16days on market $180,000 Active 24 DOM
-
2026-06-15days on market $180,000 Active 23 DOM
-
2026-06-13days on market $180,000 Active 21 DOM
-
2026-06-13days on market $180,000 Active 20 DOM
-
2026-06-09days on market $180,000 Active 17 DOM
-
2026-06-08days on market $180,000 Active 16 DOM
-
2026-06-07days on market $180,000 Active 15 DOM
-
2026-06-04days on market $180,000 Active 12 DOM
-
2026-06-03days on market $180,000 Active 11 DOM
-
2026-06-02days on market $180,000 Active 10 DOM
-
2026-06-01days on market $180,000 Active 9 DOM
-
2026-05-31days on market $180,000 Active 8 DOM
-
2026-05-23$180,000 Active
-
2015-01-08soldstatus $50,000 Closed Sale 395-char remark
Show marketing remark (395 chars)
Charming Manufactured Home in a Senior 55+ Park with Low Space Rent of $510/month. Features Master Suite Upgrade Throughout Newer Central Heat & Air Condition Newer Cabinet, Counter Top, Stove, Microwave, Refrigerator. Totally remodel Master Suite Bathroom. Copper Pipping, Earthquake Brace. Dual Pane Windows. Concrete Driveway and Much Much More. Welcome to the Lovely Senior Life Style.
-
2014-12-16status Pending Sale 395-char remark
Show marketing remark (395 chars)
Charming Manufactured Home in a Senior 55+ Park with Low Space Rent of $510/month. Features Master Suite Upgrade Throughout Newer Central Heat & Air Condition Newer Cabinet, Counter Top, Stove, Microwave, Refrigerator. Totally remodel Master Suite Bathroom. Copper Pipping, Earthquake Brace. Dual Pane Windows. Concrete Driveway and Much Much More. Welcome to the Lovely Senior Life Style.
-
2014-11-07$54,900 Active 395-char remark
Show marketing remark (395 chars)
Charming Manufactured Home in a Senior 55+ Park with Low Space Rent of $510/month. Features Master Suite Upgrade Throughout Newer Central Heat & Air Condition Newer Cabinet, Counter Top, Stove, Microwave, Refrigerator. Totally remodel Master Suite Bathroom. Copper Pipping, Earthquake Brace. Dual Pane Windows. Concrete Driveway and Much Much More. Welcome to the Lovely Senior Life Style.
-
2002-08-07soldstatus $31,000 74-char remark
Show marketing remark (74 chars)
Beautiful 55+ Park Low Space Rent $439 P/Mo. New Carpet. Ready To Move In.
-
2002-04-30$32,900 74-char remark
Show marketing remark (74 chars)
Beautiful 55+ Park Low Space Rent $439 P/Mo. New Carpet. Ready To Move In.
ⓘ Source: listings_history table (triggers on properties + properties_extension) + one-shot
backfill from property_details.listing_events for pre-trigger history.
Climate risk First Street
- Flood 3/10 Moderate FEMA zone X · 10% chance over 30 yrs
- Wildfire 1/10 Low
- Heat 5/10 Major 7 d/yr ≥89°F today · 22 d/yr by 30 yrs out
- Wind 1/10 Low
- Air quality 5/10 Major 7 unhealthy d/yr today · 9 by 30 yrs out
Nearby sold comps map
Loading sold comps map…
Walkable amenities ~0.75 mi
Loading nearby amenities…
Taxation est. · year 1
- Rental income
- $35,339
- − Mortgage interest
- −$10,083
- − Property taxes
- −$2,700
- − Insurance
- −$900
- − Repairs & maintenance
- −$2,827
- − Management
- −$2,827
- − Depreciation
- −$5,236
- Taxable income
- $10,766
- Est. tax owed @ 24.0%
- −$2,584
- After-tax cash flow
- $10,407/yr
For passive investors: Depreciation is non-cash, so a rental often shows a tax loss while cash-flowing — sheltering income. Rental losses are passive: they offset passive income freely, and up to $25,000/yr can offset ordinary (W-2) income if you actively participate and your MAGI is under $100k (phasing out to $0 by $150k); unused losses carry forward. On sale, claimed depreciation is recaptured at up to 25%, and gains may owe capital-gains tax (a 1031 exchange can defer both). Figures are a year-1 estimate at your 24.0% rate — not tax advice; consult a CPA.
Schools (NCES district)
- District
- Abc Unified
- NCES district ID
- 0601620
- Math proficiency
- 77% ▲ 22.00%
- Reading proficiency
- 90% ▲ 24.00%
- Median HH income
- $70,852
- Composite
- 72.51/100
- National rank
- #199
- State rank
- #24 of 517 in CA
Livability — Hawaiian Gardens
- Score
- 66/100
- State rank
- #341
- US rank
- #11666
Category grades
Schools grade is shown separately in the Schools card above.
Census & demographics
- Census place
- Hawaiian Gardens, CA
- City population
- 13,743
- Population (ZIP)
- 13,743
Population outlook (Los Angeles County) Hauer SSP2
- Today (2025)
- 10,940,515 people
- By 2030
- 11,256,481 · +2.9%
- By 2040
- 11,729,929 · +7.2%
- By 2050
- 11,948,407 · +9.2%
- By 2075
- 11,818,114 · +8.0%
- By 2100
- 10,842,928 · -0.9%
Race, ethnicity, and origin ACS 2023
- Neighborhood character
- Predominantly Hispanic (76%)
- Race & ethnicity
- Hispanic / Latino 76% Two or more races 21% Asian 11% White 7% Black 4% Native American 4%
- Hispanic origin (detail)
- Mexican 68%
- Common ancestry
- Italian 1%
- Foreign-born
- 38% · Canada, South Korea, China
- Languages at home
- 26% English-only · Spanish 61% Korean 5% Other Asian/Pacific 3%
Political lean MEDSL · Los Angeles
- 2024 margin
- Solid D (+32.9) · D 64.8% · R 31.9% · Other 3.3%
- 2008→2024 swing
- -7.4pp toward R · 2008: 40.4pp · 2024: 32.9pp
- All cycles
- 2024: D+32.9 2020: D+44.2 2016: D+48.0 2012: D+40.0 2008: D+40.4
Not yet ingested
- Civics
- —
Market trends
- HPI YoY
- ▼ -123.15%
- Current HPI
- 496.7459
- Rent YoY
- —
- Metro
- —
- State GDP YoY
- ▲ 3.21%
- F500 in state
- 116
Industry mix (Fortune 500 HQ in CA)
| Industry | F500 HQs | Revenue |
|---|---|---|
| Technology | 27 | $1,492B |
|
||
| Financial Services | 3 | $174B |
|
||
| Retail | 3 | $44B |
|
||
| Insurance | 3 | $26B |
|
||
| Media / Entertainment | 2 | $115B |
|
||
| Pharmaceuticals / Biotech | 2 | $62B |
|
||
Price history
+447.1% since first listed6 events — show timeline
- 2026-05-23 Listed $180,000 TheMLS
- 2015-01-08 Sold (MLS) $50,000 CRMLS
- 2014-12-16 Pending — CRMLS
- 2014-11-07 Listed $54,900 CRMLS
- 2002-08-07 Sold (MLS) $31,000 CRMLS
- 2002-04-30 Listed $32,900 CRMLS
Property tax history
+6.5%/yrLatest (2025): $255 · +6.5% YoY. Source: county tax records.
Cash-flow waterfall
monthlySold comps — $/sqft
last 12 mo · ≤1 miLoading sold comps…