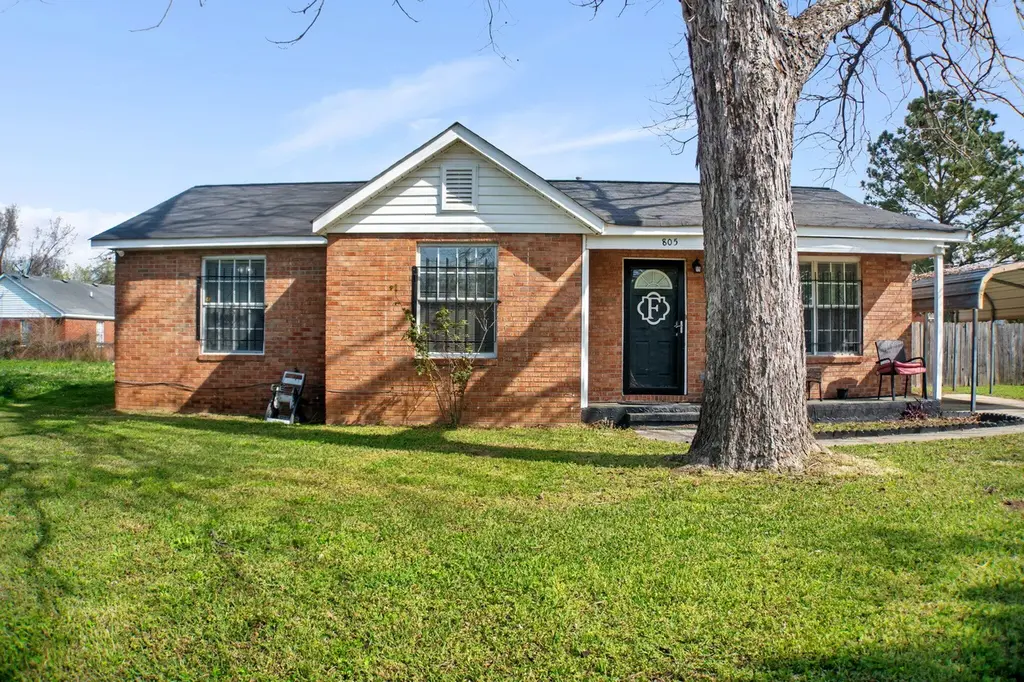
805 Perry Ct · Augusta-Richmond County consolidated government (balance), GA
Flood risk 6/10 · Moderate
- FEMA flood zone
- X (unshaded)
- Chance of flooding over 30 yrs
- 0.73%
- Est. flood insurance / yr
- $507 – $1,088
Fire risk 3/10 · Minor
- Est. fire insurance / yr
- $963 – $1,789
Heat risk 8/10 · Major
- Hot days now (above 108°F)
- 7 days/yr
- Hot days in 30 yrs
- 18 days/yr
Wind risk 6/10 · Moderate
- Chance of severe wind over 30 yrs
- 65.0%
Air-quality risk 4/10 · Minor
- Unhealthy air days now
- 4 days/yr
- Unhealthy air days in 30 yrs
- 4 days/yr
Risk factors via First Street. Map © Google.
Why this score? — see what drove the D grade
The composite is a weighted blend of 9 inputs, each scored 0–100. Each bar is that input's sub-score; the figure is the points it added to the 100-point composite (weight × sub-score).
- Cash flow +15.9/30.0
- Appreciation +9.1/10.0
- DSCR +4.9/10.0
- 1% rule +3.7/10.0
- ARV discount +2.5/15.0
- Livability +2.5/5.0
- Condition / age +2.5/5.0
- Rent growth +2.2/5.0
- Schools +1.3/10.0
$149,900
🖨 Deal sheet 📄 Offer letter ✓ Due diligence
Listing remarks
Discover 805 Perry Ct, this charming 3 bedroom 2 bath brick residence is a perfect starter home or investment opportunity. The well-maintained property is nestled in a quiet, peaceful cul de sac, great for enjoying the yard and neighborhood. Conveniently located near the medical college and downtown Augusta. Schedule your tour today!
Key facts
- 0.23 acre lot
- Garage
- Built 1987
Neighborhood map
What this means for you Summary
Snapshot
- This is a 3-bed/2.0-bath single-family listed at $150k.
Deal economics
- At list price, monthly cash flow is $72 ($862/yr) — positive.
- The deal already cash-flows at list — no discount required.
- To meet the 1% rule (rent ≥ 1% of price), the offer needs to be $131k (12.6% below list).
- Recommended offer: $131k (12.6% below list) — sets the bar for 1% rule.
- Cap rate 6.9% vs local median 5.3% in Augusta-Richmond County consolidated government (balance) — top-decile yield for the area; either an underpriced asset or a hidden risk that comps aren't pricing in. Stress-test before assuming the spread holds.
Location & tenants
- Location reads: area grade D — affects rentability + tenant quality, not the cash-flow math above.
- Richmond County (urban): math 12% / reading 20% proficiency, ranked #154 of 174 in GA (top 88%) — low school quality limits family demand, transient renter base, plan for 1-2y turnover; 72% free/reduced lunch — lower-income household profile, screen leases tightly.
- Zoned schools: Jenkins-White Elementary School (math 8% / reading 8%, grade F, #1,125 of 1,228 statewide, top 93%, 389 students, 98% FRL); W.S. Hornsby Middle School (math 2% / reading 5%, grade F, #468 of 470 statewide, top 100%, 399 students, 98% FRL) — zoned schools average 98% FRL vs 72% district-wide (26 pts higher); higher-poverty schools than district average — tighter screening recommended.
- Market conditions: Rents soft (-1.3%/yr); 129 active listings in the ZIP; 30 comparable units currently listed for rent nearby; rentals at typical pace (median 24d on market — plan ~3-4 weeks tenant-placement turnaround); 43% of comp listings sitting > 30 days — soft ceiling on asking rent; lower-income renter base — watch delinquency; 561 units permitted in Richmond County in 2024 (0 in 5+ unit buildings).
Forward outlook
- In year one you build about $13k of equity ($1k loan paydown + $12k appreciation (8.2% local appreciation)).
- Richmond County population projected to shrink 5% by 2050 — rents likely to lag national; underwrite the cash flow, not the appreciation.
- At projected returns (8.2% appreciation + 0.0% rent growth), your $42k cash investment doubles in ~3 years — after that, you're playing with house money.
- By year 3, paydown + projected appreciation supports a ~$33k cash-out refi (75% LTV) — recoverable capital for the next deal without selling this one.
Negotiation context
- Only 0 days on market — expect competitive offers; lowballing is unlikely to land.
- 6 sale attempts since 18y ago with the ask held roughly flat each time — persistent listings suggest the price (not the market) is what's stuck; bring a comps-based counter.
- Current owner paid $42k; list at $150k implies a 257% gain — meaningful room to come down on a strong offer.
Risks & watch-outs
- Climate carrying-cost: major flood risk; major wind risk, 65% chance of damaging wind over 30y; extreme-heat days projected 7→18/yr by 2055 (HVAC capex compounding) — expect insurance premiums to compound above CPI over the hold.
Questions for the listing agent
- Is there a deadline driving the sale (1031 exchange, divorce, estate, relocation)? That informs how much negotiation room exists.
- The area grade is low — what's the realistic commute time and amenity access for the typical tenant pool here? Any planned neighborhood developments (good or bad) we should know about?
- What's the average days-on-market for RENTAL listings here right now (not sales)? A rising rental-DOM trend means longer vacancies and softer asking-rent achievability than the comps imply.
- What's the recent tenant-quality profile in this submarket — average credit score on applications, eviction rate, late-payment / NSF rate, and stable-employment percentage? A property-management company in the area should have these aggregated.
- How much new for-sale + rental construction is in the pipeline within 1–3 miles? Heavy new supply typically softens prices + rents 12–24 months out; constrained supply supports both.
Investment metrics
- 1% rule
- 0.87% ✗
- Cap rate
- 6.87%
- Cash-on-cash
- 2.05%
- DSCR
- 1.09
- GRM
- 9.5
CMA / ARV
- ARV (on-the-fly)
- $134,865
- Comps found
- 12
Show comp detail 12 sales within ~0.75 mi
| Address | Dist | Beds/Ba | Sqft | Sold | Price | $/sf | Match |
|---|---|---|---|---|---|---|---|
| 1015 Dugas St | 0.43mi | 3/2.0 | 1,182 (-3%) | 4mo | $132,000 | $112 | 72 |
| 1421 1/2 Picquet Ave | 0.26mi | 3/1.0 | 1,188 (-2%) | 10mo | $95,000 | $80 | 72 |
| 919 Wrightsboro Rd | 0.11mi | 4/2.0 (+1) | 1,361 (+12%) | 16mo | $115,000 | $84 | 56 |
| 914 Pine St | 0.53mi | 3/2.5 | 1,248 (+3%) | 16mo | $247,000 | $198 | 56 |
| 912 Pine St | 0.54mi | 3/2.5 | 1,248 (+3%) | 17mo | $227,000 | $182 | 54 |
| 1021 Miller St | 0.50mi | 4/1.0 (+1) | 1,317 (+8%) | 1mo | $45,000 | $34 | 53 |
| 1335 Conklin Ave | 0.69mi | 3/2.0 | 1,200 (-1%) | 16mo | $145,000 | $121 | 53 |
| 1431 Perry St | 0.70mi | 3/1.5 | 1,269 (+4%) | 10mo | $110,000 | $87 | 49 |
| 1608 Mill St | 0.64mi | 3/1.0 | 1,167 (-4%) | 20mo | $30,000 | $26 | 43 |
| 1757 Old Savannah Rd | 0.75mi | 3/2.0 | 1,148 (-6%) | 17mo | $174,000 | $152 | 42 |
| 1435 Perry Ave | 0.72mi | 3/2.0 | 1,303 (+7%) | 19mo | $145,000 | $111 | 39 |
| 1147 Mercier St | 0.70mi | 4/1.0 (+1) | 1,316 (+8%) | 10mo | $42,000 | $32 | 36 |
Match score weights: distance 35% · size 25% · config 20% · recency 20%. Top-matched comps best support the ARV.
Projected returns pro-forma
8.18% appreciation · 0.0% rent growth · sell at horizon
- IRR
- 20.9%
- Equity multiple
- 2.53×
- Total profit
- $64,193
- Equity at exit
- $115,726
- IRR
- 18.5%
- Equity multiple
- 5.19×
- Total profit
- $175,841
- Equity at exit
- $231,496
Cash invested: $41,972 (down + closing). Projections, not guarantees.
Landlord ↔ Tenant lean methodology
- Overall (STATE)
- 90 Strongly Landlord-Friendly
- State Georgia
- 90 Strongly Landlord-Friendly · R+3
- County
- — inherits STATE
- City
- — inherits STATE
ZIP-level market 30901
- Home prices YoY
- 4.1%
- Rents YoY
- -1.3%
- Active inventory
- 129
- Price-to-rent
- 9.5×
Monthly cashflow live
- Estimated rent
- $1,310 high interval (Pro) →
- Mortgage (P&I)
- −$786
- Tax from tax record
- −$115 /mo · $1,378/yr
- Insurance
- −$62
- HOA
- −$0
- Vacancy / Maint / Mgmt
- −$275
- Net cashflow
- $72
Break-even live
UW: 25.0% down · 7.5% · 30yr · 1.5% tax · 5.0% vac · 8.0% maint · 8.0% mgmt
Financing live
Cash to close
- Down payment
- $37,475
- Closing costs
- $4,497
- Reserves months
- —
- Total cash needed
- —
Loan-product check · same deal, 3 products live
Conventional
25% down · 7.5% · 30yr
- Down + closing
- —
- Monthly P&I
- —
- Monthly cashflow
- —
- DSCR
- —
- Eligible?
- —
Personal DTI + credit; lowest rate.
DSCR
20% down · 8.5% · 30yr
- Down + closing
- —
- Monthly P&I
- —
- Monthly cashflow
- —
- DSCR
- —
- Eligible?
- —
No personal income docs; deal must DSCR.
Hard money
10% down · 12.0% · 12mo
- Down + closing
- —
- Monthly P&I
- —
- Monthly cashflow
- —
- DSCR
- —
- Eligible?
- —
Short-term bridge; refi at stabilization.
Rent comps 30 comps
| Address | Beds | Baths | Sqft | Rent | $/sqft | DOM | Units | Dist |
|---|---|---|---|---|---|---|---|---|
| 1016 Laney Walker Blvd Augusta, GA | 2.0 | 1.0 | 885 | $935 | $1.06 | 44d | 5 | 0.24mi |
| 1016 Laney Walker Blvd Augusta, GA | 1.0–2.0 | 1.0 | 794 | $995 | $1.25 | 23d | 4 | 0.24mi |
| 1232 12th St Unit D Augusta, GA | 2.0 | 1.0 | 800 | $1,000 | $1.25 | 44d | 1 | 0.32mi |
| 953 Hopkins St Augusta, GA | 3.0 | 1.0 | 806 | $1,100 | $1.36 | 44d | 1 | 0.34mi |
| 913 Walker St Augusta, GA | 2.0 | 2.0 | 1000 | $1,200 | $1.20 | 14d | 1 | 0.82mi |
| 1425 Lee Beard Way Augusta, GA | 1.0–2.0 | 1.0 | 776 | $1,181 | $1.52 | 44d | 1 | 0.94mi |
| 1399 Walton Way Augusta, GA | 2.0 | 2.0 | 1017 | $1,690 | $1.66 | 23d | 1 | 0.96mi |
| 505 13th St Augusta, GA | 2.0 | 2.0 | 950 | $1,122 | $1.18 | 44d | 3 | 1.01mi |
| 1480 Wrightsboro Rd Augusta, GA | 1.0–3.0 | 1.0–2.0 | 1046 | $2,375 | $2.27 | 21d | 13 | 1.05mi |
| 936 Broad St #317 Augusta, GA | 2.0 | 2.0 | 1184 | $1,600 | $1.35 | 23d | 1 | 1.09mi |
| 828 Broad St Augusta, GA | 2.0 | 1.0 | 750 | $995 | $1.33 | 23d | 1 | 1.09mi |
| 828 Broad St Unit B Augusta, GA | 2.0 | 1.0 | 750 | $995 | $1.33 | 44d | 1 | 1.09mi |
| 821 Forsythe St Augusta, GA | 2.0 | 1.0 | 754 | $895 | $1.19 | 14d | 1 | 1.10mi |
| 1030 Broad St Unit D Augusta, GA | 2.0 | 1.0 | 880 | $1,015 | $1.15 | 44d | 1 | 1.11mi |
| 1030 Broad St Unit C Augusta, GA | 2.0 | 1.0 | 900 | $1,225 | $1.36 | 23d | 1 | 1.11mi |
| 1030 Broad St Unit D Augusta, GA | 2.0 | 1.0 | 880 | $1,015 | $1.15 | 23d | 1 | 1.11mi |
| 1030 Broad St Augusta, GA | 2.0 | 1.0 | 880 | $1,225 | $1.39 | 44d | 1 | 1.11mi |
| 215 12th St Unit B Augusta, GA | 2.0 | 1.0 | 1365 | $2,100 | $1.54 | 44d | 1 | 1.12mi |
| 215 12th St Unit B Augusta, GA | 2.0 | 1.0 | 1365 | $2,100 | $1.54 | 23d | 1 | 1.12mi |
| 305 Walker St Unit A Augusta, GA | 2.0 | 1.0 | 925 | $925 | $1.00 | 23d | 1 | 1.16mi |
| 305 Walker St Unit A Augusta, GA | 2.0 | 1.0 | 925 | $925 | $1.00 | 44d | 1 | 1.16mi |
| 410 4th St Unit A Augusta, GA | 2.0 | 1.5 | 925 | $985 | $1.06 | 23d | 1 | 1.18mi |
| 320 3rd St Augusta, GA | 2.0 | 1.0 | 1117 | $1,200 | $1.07 | 44d | 1 | 1.31mi |
| 112 Telfair St Unit B Augusta, GA | 4.0 | 3.5 | 1400 | $2,000 | $1.43 | 14d | 1 | 1.40mi |
| 112 Telfair St Unit A Augusta, GA | 4.0 | 3.0 | 1400 | $2,300 | $1.64 | 14d | 1 | 1.40mi |
| 2128 Grand Blvd Augusta, GA | 3.0 | 1.0 | 1150 | $1,150 | $1.00 | 44d | 1 | 1.43mi |
| 112 3rd St Apt F Augusta, GA | 2.0 | 1.0 | 754 | $990 | $1.31 | 14d | 1 | 1.43mi |
| 204 Ellis St Augusta, GA | 2.0 | 1.0 | 1029 | $1,350 | $1.31 | 14d | 1 | 1.44mi |
| 108 3rd St Unit A Augusta, GA | 2.0 | 1.0 | 754 | $900 | $1.19 | 44d | 1 | 1.45mi |
| 108 3rd St Unit A Augusta, GA | 2.0 | 1.0 | 754 | $900 | $1.19 | 23d | 1 | 1.45mi |
Listing history 17 events
-
2026-05-11historical
-
2026-04-20status Pending
-
2026-04-20historical
-
2026-04-17historical
-
2026-04-07$149,900 Active
-
2026-04-07$149,900
-
2026-03-08historical
-
2026-02-13price $42,000
-
2026-02-11price $149,900
-
2025-09-08$149,900
-
2025-09-08$152,500 Active
-
2024-02-07soldstatus $42,000
-
2023-11-02$316,095
-
2008-07-18soldstatus $42,000 Closed
-
2008-07-18soldstatus $42,000
-
2008-04-22$42,000
-
1988-02-01soldstatus $45,000
ⓘ Source: listings_history table (triggers on properties + properties_extension) + one-shot
backfill from property_details.listing_events for pre-trigger history.
Tax reassessment forecast GA · Resets to sale price
- Current annual tax
- $1,378 · $115/mo
- Projected year-2 tax
- $1,379 · $115/mo
- Expected delta
- +$2/yr ($0/mo · 0.1%)
ⓘ Screening estimate from a state-policy table — verify with the county assessor before closing.
Climate risk First Street
- Flood 6/10 Major FEMA zone X (unshaded) · 73% chance over 30 yrs
- Wildfire 3/10 Moderate
- Heat 8/10 Severe 7 d/yr ≥108°F today · 18 d/yr by 30 yrs out
- Wind 6/10 Major 65% chance of damaging wind over 30 yrs
- Air quality 4/10 Moderate 4 unhealthy d/yr today · 4 by 30 yrs out
Nearby sold comps map
Loading sold comps map…
Walkable amenities ~0.75 mi
Loading nearby amenities…
Taxation est. · year 1
- Rental income
- $15,724
- − Mortgage interest
- −$8,397
- − Property taxes
- −$1,378
- − Insurance
- −$750
- − Repairs & maintenance
- −$1,258
- − Management
- −$1,258
- − Depreciation
- −$4,361
- Taxable loss
- −$1,676
- Est. tax savings @ 24.0%
- +$402
- After-tax cash flow
- $1,264/yr
For passive investors: Depreciation is non-cash, so a rental often shows a tax loss while cash-flowing — sheltering income. Rental losses are passive: they offset passive income freely, and up to $25,000/yr can offset ordinary (W-2) income if you actively participate and your MAGI is under $100k (phasing out to $0 by $150k); unused losses carry forward. On sale, claimed depreciation is recaptured at up to 25%, and gains may owe capital-gains tax (a 1031 exchange can defer both). Figures are a year-1 estimate at your 24.0% rate — not tax advice; consult a CPA.
Schools (NCES district)
- District
- Richmond County
- NCES district ID
- 1304380
- Math proficiency
- 12% ▼ -9.00%
- Reading proficiency
- 20% ▼ -6.00%
- Median HH income
- $38,069
- Composite
- 13.43/100
- National rank
- #9524
- State rank
- #154 of 174 in GA
Livability — Augusta-Richmond County consolidated government (balance)
No livability data for this city. (Only ~50 U.S. cities are tracked.)
Census & demographics
- Census place
- Augusta-Richmond County consolidated government (balance), GA
- County
- Richmond County · 190,917 people
- City population
- 154,035
- Metro
- Augusta-Richmond County, GA-SC
- Population (ZIP)
- 16,484
- Household income
- $25,163
- Rent vs Own
- Severe rent burden
- 2063.0
Population outlook (Richmond County) Hauer SSP2
- Today (2025)
- 200,753 people
- By 2030
- 200,232 · -0.3%
- By 2040
- 196,813 · -2.0%
- By 2050
- 190,347 · -5.2%
- By 2075
- 172,496 · -14.1%
- By 2100
- 146,284 · -27.1%
Race, ethnicity, and origin ACS 2023
- Neighborhood character
- Predominantly Black (78%)
- Race & ethnicity
- Black 78% White 15% Two or more races 4% Hispanic / Latino 2%
- Common ancestry
- Lithuanian 1% Slovak 1%
- Foreign-born
- 1% · Canada
- Languages at home
- 97% English-only · Spanish 1%
Political lean MEDSL · Richmond
- 2024 margin
- Solid D (+36.1) · D 67.8% · R 31.7%
- 2008→2024 swing
- +4.3pp toward D · 2008: 31.8pp · 2024: 36.1pp
- All cycles
- 2024: D+36.1 2020: D+37.2 2016: D+32.4 2012: D+33.8 2008: D+31.8
Not yet ingested
- Civics
- —
Market trends
- HPI YoY
- ▲ 8.18%
- Current HPI
- 206.3145
- Rent YoY
- ▼ -1.31%
- Metro
- Augusta-Richmond County, GA-SC
- State GDP YoY
- ▲ 2.66%
- F500 in state
- 28
Industry mix (Fortune 500 HQ in GA)
| Industry | F500 HQs | Revenue |
|---|---|---|
| Paper / Packaging | 2 | $29B |
|
||
| Retail | 1 | $160B |
|
||
| Transportation / Logistics | 1 | $91B |
|
||
| Airlines | 1 | $62B |
|
||
| Consumer Goods | 1 | $47B |
|
||
| Utilities | 1 | $25B |
|
||
Price history
+233.1% since first listed17 events — show timeline
- 2026-05-11 Listing Removed — Hive MLS
- 2026-04-20 Pending — Hive MLS
- 2026-04-20 Listing Removed — Hive MLS
- 2026-04-17 Listing Removed — Hive MLS
- 2026-04-07 Listed $149,900 Hive MLS
- 2026-04-07 Listed $149,900 Hive MLS
- 2026-03-08 Listing Removed — Hive MLS
- 2026-02-13 Price Changed $42,000 Hive MLS
- 2026-02-11 Price Changed $149,900 Hive MLS
- 2025-09-08 Listed $152,500 Hive MLS
- 2025-09-08 Listed $149,900 Hive MLS
- 2024-02-07 Sold (MLS) $42,000 Hive MLS
- 2023-11-02 Listed $316,095 Hive MLS
- 2008-07-18 Sold (MLS) $42,000 Hive MLS
- 2008-07-18 Sold (MLS) $42,000 Hive MLS
- 2008-04-22 Listed $42,000 Hive MLS
- 1988-02-01 Sold (Public Records) $45,000 Public Records
Property tax history
+3.6%/yrLatest (2025): $1,378 · +16.0% YoY. Source: county tax records.
Cash-flow waterfall
monthlySold comps — $/sqft
last 12 mo · ≤1 miLoading sold comps…