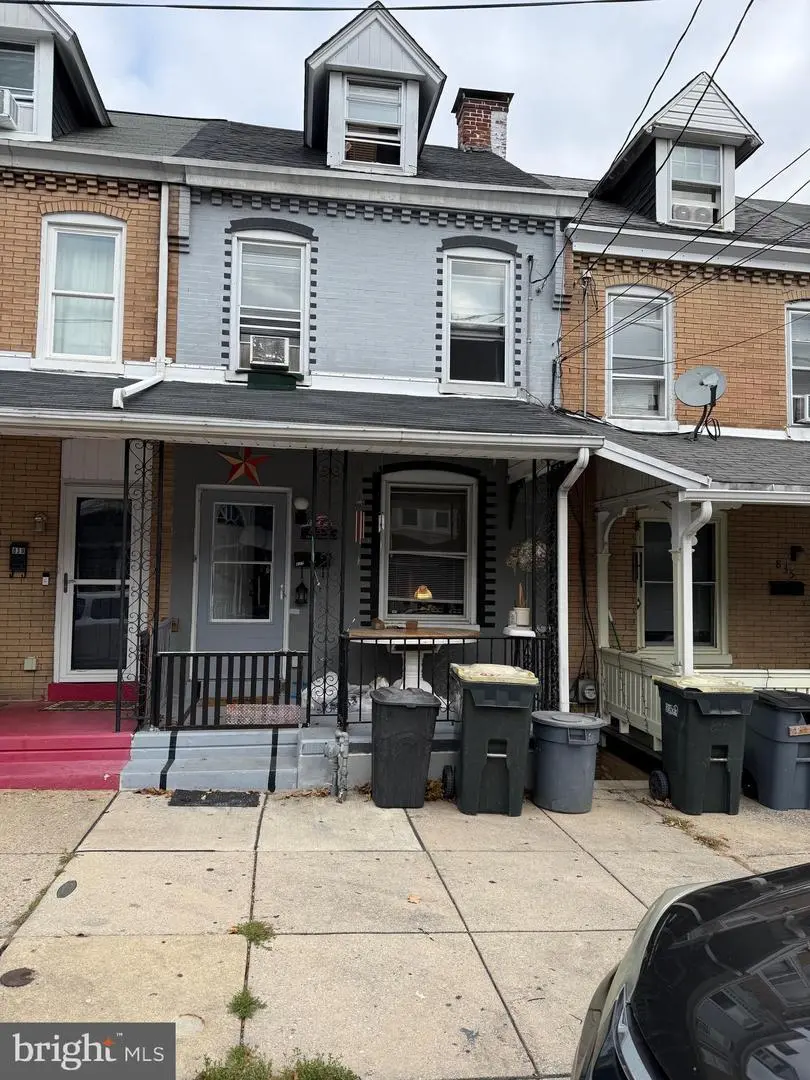
837 Prangley Ave · Lancaster, PA
Flood risk 1/10 · Minimal
- FEMA flood zone
- X (unshaded)
- Chance of flooding over 30 yrs
- 0.0%
- Est. flood insurance / yr
- $507 – $1,088
Fire risk 1/10 · Minimal
- Est. fire insurance / yr
- $511 – $949
Heat risk 6/10 · Moderate
- Hot days now (above 101°F)
- 7 days/yr
- Hot days in 30 yrs
- 15 days/yr
Wind risk 4/10 · Minor
- Chance of severe wind over 30 yrs
- 15.0%
Air-quality risk 4/10 · Minor
- Unhealthy air days now
- 4 days/yr
- Unhealthy air days in 30 yrs
- 7 days/yr
Risk factors via First Street. Map © Google.
Why this score? — see what drove the D+ grade
The composite is a weighted blend of 9 inputs, each scored 0–100. Each bar is that input's sub-score; the figure is the points it added to the 100-point composite (weight × sub-score).
- Cash flow +16.4/30.0
- ARV discount +12.9/15.0
- DSCR +5.1/10.0
- 1% rule +4.4/10.0
- Livability +4.2/5.0
- Rent growth +2.6/5.0
- Condition / age +2.5/5.0
- Schools +1.6/10.0
- Appreciation +0.0/10.0
$189,000
🖨 Deal sheet (PDF) 📄 Offer letter ✓ Due diligence
Listing remarks MLS
You’re just in time to enjoy this home and entertain family and friends w/ it’s beautiful backyard space and front porch! Freshly painted exterior, spacious bathroom and ample living space make this a great home for your family
Key facts
- Built 1920
- Listed 9 days
Neighborhood map
What this means for you Summary
Snapshot
- This is a 3-bed/1.0-bath townhouse listed at $189k.
Deal economics
- At list price, monthly cash flow is $107 ($1k/yr) — positive.
- The deal already cash-flows at list — no discount required.
- To meet the 1% rule (rent ≥ 1% of price), the offer needs to be $178k (6.0% below list).
- Recommended offer: $178k (6.0% below list) — sets the bar for 1% rule.
- Cap rate 7.0% vs local median 4.3% in Lancaster — top-decile yield for the area; either an underpriced asset or a hidden risk that comps aren't pricing in. Stress-test before assuming the spread holds.
Location & tenants
- Location reads 85/100 on livability (#71 in PA, #498 nationally) — a professional / high-income tenant draw. Strengths: amenities A+, commute A+, cost of living A+; Watch: crime C-, employment C-.
- Lancaster SD (urban): math 12% / reading 25% proficiency, ranked #500 of 539 in PA (top 93%) — low school quality limits family demand, transient renter base, plan for 1-2y turnover; 72% free/reduced lunch — lower-income household profile, screen leases tightly.
- Zoned schools: Smith-Wade-El El Sch (math 27% / reading 37%, grade F, #1,094 of 1,518 statewide, top 73%, 447 students, 100% FRL); Wheatland Ms (math 4% / reading 26%, grade F, #471 of 512 statewide, top 93%, 445 students, 93% FRL); Mccaskey Campus (math 50% / reading 34%, grade F, #230 of 437 statewide, top 53%, 2,620 students, 88% FRL) — zoned schools average 94% FRL vs 72% district-wide (21 pts higher); higher-poverty schools than district average — tighter screening recommended.
- Market conditions: Rents flat; 296 active listings in the ZIP; 37 comparable units currently listed for rent nearby; rentals at typical pace (median 23d on market — plan ~3-4 weeks tenant-placement turnaround); solid renter incomes; 1,093 units permitted in Lancaster County in 2024 (201 in 5+ unit buildings).
Forward outlook
- Local home prices are declining (-3.0%/yr); year-one equity from $1k of loan paydown is wiped out by about $6k of value loss. Plan a longer hold.
- Lancaster County population projected at +5% by 2050 — modest demand growth; plan on rents tracking national, not racing it.
Negotiation context
- Only 9 days on market — expect competitive offers; lowballing is unlikely to land.
- 4 sale attempts since 20y ago with the ask held roughly flat each time — persistent listings suggest the price (not the market) is what's stuck; bring a comps-based counter.
- Current owner paid $112k; list at $189k implies a 68% gain — meaningful room to come down on a strong offer.
Risks & watch-outs
- Watch-outs: built in 1920 — expect roof / HVAC / electrical / plumbing capex.
- Climate carrying-cost: extreme-heat days projected 7→15/yr by 2055 (HVAC capex compounding) — expect insurance premiums to compound above CPI over the hold.
Questions for the listing agent
- Built in 1920 — when were the roof, HVAC, electrical panel, plumbing, and water heater last replaced?
- Is there a deadline driving the sale (1031 exchange, divorce, estate, relocation)? That informs how much negotiation room exists.
- The area grade is low — what's the realistic commute time and amenity access for the typical tenant pool here? Any planned neighborhood developments (good or bad) we should know about?
- What's the average days-on-market for RENTAL listings here right now (not sales)? A rising rental-DOM trend means longer vacancies and softer asking-rent achievability than the comps imply.
- What's the recent tenant-quality profile in this submarket — average credit score on applications, eviction rate, late-payment / NSF rate, and stable-employment percentage? A property-management company in the area should have these aggregated.
- How much new for-sale + rental construction is in the pipeline within 1–3 miles? Heavy new supply typically softens prices + rents 12–24 months out; constrained supply supports both.
Investment metrics
- 1% rule
- 0.94% ✗
- Cap rate
- 6.97%
- Cash-on-cash
- 2.42%
- DSCR
- 1.11
- GRM
- 8.9
CMA / ARV
- ARV (on-the-fly)
- $214,863
- Comps found
- 12
Show comp detail 12 sales within ~0.75 mi
| Address | Dist | Beds/Ba | Sqft | Sold | Price | $/sf | Match |
|---|---|---|---|---|---|---|---|
| 827 3rd St | 0.13mi | 3/1.0 | 1,240 (+8%) | 2mo | $275,000 | $222 | 80 |
| 135 Old Dorwart St | 0.46mi | 3/1.0 | 1,126 (-2%) | 1mo | $140,250 | $125 | 74 |
| 635 1st St | 0.35mi | 3/1.5 | 1,208 (+5%) | 2mo | $196,000 | $162 | 72 |
| 1230 Elm Ave | 0.60mi | 3/1.0 | 1,152 (+0%) | 0mo | $254,000 | $220 | 72 |
| 616 Pearl St | 0.14mi | 4/2.0 (+1) | 1,260 (+10%) | 1mo | $202,000 | $160 | 68 |
| 738 Marietta Ave | 0.45mi | 3/1.0 | 1,061 (-8%) | 2mo | $175,000 | $165 | 64 |
| 646 1st St | 0.33mi | 4/1.0 (+1) | 1,256 (+9%) | 2mo | $244,900 | $195 | 63 |
| 813 Fremont St | 0.49mi | 3/1.5 | 1,234 (+7%) | 1mo | $231,000 | $187 | 62 |
| 679 Poplar St | 0.51mi | 3/2.0 | 1,080 (-6%) | 2mo | $235,000 | $218 | 61 |
| 841 Wabank St | 0.68mi | 3/1.5 | 1,040 (-10%) | 1mo | $206,000 | $198 | 50 |
| 420 Lafayette St | 0.65mi | 3/1.0 | 1,014 (-12%) | 2mo | $142,000 | $140 | 49 |
| 448 Fremont St | 0.75mi | 3/1.0 | 1,290 (+12%) | 1mo | $174,950 | $136 | 44 |
Match score weights: distance 35% · size 25% · config 20% · recency 20%. Top-matched comps best support the ARV.
Projected returns pro-forma
-3.0% appreciation · 0.47% rent growth · sell at horizon
- IRR
- -15.3%
- Equity multiple
- 0.47×
- Total profit
- $-28,218
- Equity at exit
- $28,181
- IRR
- -11.8%
- Equity multiple
- 0.38×
- Total profit
- $-32,936
- Equity at exit
- $16,341
Cash invested: $52,920 (down + closing). Projections, not guarantees.
Landlord ↔ Tenant lean methodology
- Overall (STATE)
- 62 Landlord-Friendly
- State Pennsylvania
- 62 Landlord-Friendly · EVEN
- County
- — inherits STATE
- City
- — inherits STATE
ZIP-level market 17603
- Rents YoY
- 0.5%
- Active inventory
- 296
- Price-to-rent
- 8.9×
Monthly cashflow live
- Estimated rent
- $1,776 high interval (Pro) →
- Mortgage (P&I)
- −$991
- Tax from tax record
- −$227 /mo · $2,719/yr
- Insurance
- −$79
- HOA
- −$0
- Vacancy / Maint / Mgmt
- −$373
- Net cashflow
- $107
Break-even live
Sensitivity live
| Price | -10% $214 | -5% $160 | +0% $107 | +5% $53 | +10% $0 |
|---|---|---|---|---|---|
| Rent | -10% $-34 | -5% $37 | +0% $107 | +5% $177 | +10% $247 |
| Rate | -1.0pp $202 | -0.5pp $155 | base $107 | +0.5pp $58 | +1.0pp $8 |
UW: 25.0% down · 7.5% · 30yr · 1.5% tax · 5.0% vac · 8.0% maint · 8.0% mgmt
Financing live
Cash to close
- Down payment
- $47,250
- Closing costs
- $5,670
- Reserves months
- —
- Total cash needed
- —
Loan-product check · same deal, 3 products live
Conventional
25% down · 7.5% · 30yr
- Down + closing
- —
- Monthly P&I
- —
- Monthly cashflow
- —
- DSCR
- —
- Eligible?
- —
Personal DTI + credit; lowest rate.
DSCR
20% down · 8.5% · 30yr
- Down + closing
- —
- Monthly P&I
- —
- Monthly cashflow
- —
- DSCR
- —
- Eligible?
- —
No personal income docs; deal must DSCR.
Hard money
10% down · 12.0% · 12mo
- Down + closing
- —
- Monthly P&I
- —
- Monthly cashflow
- —
- DSCR
- —
- Eligible?
- —
Short-term bridge; refi at stabilization.
Rent comps 37 comps
| Address | Beds | Baths | Sqft | Rent | $/sqft | DOM | Units | Dist |
|---|---|---|---|---|---|---|---|---|
| 741 Manor St Lancaster, PA | 3.0 | 1.0 | 1200 | $1,695 | $1.41 | 45d | 1 | 0.29mi |
| 40 Fairview Ave Lancaster, PA | 3.0 | 1.0 | 1152 | $1,700 | $1.48 | 15d | 1 | 0.31mi |
| 678 1/2 Columbia Ave Apt 2 Lancaster, PA | 3.0 | 1.0 | 1100 | $1,495 | $1.36 | 15d | 1 | 0.40mi |
| 14 Coral St Lancaster, PA | 3.0 | 1.5 | 1355 | $1,525 | $1.13 | 45d | 1 | 0.42mi |
| 529 Manor St Lancaster, PA | 3.0 | 1.0 | 1434 | $1,635 | $1.14 | 15d | 1 | 0.51mi |
| 27 Roselle Ave Lancaster, PA | 2.0 | 1.0 | 1128 | $1,575 | $1.40 | 45d | 1 | 0.55mi |
| 37 E Filbert St Lancaster, PA | 3.0 | 1.0 | 1002 | $1,750 | $1.75 | 45d | 1 | 0.60mi |
| 1415 Spencer Ave Lancaster, PA | 1.0–3.0 | 1.0–2.0 | 1181 | $3,720 | $3.15 | 15d | 1 | 0.61mi |
| 135 Grandview Ave Lancaster, PA | 3.0 | 2.0 | 1395 | $3,295 | $2.36 | 15d | 1 | 0.63mi |
| 513 Poplar St Lancaster, PA | 3.0 | 1.5 | 1184 | $1,695 | $1.43 | 45d | 1 | 0.66mi |
| 324 New Dorwart St Lancaster, PA | 3.0 | 1.0 | 1020 | $1,495 | $1.47 | 15d | 1 | 0.67mi |
| 1127 Wabank St Lancaster, PA | 1.0–2.0 | 1.0 | 760 | $1,650 | $2.17 | 25d | 1 | 0.70mi |
| 101 Roselawn Ave Lancaster, PA | 3.0 | 2.0 | 1166 | $1,785 | $1.53 | 15d | 1 | 0.70mi |
| 480 Euclid Ave Lancaster, PA | 1.0–2.0 | 1.0–1.5 | 830 | $1,695 | $2.04 | 45d | 1 | 0.76mi |
| 214 W Strawberry St Lancaster, PA | 3.0 | 1.0 | 1175 | $1,345 | $1.14 | 23d | 1 | 0.78mi |
| 422 Hillside Ave Lancaster, PA | 2.0 | 1.0 | 960 | $1,245 | $1.30 | 45d | 1 | 0.79mi |
| 433 W Walnut St Apt 2 Lancaster, PA | 2.0 | 1.0 | 900 | $1,840 | $2.04 | 25d | 1 | 0.80mi |
| 1115 Marietta Ave Unit WH15037 Lancaster, PA | 2.0 | 2.0 | 1298 | $1,695 | $1.31 | 45d | 1 | 0.82mi |
| 128 N Mulberry St Unit 1 Lancaster, PA | 2.0 | 2.0 | 1500 | $2,250 | $1.50 | 25d | 1 | 0.82mi |
| 1633A Judie Ln Lancaster, PA | 1.0–2.0 | 1.0–2.0 | 848 | $1,698 | $2.00 | 15d | 13 | 0.87mi |
| 118 N Prince St Lancaster, PA | 1.0–3.0 | 1.0–3.0 | 1274 | $4,703 | $3.69 | 15d | 48 | 0.95mi |
| 404 Beaver St Lancaster, PA | 3.0 | 1.0 | 1025 | $1,425 | $1.39 | 25d | 1 | 0.98mi |
| 345 1/2 Beaver St Lancaster, PA | 4.0 | 1.0 | 1382 | $2,095 | $1.52 | 45d | 1 | 0.98mi |
| 519 1/2 S Prince St Lancaster, PA | 2.0 | 1.0 | 848 | $1,550 | $1.83 | 15d | 1 | 1.01mi |
| 549 Howard Ave Lancaster, PA | 4.0 | 1.0 | 1439 | $1,700 | $1.18 | 45d | 1 | 1.05mi |
| 202 N Queen St Lancaster, PA | 2.0 | 1.0–2.0 | 697 | $2,718 | $3.90 | 15d | 12 | 1.09mi |
| 250 Stone Mill Rd Lancaster, PA | 1.0–3.0 | 1.0 | 1002 | $1,575 | $1.57 | 15d | 1 | 1.09mi |
| 1330 Wabank Rd Lancaster, PA | 1.0–3.0 | 1.0–2.5 | 1423 | $2,062 | $1.45 | 15d | 21 | 1.12mi |
| 425 N Prince St Apt 206 Lancaster, PA | 2.0 | 2.0 | 1138 | $1,995 | $1.75 | 45d | 1 | 1.16mi |
| 537 Woodward St Lancaster, PA | 3.0 | 2.0 | 1288 | $1,650 | $1.28 | 25d | 1 | 1.24mi |
| 850 Highland Ave Lancaster, PA | 2.0 | 1.0 | 1000 | $1,300 | $1.30 | 23d | 1 | 1.27mi |
| 225 E King St Unit 2 Lancaster, PA | 2.0 | 2.5 | 1075 | $2,600 | $2.42 | 45d | 1 | 1.31mi |
| 225 E King St Unit 1 Lancaster, PA | 2.0 | 1.0 | 957 | $1,950 | $2.04 | 15d | 1 | 1.31mi |
| 204 Elmshire Dr Lancaster, PA | 3.0 | 2.5 | 1364 | $1,595 | $1.17 | 46d | 1 | 1.32mi |
| 816 N Prince St Lancaster, PA | 1.0–2.0 | 1.0–2.0 | 794 | $2,195 | $2.76 | 15d | 7 | 1.34mi |
| 1013 Willow Street Pike Lancaster, PA | 2.0 | 1.0 | 1144 | $1,499 | $1.31 | 15d | 1 | 1.41mi |
| 231 N Shippen St #224 Lancaster, PA | 2.0 | 2.0 | 1155 | $2,285 | $1.98 | 15d | 1 | 1.45mi |
Listing history 12 events
-
2026-04-23status Pending
-
2026-04-14$189,000 Active
-
2025-06-02historical
-
2025-05-19$195,000 Active
-
2021-08-19soldstatus $112,500
-
2021-07-30soldstatus $112,500 Closed 239-char remark
Show marketing remark (239 chars)
You’re just in time to enjoy this home and entertain family and friends w/ it’s beautiful backyard space and front porch! Freshly painted exterior, spacious bathroom and ample living space make this a great home for your family
-
2021-07-12status Pending 239-char remark
Show marketing remark (239 chars)
You’re just in time to enjoy this home and entertain family and friends w/ it’s beautiful backyard space and front porch! Freshly painted exterior, spacious bathroom and ample living space make this a great home for your family
-
2021-07-06$119,900 Active 239-char remark
Show marketing remark (239 chars)
You’re just in time to enjoy this home and entertain family and friends w/ it’s beautiful backyard space and front porch! Freshly painted exterior, spacious bathroom and ample living space make this a great home for your family
-
2006-07-27soldstatus $72,000
-
2006-07-24soldstatus $72,000
-
2006-06-16historical
-
2006-05-16$69,900
ⓘ Source: listings_history table (triggers on properties + properties_extension) + one-shot
backfill from property_details.listing_events for pre-trigger history.
Tax reassessment forecast PA · Partial reset (capped growth)
- Current annual tax
- $2,719 · $227/mo
- Projected year-2 tax
- $2,852 · $238/mo
- Expected delta
- +$134/yr (+$11/mo · 4.9%)
ⓘ Screening estimate from a state-policy table — verify with the county assessor before closing.
Climate risk First Street
- Flood 1/10 Low FEMA zone X (unshaded) · 0% chance over 30 yrs
- Wildfire 1/10 Low
- Heat 6/10 Major 7 d/yr ≥101°F today · 15 d/yr by 30 yrs out
- Wind 4/10 Moderate 15% chance of damaging wind over 30 yrs
- Air quality 4/10 Moderate 4 unhealthy d/yr today · 7 by 30 yrs out
Nearby sold comps map
Loading sold comps map…
Walkable amenities ~0.75 mi
Loading nearby amenities…
Taxation est. · year 1
- Rental income
- $21,314
- − Mortgage interest
- −$10,587
- − Property taxes
- −$2,719
- − Insurance
- −$945
- − Repairs & maintenance
- −$1,705
- − Management
- −$1,705
- − Depreciation
- −$5,498
- Taxable loss
- −$1,845
- Est. tax savings @ 24.0%
- +$443
- After-tax cash flow
- $1,724/yr
For passive investors: Depreciation is non-cash, so a rental often shows a tax loss while cash-flowing — sheltering income. Rental losses are passive: they offset passive income freely, and up to $25,000/yr can offset ordinary (W-2) income if you actively participate and your MAGI is under $100k (phasing out to $0 by $150k); unused losses carry forward. On sale, claimed depreciation is recaptured at up to 25%, and gains may owe capital-gains tax (a 1031 exchange can defer both). Figures are a year-1 estimate at your 24.0% rate — not tax advice; consult a CPA.
Schools (NCES district)
- District
- Lancaster SD
- NCES district ID
- 4213140
- Math proficiency
- 12% ▼ -10.00%
- Reading proficiency
- 25% ▼ -13.00%
- Median HH income
- $38,500
- Composite
- 15.52/100
- National rank
- #9301
- State rank
- #500 of 539 in PA
Livability — Lancaster
- Score
- 85/100
- State rank
- #71
- US rank
- #498
Category grades
Schools grade is shown separately in the Schools card above.
Census & demographics
- Census place
- Lancaster, PA
- County
- Lancaster County · 390,309 people
- City population
- 176,170
- Metro
- Lancaster, PA
- Population (ZIP)
- 67,571
- Household income
- $77,084
- Rent vs Own
- Severe rent burden
- 2557.0
Population outlook (Lancaster County) Hauer SSP2
- Today (2025)
- 561,011 people
- By 2030
- 570,969 · +1.8%
- By 2040
- 585,929 · +4.4%
- By 2050
- 591,056 · +5.4%
- By 2075
- 594,747 · +6.0%
- By 2100
- 558,850 · -0.4%
Race, ethnicity, and origin ACS 2023
- Neighborhood character
- Diverse neighborhood (Simpson 0.59)
- Race & ethnicity
- White 58% Hispanic / Latino 27% Two or more races 12% Black 7% Asian 4%
- Hispanic origin (detail)
- Mexican 1% Puerto Rican 19% Cuban 1% Dominican 2%
- Common ancestry
- Romanian 2% Slovak 2% Lithuanian 1%
- Foreign-born
- 9% · Canada, China, India
- Languages at home
- 77% English-only · Spanish 17% Other Indo-European 1% Chinese 1%
Political lean MEDSL · Lancaster
- 2024 margin
- R (+15.9) · D 41.5% · R 57.5%
- 2008→2024 swing
- -4.1pp toward R · 2008: -11.8pp · 2024: -15.9pp
- All cycles
- 2024: R+15.9 2020: R+15.8 2016: R+19.7 2012: R+19.2 2008: R+11.8
Not yet ingested
- Civics
- —
Market trends
- HPI YoY
- ▼ -508.78%
- Current HPI
- 289.3324
- Rent YoY
- ▲ 0.47%
- Metro
- Lancaster, PA
- State GDP YoY
- ▲ 1.68%
- F500 in state
- 34
Industry mix (Fortune 500 HQ in PA)
| Industry | F500 HQs | Revenue |
|---|---|---|
| Healthcare | 2 | $309B |
|
||
| Insurance | 2 | $27B |
|
||
| Telecommunications / Media | 1 | $124B |
|
||
| Industrial Distribution | 1 | $22B |
|
||
| Financial Services | 1 | $20B |
|
||
| Chemicals / Materials | 1 | $18B |
|
||
Price history
+170.4% since first listed12 events — show timeline
- 2026-04-23 Pending — BRIGHT MLS
- 2026-04-14 Listed $189,000 BRIGHT MLS
- 2025-06-02 Listing Removed — BRIGHT MLS
- 2025-05-19 Listed $195,000 BRIGHT MLS
- 2021-08-19 Sold (Public Records) $112,500 Public Records
- 2021-07-30 Sold (MLS) $112,500 BRIGHT MLS
- 2021-07-12 Pending — BRIGHT MLS
- 2021-07-06 Listed $119,900 BRIGHT MLS
- 2006-07-27 Sold (Public Records) $72,000 Public Records
- 2006-07-24 Sold (MLS) $72,000 BRIGHT MLS
- 2006-06-16 Listing Removed — BRIGHT MLS
- 2006-05-16 Listed $69,900 BRIGHT MLS
Property tax history
+0.5%/yrLatest (2026): $2,719 · +3.3% YoY. Source: county tax records.
Cash-flow waterfall
monthlySold comps — $/sqft
last 12 mo · ≤1 miLoading sold comps…