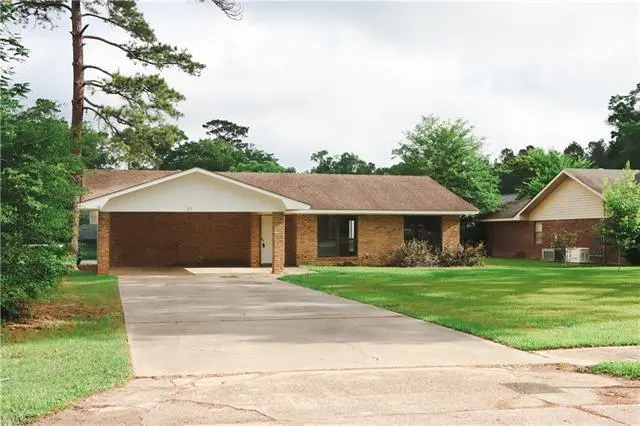
1512 Lisa Lane Ln · Oakdale, LA
Flood risk No data
- FEMA flood zone
- —
- Chance of flooding over 30 yrs
- —
- Est. flood insurance / yr
- —
Fire risk No data
- Est. fire insurance / yr
- —
Heat risk No data
- Hot days now (above threshold)
- —
- Hot days in 30 yrs
- —
Wind risk No data
- Chance of severe wind over 30 yrs
- —
Air-quality risk No data
- Unhealthy air days now
- —
- Unhealthy air days in 30 yrs
- —
Risk factors via First Street. Map © Google.
Why this score? — see what drove the C- grade
The composite is a weighted blend of 9 inputs, each scored 0–100. Each bar is that input's sub-score; the figure is the points it added to the 100-point composite (weight × sub-score).
- Cash flow +17.7/30.0
- DSCR +5.5/10.0
- ARV discount +5.5/15.0
- Appreciation +5.5/10.0
- 1% rule +4.8/10.0
- Condition / age +3.8/5.0
- Livability +3.5/5.0
- Schools +2.8/10.0
- Rent growth +2.5/5.0
$135,000
🖨 Deal sheet 📄 Offer letter ✓ Due diligence
Listing remarks
This 3 bedroom, 2 bath brick home offers approximately 1,615 sq. ft. of living space in an excellent neighborhood. The layout features vinyl and laminate flooring throughout. Recently updated! New paint, lighting, and more! Outside, you'll find a large backyard along with a two-car carport for parking. The home is equipped with central A/C and heating.
Key facts
- 0.35 acre lot
- Parking
- Built 1980
Property features AI
Exterior
- Parking: Carport
- Home design: Single family residence
- Construction: Brick construction; Composition roof
- Exterior features: Composition roof; Brick construction
Interior
- Kitchen: Kitchen (appliances not specified)
- Bedrooms: Bedroom 1 (level not specified); Bedroom 2 (level not specified)
- Bathrooms: 2 full bathrooms
- Heating & cooling: Central heating; Central air conditioning
- Interior features: Living room; Dining room; Kitchen; Bathroom 1
Neighborhood map
What this means for you Summary
Snapshot
- This is a 3-bed/2.0-bath single-family listed at $135k. Condition is rated good.
Deal economics
- At list price, monthly cash flow is $109 ($1k/yr) — positive.
- The deal already cash-flows at list — no discount required.
- To meet the 1% rule (rent ≥ 1% of price), the offer needs to be $132k (2.3% below list).
- Recommended offer: $132k (2.3% below list) — sets the bar for 1% rule.
Location & tenants
- Location reads 70/100 on livability (#55 in LA) — a middle-class / working-renter tenant base. Strengths: cost of living A+, housing A+, health & safety A+; Watch: crime F, amenities F, commute F.
- Allen Parish (rural): math 26% / reading 42% proficiency, ranked #36 of 98 in LA (top 37%) — families likely to look elsewhere, expect single-tenant / working-renter base with shorter leases.
- Market conditions: 23 active listings in the ZIP; 46 units permitted in Allen Parish in 2024 (0 in 5+ unit buildings).
Forward outlook
- In year one you build about $2k of equity ($933 loan paydown + $1k appreciation (1.0% local appreciation)).
- Allen County population projected to shrink 8% by 2050 — rents likely to lag national; underwrite the cash flow, not the appreciation.
- At projected returns (1.0% appreciation + 3.0% rent growth), your $38k cash investment doubles in ~8 years — after that, you're playing with house money.
Negotiation context
- Only 10 days on market — expect competitive offers; lowballing is unlikely to land.
- 2 sale attempts with the ask held roughly flat each time — persistent listings suggest the price (not the market) is what's stuck; bring a comps-based counter.
Questions for the listing agent
- Is there a deadline driving the sale (1031 exchange, divorce, estate, relocation)? That informs how much negotiation room exists.
- Schools are B-rated — typically a magnet for longer-tenancy family renters. What's the average tenant stay here, and is there a school-zone premium baked into asking?
- Crime grade is F in this area — have there been break-ins, vandalism, or insurance claims at this property in the last 3 years? What carrier currently insures it and at what premium?
- What's the average days-on-market for RENTAL listings here right now (not sales)? A rising rental-DOM trend means longer vacancies and softer asking-rent achievability than the comps imply.
- What's the recent tenant-quality profile in this submarket — average credit score on applications, eviction rate, late-payment / NSF rate, and stable-employment percentage? A property-management company in the area should have these aggregated.
- How much new for-sale + rental construction is in the pipeline within 1–3 miles? Heavy new supply typically softens prices + rents 12–24 months out; constrained supply supports both.
Investment metrics
- 1% rule
- 0.98% ✗
- Cap rate
- 7.26%
- Cash-on-cash
- 3.46%
- DSCR
- 1.15
- GRM
- 8.5
CMA / ARV
- ARV (on-the-fly)
- $129,200
- Comps found
- 3
Show comp detail 3 sales within ~0.75 mi
| Address | Dist | Beds/Ba | Sqft | Sold | Price | $/sf | Match |
|---|---|---|---|---|---|---|---|
| 1512 Lisa Lane Ln | 0.00mi | 3/2.0 | 1,615 (0%) | 1mo | $129,000 | $80 | 99 |
| 1510 W Lisa Ln | 0.02mi | 3/1.0 | 1,573 (-3%) | 4mo | $125,000 | $79 | 87 |
| 402 Harmony Dr | 0.58mi | 3/1.5 | 1,600 (-1%) | 9mo | $130,000 | $81 | 62 |
Match score weights: distance 35% · size 25% · config 20% · recency 20%. Top-matched comps best support the ARV.
Projected returns pro-forma
1.02% appreciation · 3.0% rent growth · sell at horizon
- IRR
- 5.0%
- Equity multiple
- 1.25×
- Total profit
- $9,635
- Equity at exit
- $46,243
- IRR
- 9.3%
- Equity multiple
- 2.14×
- Total profit
- $42,943
- Equity at exit
- $61,574
Cash invested: $37,800 (down + closing). Projections, not guarantees.
Landlord ↔ Tenant lean methodology
- Overall (STATE)
- 90 Strongly Landlord-Friendly
- State Louisiana
- 90 Strongly Landlord-Friendly · R+12
- County
- — inherits STATE
- City
- — inherits STATE
ZIP-level market 71463
- Home prices YoY
- 1.1%
- Active inventory
- 23
- Price-to-rent
- 8.5×
Monthly cashflow live
- Estimated rent
- $1,319 medium interval (Pro) →
- Mortgage (P&I)
- −$708
- Tax est. 1.5%
- −$169 /mo · $2,025/yr
- Insurance
- −$56
- HOA
- −$0
- Vacancy / Maint / Mgmt
- −$277
- Net cashflow
- $109
Break-even live
UW: 25.0% down · 7.5% · 30yr · 1.5% tax · 5.0% vac · 8.0% maint · 8.0% mgmt
Financing live
Cash to close
- Down payment
- $33,750
- Closing costs
- $4,050
- Reserves months
- —
- Total cash needed
- —
Loan-product check · same deal, 3 products live
Conventional
25% down · 7.5% · 30yr
- Down + closing
- —
- Monthly P&I
- —
- Monthly cashflow
- —
- DSCR
- —
- Eligible?
- —
Personal DTI + credit; lowest rate.
DSCR
20% down · 8.5% · 30yr
- Down + closing
- —
- Monthly P&I
- —
- Monthly cashflow
- —
- DSCR
- —
- Eligible?
- —
No personal income docs; deal must DSCR.
Hard money
10% down · 12.0% · 12mo
- Down + closing
- —
- Monthly P&I
- —
- Monthly cashflow
- —
- DSCR
- —
- Eligible?
- —
Short-term bridge; refi at stabilization.
Listing history 4 events
-
2026-05-04status Pending
-
2026-04-25price $135,000
-
2026-04-24$135,000 Active
-
2026-01-06$120,000 Active
ⓘ Source: listings_history table (triggers on properties + properties_extension) + one-shot
backfill from property_details.listing_events for pre-trigger history.
Nearby sold comps map
Loading sold comps map…
Walkable amenities ~0.75 mi
Loading nearby amenities…
Taxation est. · year 1
- Rental income
- $15,827
- − Mortgage interest
- −$7,562
- − Property taxes
- −$2,025
- − Insurance
- −$675
- − Repairs & maintenance
- −$1,266
- − Management
- −$1,266
- − Depreciation
- −$3,927
- Taxable loss
- −$894
- Est. tax savings @ 24.0%
- +$215
- After-tax cash flow
- $1,523/yr
For passive investors: Depreciation is non-cash, so a rental often shows a tax loss while cash-flowing — sheltering income. Rental losses are passive: they offset passive income freely, and up to $25,000/yr can offset ordinary (W-2) income if you actively participate and your MAGI is under $100k (phasing out to $0 by $150k); unused losses carry forward. On sale, claimed depreciation is recaptured at up to 25%, and gains may owe capital-gains tax (a 1031 exchange can defer both). Figures are a year-1 estimate at your 24.0% rate — not tax advice; consult a CPA.
Condition & rehab AI · 12 photos
This 3-bedroom, 2-bath brick home is in good condition with recently updated paint and lighting. The laminate flooring and neutral paint make it move-in ready, but painting the exterior and replacing the flooring can further enhance its value.
Value-add opportunities
- Both Paint the exterior and interior walls — Painting can improve the curb appeal and interior aesthetics, making the home more attractive to potential buyers and renters.
- Both Replace the flooring — Replacing the laminate flooring with hardwood or tile can increase the home's value and appeal to a wider range of buyers.
Renovation cost estimate screening
Value-add ROI direction
- Both Paint the exterior and interior walls — Painting can improve the curb appeal and interior aesthetics, making the home more attractive to potential buyers and renters. ↑
- Both Replace the flooring — Replacing the laminate flooring with hardwood or tile can increase the home's value and appeal to a wider range of buyers. ↑
ⓘ Cost ranges are severity-bucket heuristics (US national rule-of-thumb). Get contractor quotes + a written scope before underwriting a rehab budget.
Schools (NCES district)
- District
- Allen Parish
- NCES district ID
- 2200060
- Math proficiency
- 26% ▼ -46.00%
- Reading proficiency
- 42% ▼ -39.00%
- Median HH income
- $39,440
- Composite
- 28.45/100
- National rank
- #6751
- State rank
- #36 of 98 in LA
Livability — Oakdale
- Score
- 70/100
- State rank
- #55
- US rank
- #7566
Category grades
Schools grade is shown separately in the Schools card above.
Census & demographics
- Census place
- Oakdale, LA
- City population
- 9,007
- Population (ZIP)
- 9,007
Population outlook (Allen County) Hauer SSP2
- Today (2025)
- 25,056 people
- By 2030
- 24,668 · -1.5%
- By 2040
- 23,964 · -4.4%
- By 2050
- 23,166 · -7.5%
- By 2075
- 21,285 · -15.1%
- By 2100
- 15,904 · -36.5%
Race, ethnicity, and origin ACS 2023
- Neighborhood character
- Diverse neighborhood (Simpson 0.64)
- Race & ethnicity
- White 54% Black 22% Hispanic / Latino 15% Two or more races 10%
- Hispanic origin (detail)
- Mexican 5%
- Common ancestry
- Lithuanian 10% Slovak 2% Russian 1%
- Foreign-born
- 12% · Canada, Jamaica
- Languages at home
- 83% English-only · Spanish 13% French/Haitian/Cajun 3%
Political lean MEDSL · Allen
- 2024 margin
- Solid R (+61.0) · D 19.0% · R 80.0%
- 2008→2024 swing
- -24.7pp toward R · 2008: -36.4pp · 2024: -61.0pp
- All cycles
- 2024: R+61.0 2020: R+55.7 2016: R+51.5 2012: R+41.7 2008: R+36.4
Not yet ingested
- Civics
- —
Market trends
- HPI YoY
- ▲ 1.02%
- Current HPI
- 93.1157
- Rent YoY
- —
- Metro
- —
- State GDP YoY
- ▲ 3.29%
- F500 in state
- 10
Industry mix (Fortune 500 HQ in LA)
| Industry | F500 HQs | Revenue |
|---|---|---|
| Telecommunications | 2 | $23B |
|
||
| Utilities | 1 | $12B |
|
||
| Wholesale / Distribution | 1 | $5B |
|
||
| Advertising | 1 | $2B |
|
||
Price history
+12.5% since first listed4 events — show timeline
- 2026-05-04 Pending — AcadianaMLS
- 2026-04-25 Price Changed $135,000 AcadianaMLS
- 2026-04-24 Listed $135,000 AcadianaMLS
- 2026-01-06 Listed $120,000 AcadianaMLS
Cash-flow waterfall
monthlySold comps — $/sqft
last 12 mo · ≤1 miLoading sold comps…