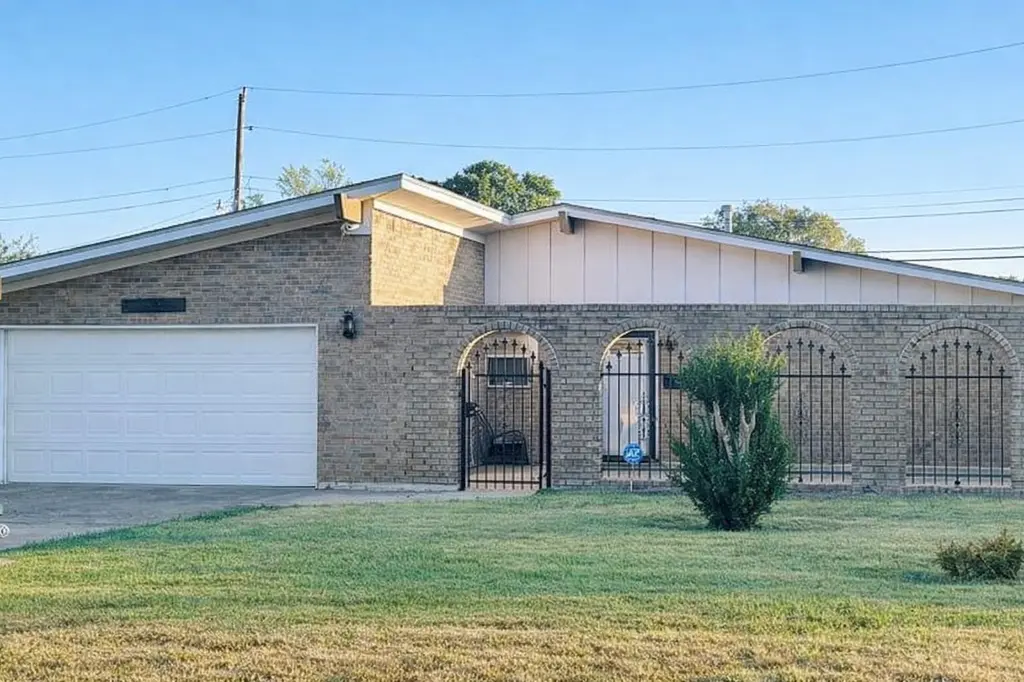
1895 Lucille St · Beaumont, TX
Flood risk 4/10 · Minor
- FEMA flood zone
- X
- Chance of flooding over 30 yrs
- 0.22%
- Est. flood insurance / yr
- $507 – $1,088
Fire risk 1/10 · Minimal
- Est. fire insurance / yr
- $1,222 – $2,270
Heat risk 9/10 · Severe
- Hot days now (above 109°F)
- 7 days/yr
- Hot days in 30 yrs
- 24 days/yr
Wind risk 9/10 · Severe
- Chance of severe wind over 30 yrs
- 99.0%
Air-quality risk 2/10 · Minimal
- Unhealthy air days now
- 1 days/yr
- Unhealthy air days in 30 yrs
- 1 days/yr
Risk factors via First Street. Map © Google.
Why this score? — see what drove the C grade
The composite is a weighted blend of 9 inputs, each scored 0–100. Each bar is that input's sub-score; the figure is the points it added to the 100-point composite (weight × sub-score).
- Cash flow +21.6/30.0
- ARV discount +11.7/15.0
- 1% rule +7.1/10.0
- DSCR +6.9/10.0
- Livability +3.2/5.0
- Rent growth +2.5/5.0
- Condition / age +2.5/5.0
- Schools +1.5/10.0
- Appreciation +0.0/10.0
$129,900
🖨 Deal sheet 📄 Offer letter ✓ Due diligence
Listing remarks MLS
Investor Opportunity: Spacious 4-Bdrm. Home with Great Potential. Discover possibilities with this cozy 4-Bdrm, 2-Bth home with 2-car garage, nestled in a Quiet Neighborhood. This Estate Property has exceptional potential for Investors or Homeowners alike—whether you're planning to renovate and flip, generate Rental income, or Design Your Dream Home. Enjoy natural light from the Atrium-Style Sunroom, creating a warm and inviting atmosphere. The front Gated Patio provides the perfect spot for morning coffee or relaxing evening drinks. 4th Bdrm. can serve as a Home Office or Guest Space. The HVAC system has been Upgraded with One year warranty. This property is being sold as-is, FOR CASH and Possible Conventional Financing options available. Don’t miss out on this versatile investment opportunity!
Key facts
- 0.29 acre lot
- 2 garage spots
- Listed 67 days
Neighborhood map
What this means for you Summary
Snapshot
- This is a 4-bed/2.0-bath single-family listed at $130k.
Deal economics
- At list price, monthly cash flow is $198 ($2k/yr) — positive.
- The deal already cash-flows at list — no discount required.
- Meets the 1% rule at list price ($2k rent vs $130k).
- Recommended offer: $122k (6.0% below list) — sets the bar for market timing.
- Cap rate 8.1% vs local median 5.3% in Beaumont — top-decile yield for the area; either an underpriced asset or a hidden risk that comps aren't pricing in. Stress-test before assuming the spread holds.
Location & tenants
- Location reads 64/100 on livability (#739 in TX) — a middle-class / working-renter tenant base. Strengths: cost of living A+, housing A+, health & safety A+; Watch: employment D, schools D-, crime F.
- Beaumont ISD (urban): math 14% / reading 22% proficiency, ranked #789 of 826 in TX (top 96%) — low school quality limits family demand, transient renter base, plan for 1-2y turnover; 69% free/reduced lunch — lower-income household profile, screen leases tightly.
- Market conditions: 207 active listings in the ZIP; 8 comparable units currently listed for rent nearby; rentals lingering (median 44d on market — plan ~5-8 weeks vacancy on turnover, expect pricing pressure); 50% of comp listings sitting > 30 days — soft ceiling on asking rent; 343 units permitted in Jefferson County in 2024 (0 in 5+ unit buildings).
- This rent runs 35% of the median local income ($55k/yr) — at the standard rent-burdened threshold; future hikes will face affordability resistance.
Forward outlook
- Local home prices are declining (-3.0%/yr); year-one equity from $898 of loan paydown is wiped out by about $4k of value loss. Plan a longer hold.
Negotiation context
- It's been on market 67 days — a 6% lower offer ($122k) is reasonable based on typical stale-listing flexibility.
- 4 sale attempts since 2y ago with the ask held roughly flat each time — persistent listings suggest the price (not the market) is what's stuck; bring a comps-based counter.
Risks & watch-outs
- Watch-outs: property tax is 2.9% of price.
- Climate carrying-cost: severe wind risk, 99% chance of damaging wind over 30y; extreme-heat days projected 7→24/yr by 2055 (HVAC capex compounding) — expect insurance premiums to compound above CPI over the hold.
Questions for the listing agent
- It's been on market 67 days. Have you received any prior offers? Is the seller open to a 6% concession, seller financing, or rate buy-down credit?
- Built in 1968 — when were the roof, HVAC, electrical panel, plumbing, and water heater last replaced?
- Property tax is high relative to price — has the assessment been appealed recently, and will the sale trigger a re-assessment?
- Why hasn't it sold? Are there any deal-killer items the seller is aware of (foundation, flood, title, zoning, code violations)?
- Is there a deadline driving the sale (1031 exchange, divorce, estate, relocation)? That informs how much negotiation room exists.
- Schools are D-rated, which usually means shorter tenancies and higher turnover. Who's the typical renter profile here, and what's been the actual vacancy rate?
- Crime grade is F in this area — have there been break-ins, vandalism, or insurance claims at this property in the last 3 years? What carrier currently insures it and at what premium?
- What's the average days-on-market for RENTAL listings here right now (not sales)? A rising rental-DOM trend means longer vacancies and softer asking-rent achievability than the comps imply.
- What's the recent tenant-quality profile in this submarket — average credit score on applications, eviction rate, late-payment / NSF rate, and stable-employment percentage? A property-management company in the area should have these aggregated.
- How much new for-sale + rental construction is in the pipeline within 1–3 miles? Heavy new supply typically softens prices + rents 12–24 months out; constrained supply supports both.
Investment metrics
- 1% rule
- 1.21% ✓
- Cap rate
- 8.12%
- Cash-on-cash
- 6.53%
- DSCR
- 1.29
- GRM
- 6.9
CMA / ARV
- ARV (median comp)
- $143,146
- List price
- $129,900
- Delta
- -9.25%
- Verdict
- FAIR
- Comps
- 20 within 1.0 mi
Show comp detail 2 sales within ~0.75 mi
| Address | Dist | Beds/Ba | Sqft | Sold | Price | $/sf | Match |
|---|---|---|---|---|---|---|---|
| 1870 Rena St | 0.03mi | 4/2.5 | 2,280 (+15%) | 6mo | $190,000 | $83 | 66 |
| 4740 Cornell Dr | 0.39mi | 3/2.0 (-1) | 1,686 (-15%) | 6mo | $169,999 | $101 | 47 |
Match score weights: distance 35% · size 25% · config 20% · recency 20%. Top-matched comps best support the ARV.
Projected returns pro-forma
-3.0% appreciation · 3.0% rent growth · sell at horizon
- IRR
- -6.2%
- Equity multiple
- 0.77×
- Total profit
- $-8,329
- Equity at exit
- $19,369
- IRR
- 3.6%
- Equity multiple
- 1.26×
- Total profit
- $9,448
- Equity at exit
- $11,231
Cash invested: $36,372 (down + closing). Projections, not guarantees.
Landlord ↔ Tenant lean methodology
- Overall (STATE)
- 87 Strongly Landlord-Friendly
- State Texas
- 87 Strongly Landlord-Friendly · R+5
- County
- — inherits STATE
- City
- — inherits STATE
ZIP-level market 77705
- Home prices YoY
- -29.7%
- Active inventory
- 207
- Price-to-rent
- 6.9×
Monthly cashflow live
- Estimated rent
- $1,577 high interval (Pro) →
- Mortgage (P&I)
- −$681
- Tax from tax record
- −$312 /mo · $3,747/yr
- Insurance
- −$54
- HOA
- −$0
- Vacancy / Maint / Mgmt
- −$331
- Net cashflow
- $198
Break-even live
UW: 25.0% down · 7.5% · 30yr · 1.5% tax · 5.0% vac · 8.0% maint · 8.0% mgmt
Financing live
Cash to close
- Down payment
- $32,475
- Closing costs
- $3,897
- Reserves months
- —
- Total cash needed
- —
Loan-product check · same deal, 3 products live
Conventional
25% down · 7.5% · 30yr
- Down + closing
- —
- Monthly P&I
- —
- Monthly cashflow
- —
- DSCR
- —
- Eligible?
- —
Personal DTI + credit; lowest rate.
DSCR
20% down · 8.5% · 30yr
- Down + closing
- —
- Monthly P&I
- —
- Monthly cashflow
- —
- DSCR
- —
- Eligible?
- —
No personal income docs; deal must DSCR.
Hard money
10% down · 12.0% · 12mo
- Down + closing
- —
- Monthly P&I
- —
- Monthly cashflow
- —
- DSCR
- —
- Eligible?
- —
Short-term bridge; refi at stabilization.
Rent comps 8 comps
| Address | Beds | Baths | Sqft | Rent | $/sqft | DOM | Units | Dist |
|---|---|---|---|---|---|---|---|---|
| 4404 Raven St Beaumont, TX | 4.0 | 2.0 | 1628 | $1,600 | $0.98 | 23d | 1 | 0.08mi |
| 4090 Lou St Beaumont, TX | 3.0 | 2.0 | 1281 | $1,675 | $1.31 | 43d | 1 | 0.35mi |
| 4455 S 5th St Beaumont, TX | 3.0 | 2.0 | 1437 | $1,500 | $1.04 | 13d | 1 | 0.82mi |
| 1211 Washington Blvd Beaumont, TX | 3.0 | 1.0 | 1363 | $1,200 | $0.88 | 43d | 1 | 0.90mi |
| 365 E Irby St Beaumont, TX | 3.0 | 2.0 | 1281 | $1,495 | $1.17 | 23d | 1 | 1.21mi |
| 4210 Sullivan St Beaumont, TX | 3.0 | 1.0 | 1540 | $1,300 | $0.84 | 43d | 1 | 1.22mi |
| 614 Euclid St Beaumont, TX | 4.0 | 2.0 | 1378 | $1,395 | $1.01 | 23d | 1 | 1.24mi |
| 4020 Howard St Beaumont, TX | 3.0 | 2.0 | 1300 | $975 | $0.75 | 43d | 1 | 1.31mi |
Listing history 28 events
-
2026-06-02status $129,900 Pending 67 DOM
-
2026-06-01days on market $129,900 Active 67 DOM
-
2026-05-31days on market $129,900 Active 66 DOM
-
2026-05-30days on market $129,900 Active 65 DOM
-
2026-03-27$129,900 Active 818-char remark
Show marketing remark (818 chars)
Investor Opportunity: Spacious 4-Bdrm. Home with Great Potential. Discover possibilities with this cozy 4-Bdrm, 2-Bth home with 2-car garage, nestled in a Quiet Neighborhood. This Estate Property has exceptional potential for Investors or Homeowners alike—whether you're planning to renovate and flip, generate Rental income, or Design Your Dream Home. Enjoy natural light from the Atrium-Style Sunroom, creating a warm and inviting atmosphere. The front Gated Patio provides the perfect spot for morning coffee or relaxing evening drinks. 4th Bdrm. can serve as a Home Office or Guest Space. The HVAC system has been Upgraded with One year warranty. This property is being sold as-is, FOR CASH and Possible Conventional Financing options available. Don’t miss out on this versatile investment opportunity!
-
2026-03-05price $119,500
-
2025-12-31price $119,900
-
2025-12-18price $125,000
-
2025-11-22price $125,900
-
2025-10-31price $128,900
-
2025-10-23price $129,000
-
2025-10-03price $129,500
-
2025-09-25price $129,900
-
2025-09-24status Active
-
2025-09-24price $132,000
-
2025-09-18status Pending
-
2025-08-25price $134,500
-
2025-08-11price $134,900
-
2025-07-14price $135,000
-
2025-07-06price $138,000
-
2025-06-19$139,000 Active
-
2025-05-30price $139,500
-
2025-05-10price $145,000
-
2025-03-12price $159,000
-
2025-01-31price $160,000
-
2024-12-27price $163,000
-
2024-11-30price $164,000
-
2024-10-29$165,000 Active
ⓘ Source: listings_history table (triggers on properties + properties_extension) + one-shot
backfill from property_details.listing_events for pre-trigger history.
Tax reassessment forecast TX · Resets to sale price
- Current annual tax
- $3,747 · $312/mo
- Projected year-2 tax
- $3,747 · $312/mo
- Expected delta
- $0/yr ($0/mo · 0.0%)
ⓘ Screening estimate from a state-policy table — verify with the county assessor before closing.
Climate risk First Street
- Flood 4/10 Moderate FEMA zone X · 22% chance over 30 yrs
- Wildfire 1/10 Low
- Heat 9/10 Extreme 7 d/yr ≥109°F today · 24 d/yr by 30 yrs out
- Wind 9/10 Extreme 99% chance of damaging wind over 30 yrs
- Air quality 2/10 Low 1 unhealthy d/yr today · 1 by 30 yrs out
Nearby sold comps map
Loading sold comps map…
Walkable amenities ~0.75 mi
Loading nearby amenities…
Taxation est. · year 1
- Rental income
- $18,919
- − Mortgage interest
- −$7,276
- − Property taxes
- −$3,747
- − Insurance
- −$650
- − Repairs & maintenance
- −$1,513
- − Management
- −$1,513
- − Depreciation
- −$3,779
- Taxable income
- $440
- Est. tax owed @ 24.0%
- −$106
- After-tax cash flow
- $2,269/yr
For passive investors: Depreciation is non-cash, so a rental often shows a tax loss while cash-flowing — sheltering income. Rental losses are passive: they offset passive income freely, and up to $25,000/yr can offset ordinary (W-2) income if you actively participate and your MAGI is under $100k (phasing out to $0 by $150k); unused losses carry forward. On sale, claimed depreciation is recaptured at up to 25%, and gains may owe capital-gains tax (a 1031 exchange can defer both). Figures are a year-1 estimate at your 24.0% rate — not tax advice; consult a CPA.
Schools (NCES district)
- District
- Beaumont ISD
- NCES district ID
- 4809670
- Math proficiency
- 14% ▼ -13.00%
- Reading proficiency
- 22% ▼ -7.00%
- Median HH income
- $41,683
- Composite
- 15.43/100
- National rank
- #9316
- State rank
- #789 of 826 in TX
Livability — Beaumont
- Score
- 64/100
- State rank
- #739
- US rank
- #13710
Category grades
Schools grade is shown separately in the Schools card above.
Census & demographics
- Census place
- Beaumont, TX
- County
- Jefferson County · 203,592 people
- City population
- 125,901
- Metro
- Beaumont-Port Arthur, TX
- Population (ZIP)
- 38,259
- Household income
- $54,633
- Rent vs Own
- Severe rent burden
- 776.0
Population outlook (Jefferson County) Hauer SSP2
- Today (2025)
- 259,015 people
- By 2030
- 260,685 · +0.6%
- By 2040
- 263,309 · +1.7%
- By 2050
- 265,237 · +2.4%
- By 2075
- 270,193 · +4.3%
- By 2100
- 255,628 · -1.3%
Race, ethnicity, and origin ACS 2023
- Neighborhood character
- Diverse neighborhood (Simpson 0.66)
- Race & ethnicity
- Black 46% White 29% Hispanic / Latino 21% Two or more races 6% Asian 2%
- Hispanic origin (detail)
- Mexican 13%
- Common ancestry
- Lithuanian 5% Italian 1%
- Foreign-born
- 8% · Canada, Vietnam
- Languages at home
- 80% English-only · Spanish 18% Other Indo-European 1%
Political lean MEDSL · Jefferson
- 2024 margin
- Lean R (+8.9) · D 45.1% · R 54.0%
- 2008→2024 swing
- -11.1pp toward R · 2008: 2.2pp · 2024: -8.9pp
- All cycles
- 2024: R+8.9 2020: R+1.6 2016: R+0.5 2012: D+1.6 2008: D+2.2
Not yet ingested
- Civics
- —
Market trends
- HPI YoY
- ▼ -54.76%
- Current HPI
- 129.3696
- Rent YoY
- —
- Metro
- Beaumont-Port Arthur, TX
- State GDP YoY
- ▲ 3.95%
- F500 in state
- 110
Industry mix (Fortune 500 HQ in TX)
| Industry | F500 HQs | Revenue |
|---|---|---|
| Energy | 16 | $1,198B |
|
||
| Technology | 5 | $198B |
|
||
| Engineering / Construction | 4 | $72B |
|
||
| Energy Services | 3 | $60B |
|
||
| Utilities | 3 | $41B |
|
||
| Healthcare | 2 | $330B |
|
||
Price history
-21.3% since first listed24 events — show timeline
- 2026-03-27 Listed $129,900 BBOR
- 2026-03-05 Price Changed $119,500 BBOR
- 2025-12-31 Price Changed $119,900 BBOR
- 2025-12-18 Price Changed $125,000 BBOR
- 2025-11-22 Price Changed $125,900 BBOR
- 2025-10-31 Price Changed $128,900 BBOR
- 2025-10-23 Price Changed $129,000 BBOR
- 2025-10-03 Price Changed $129,500 BBOR
- 2025-09-25 Price Changed $129,900 BBOR
- 2025-09-24 Relisted — BBOR
- 2025-09-24 Price Changed $132,000 BBOR
- 2025-09-18 Pending — BBOR
- 2025-08-25 Price Changed $134,500 BBOR
- 2025-08-11 Price Changed $134,900 BBOR
- 2025-07-14 Price Changed $135,000 BBOR
- 2025-07-06 Price Changed $138,000 BBOR
- 2025-06-19 Listed $139,000 BBOR
- 2025-05-30 Price Changed $139,500 BBOR
- 2025-05-10 Price Changed $145,000 BBOR
- 2025-03-12 Price Changed $159,000 BBOR
- 2025-01-31 Price Changed $160,000 BBOR
- 2024-12-27 Price Changed $163,000 BBOR
- 2024-11-30 Price Changed $164,000 BBOR
- 2024-10-29 Listed $165,000 BBOR
Property tax history
+3.9%/yrLatest (2025): $3,747 · -0.8% YoY. Source: county tax records.
Cash-flow waterfall
monthlySold comps — $/sqft
last 12 mo · ≤1 miLoading sold comps…