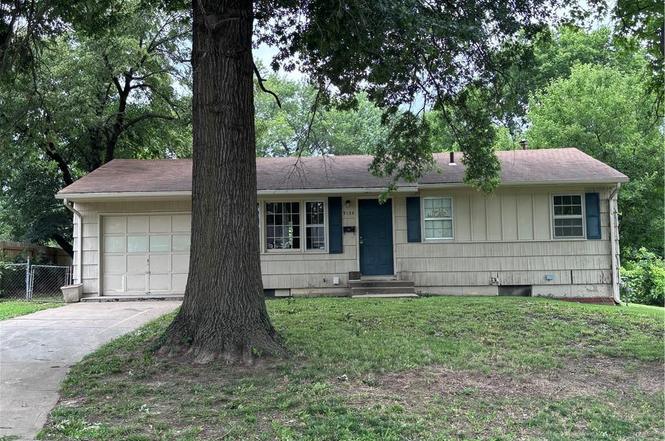
9130 E 44th St · Kansas City, MO
Flood risk 1/10 · Minimal
- FEMA flood zone
- X (unshaded)
- Chance of flooding over 30 yrs
- 0.0%
- Est. flood insurance / yr
- $473 – $860
Fire risk 1/10 · Minimal
- Est. fire insurance / yr
- $1,054 – $1,958
Heat risk 4/10 · Minor
- Hot days now (above 106°F)
- 7 days/yr
- Hot days in 30 yrs
- 17 days/yr
Wind risk 2/10 · Minimal
- Chance of severe wind over 30 yrs
- —
Air-quality risk 3/10 · Minor
- Unhealthy air days now
- 3 days/yr
- Unhealthy air days in 30 yrs
- 5 days/yr
Risk factors via First Street. Map © Google.
Why this score? — see what drove the B- grade
The composite is a weighted blend of 9 inputs, each scored 0–100. Each bar is that input's sub-score; the figure is the points it added to the 100-point composite (weight × sub-score).
- Cash flow +25.9/30.0
- ARV discount +15.0/15.0
- DSCR +8.7/10.0
- 1% rule +6.2/10.0
- Livability +3.9/5.0
- Rent growth +2.8/5.0
- Condition / age +2.5/5.0
- Schools +1.5/10.0
- Appreciation +0.0/10.0
$115,000
🖨 Deal sheet 📄 Offer letter ✓ Due diligence
Listing remarks
With a little TLC this 3 bedroom 1 bath ranch would be perfect for investor or homeowner. Hardwood floors throughout, big backyard with covered patio.
Key facts
- Big backyard
- Covered patio
- Hardwood floors
Tags
Property features AI
Finance
- Other: Not in a flood plain
- HOA & community: No association fees
Exterior
- Parking: Attached garage (1 car)
- Utilities: Public water; Public sewer
- Home design: Single-family residence; Ranch floor plan
- Construction: Shingle siding; Composition roof; Basement with concrete construction
- Exterior features: Covered patio; Metal fencing; Property in fixer condition
Interior
- Kitchen: Electric range; Eat-in kitchen
- Bedrooms: 3 bedrooms (all on the first floor)
- Flooring: Wood floors; Vinyl flooring
- Bathrooms: 1 full bathroom with shower-over-tub (first floor)
- Heating & cooling: Forced air heating; Electric cooling
- Interior features: Storm windows (partial); Fixer condition
- Laundry & utility: Laundry located on the lower level
Neighborhood map
What this means for you Summary
Snapshot
- This is a 3-bed/1.5-bath single-family listed at $115k.
Deal economics
- At list price, monthly cash flow is $282 ($3k/yr) — positive.
- The deal already cash-flows at list — no discount required.
- Meets the 1% rule at list price ($1k rent vs $115k).
- Cap rate 9.2% vs local median 3.9% in Kansas City — top-decile yield for the area; either an underpriced asset or a hidden risk that comps aren't pricing in. Stress-test before assuming the spread holds.
Location & tenants
- Location reads 78/100 on livability (#28 in MO, #2,671 nationally) — a middle-class / working-renter tenant base. Strengths: amenities A+, commute A+, cost of living A+; Watch: schools C-, crime F.
- Kansas City 33 (urban): math 12% / reading 24% proficiency, ranked #308 of 324 in MO (top 95%) — low school quality limits family demand, transient renter base, plan for 1-2y turnover; 75% free/reduced lunch — lower-income household profile, screen leases tightly.
- Market conditions: Rents rising (+1.3%/yr); 203 active listings in the ZIP; 19 comparable units currently listed for rent nearby; rentals at typical pace (median 15d on market — plan ~3-4 weeks tenant-placement turnaround); 4,002 units permitted in Jackson County in 2024 (2,271 in 5+ unit buildings).
Forward outlook
- Local home prices are declining (-3.0%/yr); year-one equity from $795 of loan paydown is wiped out by about $3k of value loss. Plan a longer hold.
- Jackson County population projected at +4% by 2050 — modest demand growth; plan on rents tracking national, not racing it.
Negotiation context
- Only 1 days on market — expect competitive offers; lowballing is unlikely to land.
Questions for the listing agent
- Built in 1963 — when were the roof, HVAC, electrical panel, plumbing, and water heater last replaced?
- Is there a deadline driving the sale (1031 exchange, divorce, estate, relocation)? That informs how much negotiation room exists.
- Crime grade is F in this area — have there been break-ins, vandalism, or insurance claims at this property in the last 3 years? What carrier currently insures it and at what premium?
- What's the average days-on-market for RENTAL listings here right now (not sales)? A rising rental-DOM trend means longer vacancies and softer asking-rent achievability than the comps imply.
- What's the recent tenant-quality profile in this submarket — average credit score on applications, eviction rate, late-payment / NSF rate, and stable-employment percentage? A property-management company in the area should have these aggregated.
- How much new for-sale + rental construction is in the pipeline within 1–3 miles? Heavy new supply typically softens prices + rents 12–24 months out; constrained supply supports both.
Investment metrics
- 1% rule
- 1.12% ✓
- Cap rate
- 9.23%
- Cash-on-cash
- 10.50%
- DSCR
- 1.47
- GRM
- 7.5
CMA / ARV
- ARV (on-the-fly)
- $164,832
- Comps found
- 5
Show comp detail 5 sales within ~0.75 mi
| Address | Dist | Beds/Ba | Sqft | Sold | Price | $/sf | Match |
|---|---|---|---|---|---|---|---|
| 9100 E 44th St | 0.09mi | 3/1.0 | 816 (0%) | 12mo | $125,000 | $153 | 84 |
| 4301 Laurel Ave | 0.11mi | 3/1.0 | 840 (+3%) | 10mo | $194,000 | $231 | 79 |
| 9105 E 43rd Ter | 0.08mi | 2/1.0 (-1) | 840 (+3%) | 13mo | $170,000 | $202 | 74 |
| 9154 E 43rd Ter | 0.11mi | 3/1.0 | 916 (+12%) | 24mo | $135,000 | $147 | 53 |
| 4000 Crescent Ave | 0.57mi | 2/1.0 (-1) | 912 (+12%) | 2mo | $185,000 | $203 | 45 |
Match score weights: distance 35% · size 25% · config 20% · recency 20%. Top-matched comps best support the ARV.
Projected returns pro-forma
-3.0% appreciation · 1.34% rent growth · sell at horizon
- IRR
- -2.4%
- Equity multiple
- 0.91×
- Total profit
- $-2,823
- Equity at exit
- $17,147
- IRR
- 5.5%
- Equity multiple
- 1.38×
- Total profit
- $12,190
- Equity at exit
- $9,943
Cash invested: $32,200 (down + closing). Projections, not guarantees.
Landlord ↔ Tenant lean methodology
- Overall (STATE)
- 81 Strongly Landlord-Friendly
- State Missouri
- 81 Strongly Landlord-Friendly · R+10
- County
- — inherits STATE
- City
- — inherits STATE
ZIP-level market 64133
- Rents YoY
- 1.3%
- Active inventory
- 203
- Price-to-rent
- 7.5×
Monthly cashflow live
- Estimated rent
- $1,285 high interval (Pro) →
- Mortgage (P&I)
- −$603
- Tax from tax record
- −$83 /mo · $991/yr
- Insurance
- −$48
- HOA
- −$0
- Vacancy / Maint / Mgmt
- −$270
- Net cashflow
- $282
Break-even live
UW: 25.0% down · 7.5% · 30yr · 1.5% tax · 5.0% vac · 8.0% maint · 8.0% mgmt
Financing live
Cash to close
- Down payment
- $28,750
- Closing costs
- $3,450
- Reserves months
- —
- Total cash needed
- —
Loan-product check · same deal, 3 products live
Conventional
25% down · 7.5% · 30yr
- Down + closing
- —
- Monthly P&I
- —
- Monthly cashflow
- —
- DSCR
- —
- Eligible?
- —
Personal DTI + credit; lowest rate.
DSCR
20% down · 8.5% · 30yr
- Down + closing
- —
- Monthly P&I
- —
- Monthly cashflow
- —
- DSCR
- —
- Eligible?
- —
No personal income docs; deal must DSCR.
Hard money
10% down · 12.0% · 12mo
- Down + closing
- —
- Monthly P&I
- —
- Monthly cashflow
- —
- DSCR
- —
- Eligible?
- —
Short-term bridge; refi at stabilization.
Rent comps 19 comps
| Address | Beds | Baths | Sqft | Rent | $/sqft | DOM | Units | Dist |
|---|---|---|---|---|---|---|---|---|
| 10415 E 43rd St Kansas City, MO | 1.0–2.0 | 1.0–2.0 | 784 | $1,084 | $1.38 | 1d | 12 | 0.84mi |
| 10500 E 42nd St Kansas City, MO | 1.0–3.0 | 1.0–2.5 | 915 | $1,259 | $1.38 | 16d | 2 | 0.98mi |
| 9715 E 35th Ter S Unit B-9 Independence, MO | 2.0 | 1.0 | 750 | $999 | $1.33 | 21d | 1 | 1.13mi |
| 9715 E 35th Ter S Apt A8 Independence, MO | 2.0 | 1.0 | 750 | $999 | $1.33 | 4d | 1 | 1.13mi |
| 9715 E 35th Ter S Unit B-10 Independence, MO | 2.0 | 1.0 | 750 | $1,095 | $1.46 | 43d | 1 | 1.13mi |
| 9715 E 35th Ter S Unit A-5 Independence, MO | 2.0 | 1.0 | 750 | $1,095 | $1.46 | 14d | 1 | 1.14mi |
| 5312 Hunter St Raytown, MO | 3.0 | 1.5 | 912 | $1,450 | $1.59 | 3d | 1 | 1.16mi |
| 5312 Hunter St Raytown, MO | 3.0 | 1.5 | 912 | $1,450 | $1.59 | 2d | 1 | 1.16mi |
| 3927 Willow Ave Kansas City, MO | 1.0–3.0 | 1.0–2.0 | 997 | $1,350 | $1.35 | 2d | 11 | 1.17mi |
| 5126 Booth Ave Kansas City, MO | 2.0 | 1.0 | 950 | $1,149 | $1.21 | 12d | 1 | 1.19mi |
| 7601 Sni a Bar Ter Kansas City, MO | 2.0 | 1.0 | 827 | $1,099 | $1.33 | 43d | 1 | 1.25mi |
| 7615 E 49th St Kansas City, MO | 2.0 | 1.0 | 888 | $1,095 | $1.23 | 43d | 1 | 1.27mi |
| 10005 E 53rd St Raytown, MO | 3.0 | 1.0 | 700 | $1,250 | $1.79 | 2d | 1 | 1.28mi |
| 10005 E 53rd St Raytown, MO | 3.0 | 1.0 | 700 | $1,250 | $1.79 | 3d | 1 | 1.28mi |
| 7611 E 47th Ter Kansas City, MO | 3.0 | 1.0 | 840 | $1,276 | $1.52 | 7d | 1 | 1.29mi |
| 3333 S Oxford Ave Independence, MO | 2.0 | 1.0 | 700 | $850 | $1.21 | 43d | 1 | 1.29mi |
| 4808 Appleton Ave Kansas City, MO | 3.0 | 1.0 | 925 | $1,395 | $1.51 | 14d | 1 | 1.30mi |
| 4730 Richmond Ave Kansas City, MO | 3.0 | 1.0 | 821 | $1,395 | $1.70 | 43d | 1 | 1.34mi |
| 4934 Appleton Ave Kansas City, MO | 3.0 | 2.0 | 1000 | $1,395 | $1.40 | 16d | 1 | 1.38mi |
Listing history 2 events
-
2026-06-18remarks 150-char remark
-
2026-06-18$115,000 Active 1 DOM
ⓘ Source: listings_history table (triggers on properties + properties_extension) + one-shot
backfill from property_details.listing_events for pre-trigger history.
Tax reassessment forecast MO · Resets to sale price
- Current annual tax
- $991 · $83/mo
- Projected year-2 tax
- $1,116 · $93/mo
- Expected delta
- +$125/yr (+$10/mo · 12.6%)
ⓘ Screening estimate from a state-policy table — verify with the county assessor before closing.
Climate risk First Street
- Flood 1/10 Low FEMA zone X (unshaded) · 0% chance over 30 yrs
- Wildfire 1/10 Low
- Heat 4/10 Moderate 7 d/yr ≥106°F today · 17 d/yr by 30 yrs out
- Wind 2/10 Low
- Air quality 3/10 Moderate 3 unhealthy d/yr today · 5 by 30 yrs out
Nearby sold comps map
Loading sold comps map…
Walkable amenities ~0.75 mi
Loading nearby amenities…
Taxation est. · year 1
- Rental income
- $15,421
- − Mortgage interest
- −$6,442
- − Property taxes
- −$991
- − Insurance
- −$575
- − Repairs & maintenance
- −$1,234
- − Management
- −$1,234
- − Depreciation
- −$3,345
- Taxable income
- $1,601
- Est. tax owed @ 24.0%
- −$384
- After-tax cash flow
- $2,996/yr
For passive investors: Depreciation is non-cash, so a rental often shows a tax loss while cash-flowing — sheltering income. Rental losses are passive: they offset passive income freely, and up to $25,000/yr can offset ordinary (W-2) income if you actively participate and your MAGI is under $100k (phasing out to $0 by $150k); unused losses carry forward. On sale, claimed depreciation is recaptured at up to 25%, and gains may owe capital-gains tax (a 1031 exchange can defer both). Figures are a year-1 estimate at your 24.0% rate — not tax advice; consult a CPA.
Schools (NCES district)
- District
- Kansas City 33
- NCES district ID
- 2916400
- Math proficiency
- 12% ▼ -8.00%
- Reading proficiency
- 24% ▬ 0.00%
- Median HH income
- $35,227
- Composite
- 14.8/100
- National rank
- #9387
- State rank
- #308 of 324 in MO
Livability — Kansas City
- Score
- 78/100
- State rank
- #28
- US rank
- #2671
Category grades
Schools grade is shown separately in the Schools card above.
Census & demographics
- Census place
- Kansas City, MO
- County
- Jackson County · 687,798 people
- City population
- 439,467
- Metro
- Kansas City, MO-KS
- Population (ZIP)
- 36,249
- Household income
- $67,750
- Rent vs Own
- Severe rent burden
- 1173.0
Population outlook (Jackson County) Hauer SSP2
- Today (2025)
- 719,589 people
- By 2030
- 731,456 · +1.6%
- By 2040
- 746,689 · +3.8%
- By 2050
- 749,289 · +4.1%
- By 2075
- 736,227 · +2.3%
- By 2100
- 668,210 · -7.1%
Race, ethnicity, and origin ACS 2023
- Neighborhood character
- Diverse neighborhood (Simpson 0.64)
- Race & ethnicity
- White 46% Black 37% Hispanic / Latino 12% Two or more races 9%
- Hispanic origin (detail)
- Mexican 10%
- Common ancestry
- Italian 7% Slovak 1% Lithuanian 1%
- Foreign-born
- 5% · Canada
- Languages at home
- 90% English-only · Spanish 7% French/Haitian/Cajun 1%
Political lean MEDSL · Jackson
- 2024 margin
- D (+19.3) · D 58.9% · R 39.5% · Other 1.6%
- 2008→2024 swing
- -6.1pp toward R · 2008: 25.4pp · 2024: 19.3pp
- All cycles
- 2024: D+19.3 2020: D+22.0 2016: D+16.6 2012: D+19.0 2008: D+25.4
Not yet ingested
- Civics
- —
Market trends
- HPI YoY
- ▼ -155.40%
- Current HPI
- 263.6915
- Rent YoY
- ▲ 1.34%
- Metro
- Kansas City, MO-KS
- State GDP YoY
- ▲ 1.84%
- F500 in state
- 20
Industry mix (Fortune 500 HQ in MO)
| Industry | F500 HQs | Revenue |
|---|---|---|
| Healthcare | 1 | $163B |
|
||
| Insurance | 1 | $21B |
|
||
| Industrial Technology | 1 | $17B |
|
||
| Retail | 1 | $16B |
|
||
| Industrial Distribution | 1 | $10B |
|
||
| Utilities | 1 | $9B |
|
||
Price history
3 events — show timeline
- 2026-06-18 Listed $115,000 Heartland MLS as Distributed by MLS Grid
- 2002-12-17 Sold (Public Records) — Public Records
- 1962-07-27 Sold (Public Records) — Public Records
Property tax history
+4.5%/yrLatest (2025): $991 · -22.7% YoY. Source: county tax records.
Cash-flow waterfall
monthlySold comps — $/sqft
last 12 mo · ≤1 miLoading sold comps…