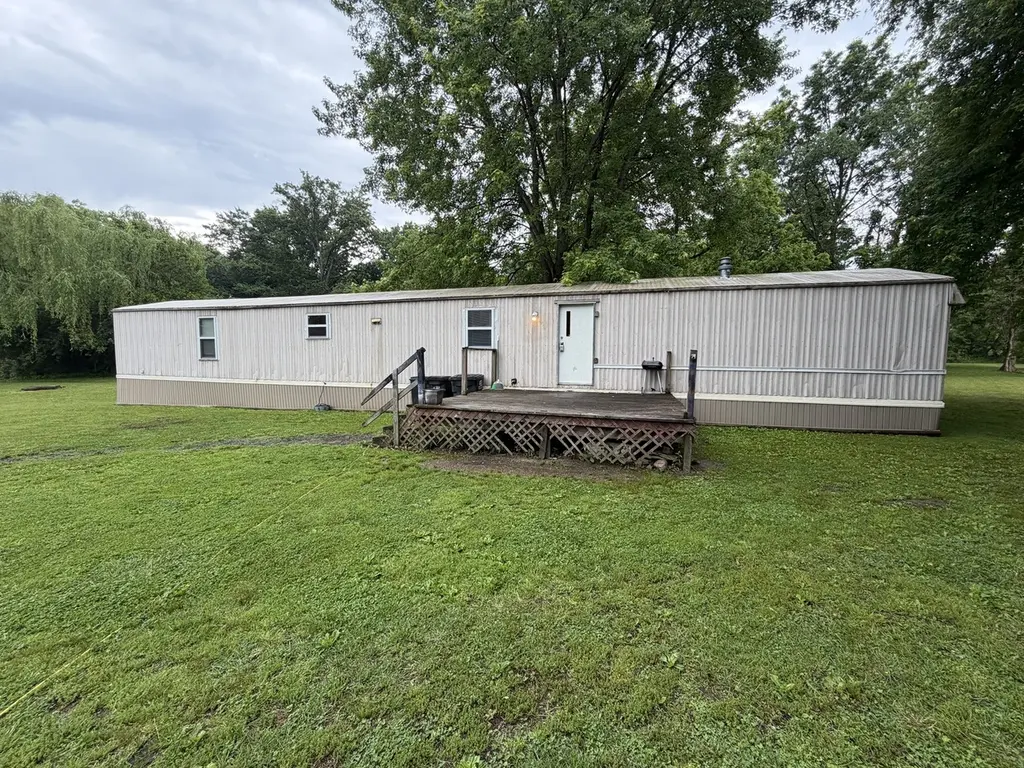
517 Fremont St · Kinmundy, IL
Flood risk 1/10 · Minimal
- FEMA flood zone
- X (unshaded)
- Chance of flooding over 30 yrs
- 0.0%
- Est. flood insurance / yr
- $473 – $860
Fire risk 1/10 · Minimal
- Est. fire insurance / yr
- $804 – $1,492
Heat risk 4/10 · Minor
- Hot days now (above 105°F)
- 7 days/yr
- Hot days in 30 yrs
- 20 days/yr
Wind risk 2/10 · Minimal
- Chance of severe wind over 30 yrs
- 2.0%
Air-quality risk 1/10 · Minimal
- Unhealthy air days now
- 0 days/yr
- Unhealthy air days in 30 yrs
- 0 days/yr
Risk factors via First Street. Map © Google.
Why this score? — see what drove the B grade
The composite is a weighted blend of 9 inputs, each scored 0–100. Each bar is that input's sub-score; the figure is the points it added to the 100-point composite (weight × sub-score).
- Cash flow +30.0/30.0
- DSCR +10.0/10.0
- 1% rule +8.9/10.0
- ARV discount +7.5/15.0
- Appreciation +5.0/10.0
- Livability +2.9/5.0
- Rent growth +2.5/5.0
- Condition / age +2.5/5.0
- Schools +1.4/10.0
$64,900
🖨 Deal sheet (PDF) 📄 Offer letter ✓ Due diligence
Listing remarks
Great opportunity! Looking for a 3 bedroom 2 bathroom manufactured home. 1992 with new kitchen cabinets, new flooring in the kitchen and bathroom remodels! With a little TLC this can be exactly what you want it to be! Over an acres.
Key facts
- New flooring
- Bathroom remodels
- New kitchen cabinets
Tags
Property features AI
Finance
- Other: Property listed by Equity Realty Group; Located in an unincorporated area (Township: Kimmundy)
- HOA & community: No master association fee required
Exterior
- Utilities: Public water; Public sewer
- Home design: Detached single manufactured home; Fee simple ownership; Age: 31–40 years
- Construction: Steel siding; Built before 1978: No; Not rebuilt or rehabilitated
- Exterior features: Lot about 1.0–1.99 acres (approximately 1.15 acres); Lot features: Other
Interior
- Kitchen: Kitchen
- Bedrooms: Master bedroom (Main, 13 x 16); Two additional bedrooms (Main, each about 7 x 10)
- Bathrooms: 2 full bathrooms; Master bathroom is a full bath
- Heating & cooling: Window air conditioning units; Other type of heating
- Interior features: Living room; Family room; Dining room
- Laundry & utility: Laundry room
Neighborhood map
What this means for you Summary
Snapshot
- This is a 3-bed/2.0-bath single-family listed at $65k.
Deal economics
- At list price, monthly cash flow is $290 ($3k/yr) — positive.
- The deal already cash-flows at list — no discount required.
- Meets the 1% rule at list price ($904 rent vs $65k).
- Recommended offer: $63k (3.0% below list) — sets the bar for market timing.
Location & tenants
- Location reads 58/100 on livability (#1,135 in IL) — a working-class tenant base; expect higher turnover. Strengths: cost of living A+, housing A+; Watch: schools F, crime D-, amenities F.
- South Central CUD 401 (rural): math 12% / reading 19% proficiency, ranked #506 of 620 in IL (top 82%) — low school quality limits family demand, transient renter base, plan for 1-2y turnover.
- Market conditions: 4 active listings in the ZIP; 2 units permitted in Marion County in 2024 (0 in 5+ unit buildings).
Forward outlook
- In year one you build about $2k of equity ($449 loan paydown + $2k appreciation (3.0% local appreciation)).
- Marion County population projected at -20% by 2050 — secular population decline; favor cash flow + early exit over multi-decade hold.
- At projected returns (3.0% appreciation + 3.0% rent growth), your $18k cash investment doubles in ~3 years — after that, you're playing with house money.
Negotiation context
- It's been on market 34 days — a 3% lower offer ($63k) is reasonable based on typical stale-listing flexibility.
- 5 sale attempts since 3y ago with the ask held roughly flat each time — persistent listings suggest the price (not the market) is what's stuck; bring a comps-based counter.
Questions for the listing agent
- It's been on market 34 days. Have you received any prior offers? Is the seller open to a 3% concession, seller financing, or rate buy-down credit?
- Is there a deadline driving the sale (1031 exchange, divorce, estate, relocation)? That informs how much negotiation room exists.
- Schools are F-rated, which usually means shorter tenancies and higher turnover. Who's the typical renter profile here, and what's been the actual vacancy rate?
- Crime grade is D in this area — have there been break-ins, vandalism, or insurance claims at this property in the last 3 years? What carrier currently insures it and at what premium?
- What's the average days-on-market for RENTAL listings here right now (not sales)? A rising rental-DOM trend means longer vacancies and softer asking-rent achievability than the comps imply.
- What's the recent tenant-quality profile in this submarket — average credit score on applications, eviction rate, late-payment / NSF rate, and stable-employment percentage? A property-management company in the area should have these aggregated.
- How much new for-sale + rental construction is in the pipeline within 1–3 miles? Heavy new supply typically softens prices + rents 12–24 months out; constrained supply supports both.
Investment metrics
- 1% rule
- 1.39% ✓
- Cap rate
- 11.66%
- Cash-on-cash
- 19.17%
- DSCR
- 1.85
- GRM
- 6.0
CMA / ARV
- ARV (on-the-fly)
- $27,360
- Comps found
- 1
Show comp detail 1 sale within ~0.75 mi
| Address | Dist | Beds/Ba | Sqft | Sold | Price | $/sf | Match |
|---|---|---|---|---|---|---|---|
| 401 N Monroe St | 0.66mi | 2/2.0 (-1) | 924 (+1%) | 7mo | $28,000 | $30 | 56 |
Match score weights: distance 35% · size 25% · config 20% · recency 20%. Top-matched comps best support the ARV.
Projected returns pro-forma
3.0% appreciation · 3.0% rent growth · sell at horizon
- IRR
- 25.5%
- Equity multiple
- 2.45×
- Total profit
- $26,307
- Equity at exit
- $29,182
- IRR
- 26.2%
- Equity multiple
- 4.73×
- Total profit
- $67,744
- Equity at exit
- $44,973
Cash invested: $18,172 (down + closing). Projections, not guarantees.
Landlord ↔ Tenant lean methodology
- Overall (STATE)
- 43 Moderately Tenant-Leaning
- State Illinois
- 43 Moderately Tenant-Leaning · D+7
- County
- — inherits STATE
- City
- — inherits STATE
ZIP-level market 62854
- Active inventory
- 4
- Price-to-rent
- 6.0×
Monthly cashflow live
- Estimated rent
- $904 medium interval (Pro) →
- Mortgage (P&I)
- −$340
- Tax from tax record
- −$56 /mo · $674/yr
- Insurance
- −$27
- HOA
- −$0
- Vacancy / Maint / Mgmt
- −$190
- Net cashflow
- $290
Break-even live
Sensitivity live
| Price | -10% $327 | -5% $309 | +0% $290 | +5% $272 | +10% $254 |
|---|---|---|---|---|---|
| Rent | -10% $219 | -5% $255 | +0% $290 | +5% $326 | +10% $362 |
| Rate | -1.0pp $323 | -0.5pp $307 | base $290 | +0.5pp $273 | +1.0pp $256 |
UW: 25.0% down · 7.5% · 30yr · 1.5% tax · 5.0% vac · 8.0% maint · 8.0% mgmt
Financing live
Cash to close
- Down payment
- $16,225
- Closing costs
- $1,947
- Reserves months
- —
- Total cash needed
- —
Loan-product check · same deal, 3 products live
Conventional
25% down · 7.5% · 30yr
- Down + closing
- —
- Monthly P&I
- —
- Monthly cashflow
- —
- DSCR
- —
- Eligible?
- —
Personal DTI + credit; lowest rate.
DSCR
20% down · 8.5% · 30yr
- Down + closing
- —
- Monthly P&I
- —
- Monthly cashflow
- —
- DSCR
- —
- Eligible?
- —
No personal income docs; deal must DSCR.
Hard money
10% down · 12.0% · 12mo
- Down + closing
- —
- Monthly P&I
- —
- Monthly cashflow
- —
- DSCR
- —
- Eligible?
- —
Short-term bridge; refi at stabilization.
Listing history 29 events
-
2026-06-21days on market $64,900 Active 34 DOM
-
2026-06-21days on market $64,900 Active 33 DOM
-
2026-06-18days on market $64,900 Active 31 DOM
-
2026-06-17days on market $64,900 Active 30 DOM
-
2026-06-16days on market $64,900 Active 29 DOM
-
2026-06-15days on market $64,900 Active 28 DOM
-
2026-06-13days on market $64,900 Active 26 DOM
-
2026-06-12days on market $64,900 Active 25 DOM
-
2026-06-09days on market $64,900 Active 22 DOM
-
2026-06-08days on market $64,900 Active 21 DOM
-
2026-06-07days on market $64,900 Active 20 DOM
-
2026-06-05days on market $64,900 Active 18 DOM
-
2026-06-04days on market $64,900 Active 16 DOM
-
2026-06-02days on market $64,900 Active 15 DOM
-
2026-06-01days on market $64,900 Active 14 DOM
-
2026-05-31days on market $64,900 Active 13 DOM
-
2026-05-31days on market $64,900 Active 12 DOM
-
2026-05-16$64,900 Active
-
2025-10-04historical
-
2025-10-03historical
-
2025-04-03Active
-
2023-12-21status Active
-
2023-12-21historical
-
2023-12-21historical
-
2023-12-21historical
-
2023-11-18historical
-
2023-09-21price
-
2023-05-17Active
-
2023-05-16Active
ⓘ Source: listings_history table (triggers on properties + properties_extension) + one-shot
backfill from property_details.listing_events for pre-trigger history.
Tax reassessment forecast IL · Partial reset (capped growth)
- Current annual tax
- $674 · $56/mo
- Projected year-2 tax
- $1,073 · $89/mo
- Expected delta
- +$400/yr (+$33/mo · 59.3%)
ⓘ Screening estimate from a state-policy table — verify with the county assessor before closing.
Climate risk First Street
- Flood 1/10 Low FEMA zone X (unshaded) · 0% chance over 30 yrs
- Wildfire 1/10 Low
- Heat 4/10 Moderate 7 d/yr ≥105°F today · 20 d/yr by 30 yrs out
- Wind 2/10 Low 2% chance of damaging wind over 30 yrs
- Air quality 1/10 Low 0 unhealthy d/yr today · 0 by 30 yrs out
Nearby sold comps map
Loading sold comps map…
Walkable amenities ~0.75 mi
Loading nearby amenities…
Taxation est. · year 1
- Rental income
- $10,843
- − Mortgage interest
- −$3,635
- − Property taxes
- −$674
- − Insurance
- −$324
- − Repairs & maintenance
- −$867
- − Management
- −$867
- − Depreciation
- −$1,888
- Taxable income
- $2,587
- Est. tax owed @ 24.0%
- −$621
- After-tax cash flow
- $2,863/yr
For passive investors: Depreciation is non-cash, so a rental often shows a tax loss while cash-flowing — sheltering income. Rental losses are passive: they offset passive income freely, and up to $25,000/yr can offset ordinary (W-2) income if you actively participate and your MAGI is under $100k (phasing out to $0 by $150k); unused losses carry forward. On sale, claimed depreciation is recaptured at up to 25%, and gains may owe capital-gains tax (a 1031 exchange can defer both). Figures are a year-1 estimate at your 24.0% rate — not tax advice; consult a CPA.
Schools (NCES district)
- District
- South Central CUD 401
- NCES district ID
- 1700114
- Math proficiency
- 12% ▼ -1.00%
- Reading proficiency
- 19% ▼ -13.00%
- Median HH income
- $43,276
- Composite
- 13.52/100
- National rank
- #9517
- State rank
- #506 of 620 in IL
Livability — Kinmundy
- Score
- 58/100
- State rank
- #1135
- US rank
- #21440
Category grades
Schools grade is shown separately in the Schools card above.
Census & demographics
- Census place
- Kinmundy, IL
- Population (ZIP)
- 1,561
Population outlook (Marion County) Hauer SSP2
- Today (2025)
- 36,071 people
- By 2030
- 34,598 · -4.1%
- By 2040
- 31,754 · -12.0%
- By 2050
- 28,912 · -19.8%
- By 2075
- 22,527 · -37.5%
- By 2100
- 16,455 · -54.4%
Race, ethnicity, and origin ACS 2023
- Neighborhood character
- Predominantly White (95%)
- Race & ethnicity
- White 95% Hispanic / Latino 4% Two or more races 2%
- Common ancestry
- Romanian 4% Iranian 3% Portuguese 3%
- Foreign-born
- 1% · Canada
- Languages at home
- 95% English-only · German/W. Germanic 2% Russian/Polish/Slavic 1% Spanish 1%
Political lean MEDSL · Marion
- 2024 margin
- Solid R (+49.5) · D 24.6% · R 74.1% · Other 1.4%
- 2008→2024 swing
- -47.5pp toward R · 2008: -2.0pp · 2024: -49.5pp
- All cycles
- 2024: R+49.5 2020: R+46.6 2016: R+44.9 2012: R+19.2 2008: R+2.0
Not yet ingested
- Civics
- —
Market trends
- HPI YoY
- —
- Current HPI
- —
- Rent YoY
- —
- Metro
- —
- State GDP YoY
- ▲ 1.59%
- F500 in state
- 60
Industry mix (Fortune 500 HQ in IL)
| Industry | F500 HQs | Revenue |
|---|---|---|
| Insurance | 4 | $201B |
|
||
| Consumer Goods | 4 | $87B |
|
||
| Industrial Machinery | 3 | $64B |
|
||
| Healthcare | 2 | $55B |
|
||
| Retail / Pharmacy | 1 | $148B |
|
||
| Agriculture / Food | 1 | $86B |
|
||
Price history
12 events — show timeline
- 2026-05-16 Listed $64,900 MRED as Distributed by MLS Grid
- 2025-10-04 Listing Removed — RMLSA as Distributed by MLS Grid
- 2025-10-03 Listing Removed — MRED as Distributed by MLS Grid
- 2025-04-03 Listed — RMLSA as Distributed by MLS Grid
- 2023-12-21 Relisted — RMLSA as Distributed by MLS Grid
- 2023-12-21 Listing Removed — RMLSA as Distributed by MLS Grid
- 2023-12-21 Listing Removed — MRED as Distributed by MLS Grid
- 2023-12-21 Listing Removed — RMLSA as Distributed by MLS Grid
- 2023-11-18 Listing Removed — RMLSA as Distributed by MLS Grid
- 2023-09-21 Price Changed — RMLSA as Distributed by MLS Grid
- 2023-05-17 Listed — RMLSA as Distributed by MLS Grid
- 2023-05-16 Listed — RMLSA as Distributed by MLS Grid
Property tax history
+18.9%/yrLatest (2024): $674 · +164.6% YoY. Source: county tax records.
Cash-flow waterfall
monthlySold comps — $/sqft
last 12 mo · ≤1 miLoading sold comps…