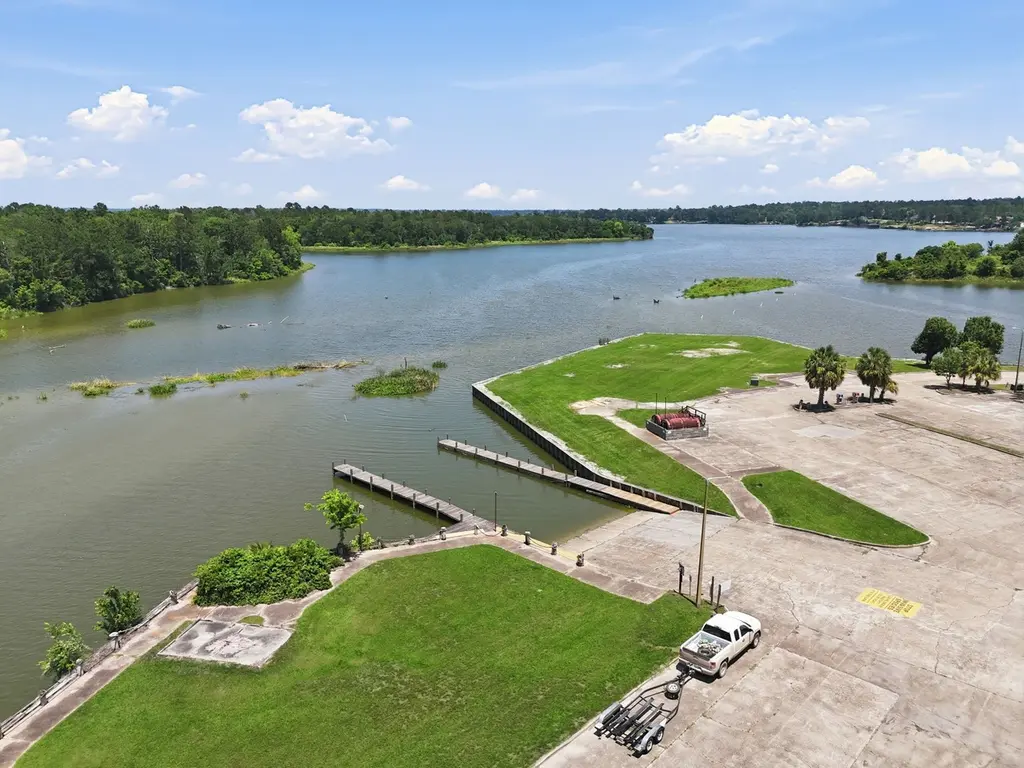
501 Bass Boat Vlg #112 · Huntsville, TX
Flood risk 4/10 · Minor
- FEMA flood zone
- X (unshaded)
- Chance of flooding over 30 yrs
- 0.22%
- Est. flood insurance / yr
- $507 – $1,088
Fire risk 4/10 · Minor
- Est. fire insurance / yr
- $1,222 – $2,270
Heat risk 8/10 · Major
- Hot days now (above 110°F)
- 7 days/yr
- Hot days in 30 yrs
- 24 days/yr
Wind risk 8/10 · Major
- Chance of severe wind over 30 yrs
- 98.0%
Air-quality risk 1/10 · Minimal
- Unhealthy air days now
- 0 days/yr
- Unhealthy air days in 30 yrs
- 0 days/yr
Risk factors via First Street. Map © Google.
Why this score? — see what drove the D grade
The composite is a weighted blend of 9 inputs, each scored 0–100. Each bar is that input's sub-score; the figure is the points it added to the 100-point composite (weight × sub-score).
- Cash flow +13.2/30.0
- ARV discount +7.5/15.0
- 1% rule +4.8/10.0
- DSCR +4.0/10.0
- Rent growth +3.2/5.0
- Livability +3.2/5.0
- Condition / age +2.5/5.0
- Schools +2.0/10.0
- Appreciation +0.0/10.0
$95,000
🖨 Deal sheet (PDF) 📄 Offer letter ✓ Due diligence
Listing remarks
Discover the perfect lock-and-leave getaway in the heart of Waterwood. Ideally located on the lake and the renowned Waterwood National Golf Course community. This fully furnished townhome offers an incredible opportunity to own an affordable retreat or a great investment for a Sam Houston University student-just a 25 min drive. Designed for those who love boating, fishing, golf, and weekend escapes, the unique “boat-in, boat-out” garage makes storing and accessing your boat or golf cart effortless. Spend your days on the lake, on the golf course, or simply relaxing in this peaceful setting. Monthly maintenance fees of $125, cover building insurance, termite protection, roofs, ba
Key facts
- Located on the lake
- Turn key property
- $75 HOA
Tags
Property features AI
Finance
- HOA & community: Member of Waterwood Improvement Assn/BBV; Annual association fee; Association fee covers common areas, insurance, and structure maintenance; Community amenities include boat dock, boat ramp, sport court, golf course, picnic area, playground, pickleball, RV/boat storage, tennis courts, guard, and community pool
Exterior
- Parking: Attached garage (1 car); Additional parking; RV/Boat access and parking; Boat parking
- Security: Community security / guarded
- Utilities: Public water; Public sewer
- Home design: Residential property; 3 stories; Full ownership; Has view
- Construction: Built in 1976; Vinyl siding; Metal roof; Slab foundation
- Exterior features: Balcony; Deck; Patio; Play structure; Tennis court(s); Backs to greenbelt/park; Boat ramp/lift access; Pier
Interior
- Kitchen: Electric range; Oven; Microwave; Disposal; Refrigerator
- Bedrooms: One bedroom on the third level (approx. 10 x 20)
- Flooring: Vinyl
- Bathrooms: 1 full bathroom
- Heating & cooling: Central heating (electric); Central air (electric)
- Interior features: High ceilings; Pantry; Window treatments; Window coverings
- Laundry & utility: Stacked washer/dryer; Washer; Dryer; Laundry area in garage
Neighborhood map
What this means for you Summary
Snapshot
- This is a 1-bed/1.0-bath townhouse listed at $95k.
Deal economics
- At list price, monthly cash flow is $-1 ($-13/yr) — negative.
- To cash-flow at today's rent, offer at most $95k (0.2% below list).
- To meet the 1% rule (rent ≥ 1% of price), the offer needs to be $93k (2.1% below list).
- Recommended offer: $92k (3.0% below list) — sets the bar for market timing.
- Cap rate 6.3% vs local median 2.8% in Huntsville — top-decile yield for the area; either an underpriced asset or a hidden risk that comps aren't pricing in. Stress-test before assuming the spread holds.
Location & tenants
- Location reads 63/100 on livability (#825 in TX) — a middle-class / working-renter tenant base. Strengths: cost of living A+; Watch: amenities C-, crime D-, commute F.
- Coldspring-Oakhurst CISD (rural): math 18% / reading 28% proficiency, ranked #732 of 826 in TX (top 89%) — low school quality limits family demand, transient renter base, plan for 1-2y turnover; 60% free/reduced lunch — lower-income household profile, screen leases tightly.
- Zoned schools: Street El (449 students, 70% FRL); Lincoln J H (math 14% / reading 28%, grade F, #1,387 of 1,662 statewide, top 85%, 347 students, 58% FRL); Coldspring-Oakhurst H S (math 27% / reading 37%, grade F, #1,044 of 1,632 statewide, top 66%, 496 students, 55% FRL) — zoned schools at 61% FRL track the district average.
- Market conditions: Rents rising (+2.9%/yr); 520 active listings in the ZIP; 575 units permitted in San Jacinto County in 2024 (0 in 5+ unit buildings).
Forward outlook
- Local home prices are declining (-3.0%/yr); year-one equity from $657 of loan paydown is wiped out by about $3k of value loss. Plan a longer hold.
- San Jacinto County population projected at +7% by 2050 — modest demand growth; plan on rents tracking national, not racing it.
Negotiation context
- It's been on market 32 days — a 3% lower offer ($92k) is reasonable based on typical stale-listing flexibility.
Risks & watch-outs
- Climate carrying-cost: severe wind risk, 98% chance of damaging wind over 30y; extreme-heat days projected 7→24/yr by 2055 (HVAC capex compounding) — expect insurance premiums to compound above CPI over the hold.
Questions for the listing agent
- What do current leases actually rent for vs. the listed asking? Can we see a recent rent roll and the last 12 months of T-12 income?
- It's been on market 32 days. Have you received any prior offers? Is the seller open to a 3% concession, seller financing, or rate buy-down credit?
- Built in 1976 — when were the roof, HVAC, electrical panel, plumbing, and water heater last replaced?
- What does the HOA fee cover, when was the last increase, and are there any pending special assessments or reserve-fund shortfalls?
- Is there a deadline driving the sale (1031 exchange, divorce, estate, relocation)? That informs how much negotiation room exists.
- Schools are D-rated, which usually means shorter tenancies and higher turnover. Who's the typical renter profile here, and what's been the actual vacancy rate?
- Crime grade is D in this area — have there been break-ins, vandalism, or insurance claims at this property in the last 3 years? What carrier currently insures it and at what premium?
- The area grade is low — what's the realistic commute time and amenity access for the typical tenant pool here? Any planned neighborhood developments (good or bad) we should know about?
- What's the average days-on-market for RENTAL listings here right now (not sales)? A rising rental-DOM trend means longer vacancies and softer asking-rent achievability than the comps imply.
- What's the recent tenant-quality profile in this submarket — average credit score on applications, eviction rate, late-payment / NSF rate, and stable-employment percentage? A property-management company in the area should have these aggregated.
- How much new for-sale + rental construction is in the pipeline within 1–3 miles? Heavy new supply typically softens prices + rents 12–24 months out; constrained supply supports both.
Investment metrics
- 1% rule
- 0.98% ✗
- Cap rate
- 6.28%
- Cash-on-cash
- -0.05%
- DSCR
- 1.00
- GRM
- 8.5
CMA / ARV
- ARV (on-the-fly)
- $60,032
- Comps found
- 2
Show comp detail 2 sales within ~0.75 mi
| Address | Dist | Beds/Ba | Sqft | Sold | Price | $/sf | Match |
|---|---|---|---|---|---|---|---|
| 501 Bass Boat Vlg #304 | 0.04mi | 1/1.0 | 448 (0%) | 7mo | $57,500 | $128 | 92 |
| 501 Waterwood Bay Rd Rd #209 | 0.05mi | 1/1.0 | 448 (0%) | 7mo | $59,900 | $134 | 92 |
Match score weights: distance 35% · size 25% · config 20% · recency 20%. Top-matched comps best support the ARV.
Projected returns pro-forma
-3.0% appreciation · 2.89% rent growth · sell at horizon
- IRR
- -16.4%
- Equity multiple
- 0.42×
- Total profit
- $-15,502
- Equity at exit
- $14,165
- IRR
- -8.3%
- Equity multiple
- 0.48×
- Total profit
- $-13,752
- Equity at exit
- $8,214
Cash invested: $26,600 (down + closing). Projections, not guarantees.
Landlord ↔ Tenant lean methodology
- Overall (STATE)
- 87 Strongly Landlord-Friendly
- State Texas
- 87 Strongly Landlord-Friendly · R+5
- County
- — inherits STATE
- City
- — inherits STATE
ZIP-level market 77320
- Home prices YoY
- -33.0%
- Rents YoY
- 2.9%
- Active inventory
- 520
- Price-to-rent
- 8.5×
Monthly cashflow live
- Estimated rent
- $930 medium interval (Pro) →
- Mortgage (P&I)
- −$498
- Tax from tax record
- −$123 /mo · $1,480/yr
- Insurance
- −$40
- HOA
- −$75
- Vacancy / Maint / Mgmt
- −$195
- Net cashflow
- $-1
Break-even live
Sensitivity live
| Price | -10% $53 | -5% $26 | +0% $-1 | +5% $-28 | +10% $-55 |
|---|---|---|---|---|---|
| Rent | -10% $-75 | -5% $-38 | +0% $-1 | +5% $36 | +10% $72 |
| Rate | -1.0pp $47 | -0.5pp $23 | base $-1 | +0.5pp $-26 | +1.0pp $-51 |
UW: 25.0% down · 7.5% · 30yr · 1.5% tax · 5.0% vac · 8.0% maint · 8.0% mgmt
Financing live
Cash to close
- Down payment
- $23,750
- Closing costs
- $2,850
- Reserves months
- —
- Total cash needed
- —
Loan-product check · same deal, 3 products live
Conventional
25% down · 7.5% · 30yr
- Down + closing
- —
- Monthly P&I
- —
- Monthly cashflow
- —
- DSCR
- —
- Eligible?
- —
Personal DTI + credit; lowest rate.
DSCR
20% down · 8.5% · 30yr
- Down + closing
- —
- Monthly P&I
- —
- Monthly cashflow
- —
- DSCR
- —
- Eligible?
- —
No personal income docs; deal must DSCR.
Hard money
10% down · 12.0% · 12mo
- Down + closing
- —
- Monthly P&I
- —
- Monthly cashflow
- —
- DSCR
- —
- Eligible?
- —
Short-term bridge; refi at stabilization.
HOA detail
- Monthly dues
- $75 · $900/yr
- Likely covers
- waterinsurance
Listing history 20 events
-
2026-06-21days on market $95,000 Active 32 DOM
-
2026-06-19days on market $95,000 Active 30 DOM
-
2026-06-18days on market $95,000 Active 29 DOM
-
2026-06-17days on market $95,000 Active 28 DOM
-
2026-06-16days on market $95,000 Active 27 DOM
-
2026-06-15days on market $95,000 Active 26 DOM
-
2026-06-14days on market $95,000 Active 24 DOM
-
2026-06-13days on market $95,000 Active 23 DOM
-
2026-06-10days on market $95,000 Active 21 DOM
-
2026-06-09days on market $95,000 Active 20 DOM
-
2026-06-08days on market $95,000 Active 19 DOM
-
2026-06-07days on market $95,000 Active 18 DOM
-
2026-06-03days on market $95,000 Active 14 DOM
-
2026-06-02days on market $95,000 Active 13 DOM
-
2026-06-01days on market $95,000 Active 12 DOM
-
2026-05-31days on market $95,000 Active 11 DOM
-
2026-05-30days on market $95,000 Active 10 DOM
-
2026-05-20$95,000 Active
-
2025-12-30soldstatus
-
2006-06-28soldstatus
ⓘ Source: listings_history table (triggers on properties + properties_extension) + one-shot
backfill from property_details.listing_events for pre-trigger history.
Tax reassessment forecast TX · Resets to sale price
- Current annual tax
- $1,480 · $123/mo
- Projected year-2 tax
- $1,738 · $145/mo
- Expected delta
- +$259/yr (+$22/mo · 17.5%)
ⓘ Screening estimate from a state-policy table — verify with the county assessor before closing.
Climate risk First Street
- Flood 4/10 Moderate FEMA zone X (unshaded) · 22% chance over 30 yrs
- Wildfire 4/10 Moderate
- Heat 8/10 Severe 7 d/yr ≥110°F today · 24 d/yr by 30 yrs out
- Wind 8/10 Severe 98% chance of damaging wind over 30 yrs
- Air quality 1/10 Low 0 unhealthy d/yr today · 0 by 30 yrs out
Nearby sold comps map
Loading sold comps map…
Walkable amenities ~0.75 mi
Loading nearby amenities…
Taxation est. · year 1
- Rental income
- $11,165
- − Mortgage interest
- −$5,321
- − Property taxes
- −$1,480
- − Insurance
- −$475
- − Repairs & maintenance
- −$893
- − Management
- −$893
- − HOA
- −$900
- − Depreciation
- −$2,764
- Taxable loss
- −$1,561
- Est. tax savings @ 24.0%
- +$375
- After-tax cash flow
- $362/yr
For passive investors: Depreciation is non-cash, so a rental often shows a tax loss while cash-flowing — sheltering income. Rental losses are passive: they offset passive income freely, and up to $25,000/yr can offset ordinary (W-2) income if you actively participate and your MAGI is under $100k (phasing out to $0 by $150k); unused losses carry forward. On sale, claimed depreciation is recaptured at up to 25%, and gains may owe capital-gains tax (a 1031 exchange can defer both). Figures are a year-1 estimate at your 24.0% rate — not tax advice; consult a CPA.
Schools (NCES district)
- District
- Coldspring-Oakhurst CISD
- NCES district ID
- 4814520
- Math proficiency
- 18% ▼ -9.00%
- Reading proficiency
- 28% ▼ -2.00%
- Median HH income
- $46,916
- Composite
- 20.07/100
- National rank
- #8653
- State rank
- #732 of 826 in TX
Livability — Huntsville
- Score
- 63/100
- State rank
- #825
- US rank
- #14909
Category grades
Schools grade is shown separately in the Schools card above.
Census & demographics
- County
- Walker County · 75,669 people
- City population
- 75,669
- Metro
- Huntsville, TX
- Population (ZIP)
- 38,152
- Household income
- $55,663
- Rent vs Own
- Severe rent burden
- 1030.0
Population outlook (San Jacinto County) Hauer SSP2
- Today (2025)
- 29,069 people
- By 2030
- 29,750 · +2.3%
- By 2040
- 30,714 · +5.7%
- By 2050
- 31,010 · +6.7%
- By 2075
- 31,616 · +8.8%
- By 2100
- 29,874 · +2.8%
Race, ethnicity, and origin ACS 2023
- Neighborhood character
- Diverse neighborhood (Simpson 0.64)
- Race & ethnicity
- White 50% Hispanic / Latino 26% Black 21% Two or more races 15%
- Hispanic origin (detail)
- Mexican 20%
- Common ancestry
- Lithuanian 2% Italian 2% Slovak 2%
- Foreign-born
- 9% · Canada, Vietnam
- Languages at home
- 79% English-only · Spanish 19%
Political lean MEDSL · San Jacinto
- 2024 margin
- Solid R (+65.3) · D 17.0% · R 82.3%
- 2008→2024 swing
- -27.0pp toward R · 2008: -38.3pp · 2024: -65.3pp
- All cycles
- 2024: R+65.3 2020: R+61.9 2016: R+58.4 2012: R+48.9 2008: R+38.3
Not yet ingested
- Civics
- —
Market trends
- HPI YoY
- ▼ -93.48%
- Current HPI
- 190.199
- Rent YoY
- ▲ 2.89%
- Metro
- Huntsville, TX
- State GDP YoY
- ▲ 3.95%
- F500 in state
- 110
Industry mix (Fortune 500 HQ in TX)
| Industry | F500 HQs | Revenue |
|---|---|---|
| Energy | 16 | $1,198B |
|
||
| Technology | 5 | $198B |
|
||
| Engineering / Construction | 4 | $72B |
|
||
| Energy Services | 3 | $60B |
|
||
| Utilities | 3 | $41B |
|
||
| Healthcare | 2 | $330B |
|
||
Price history
3 events — show timeline
- 2026-05-20 Listed $95,000 HARMLS
- 2025-12-30 Sold (Public Records) — Public Records
- 2006-06-28 Sold (Public Records) — Public Records
Property tax history
+6.4%/yrLatest (2025): $1,480 · +1.2% YoY. Source: county tax records.
Cash-flow waterfall
monthlySold comps — $/sqft
last 12 mo · ≤1 miLoading sold comps…