1229 S Katherine Ave · Callaway, FL
Flood risk 7/10 · Major
- FEMA flood zone
- X (unshaded)
- Chance of flooding over 30 yrs
- 0.74%
- Est. flood insurance / yr
- $507 – $1,088
Fire risk 4/10 · Minor
- Est. fire insurance / yr
- $947 – $1,759
Heat risk 10/10 · Severe
- Hot days now (above 104°F)
- 7 days/yr
- Hot days in 30 yrs
- 21 days/yr
Wind risk 10/10 · Severe
- Chance of severe wind over 30 yrs
- 99.0%
Air-quality risk 1/10 · Minimal
- Unhealthy air days now
- 0 days/yr
- Unhealthy air days in 30 yrs
- 0 days/yr
Risk factors via First Street. Map © Google.
Why this score? — see what drove the B+ grade
The composite is a weighted blend of 9 inputs, each scored 0–100. Each bar is that input's sub-score; the figure is the points it added to the 100-point composite (weight × sub-score).
- Cash flow +30.0/30.0
- ARV discount +15.0/15.0
- 1% rule +10.0/10.0
- DSCR +10.0/10.0
- Schools +4.3/10.0
- Livability +3.2/5.0
- Rent growth +2.8/5.0
- Condition / age +2.5/5.0
- Appreciation +0.0/10.0
$86,000
🖨 Deal sheet (PDF) 📄 Offer letter ✓ Due diligence
Listing remarks
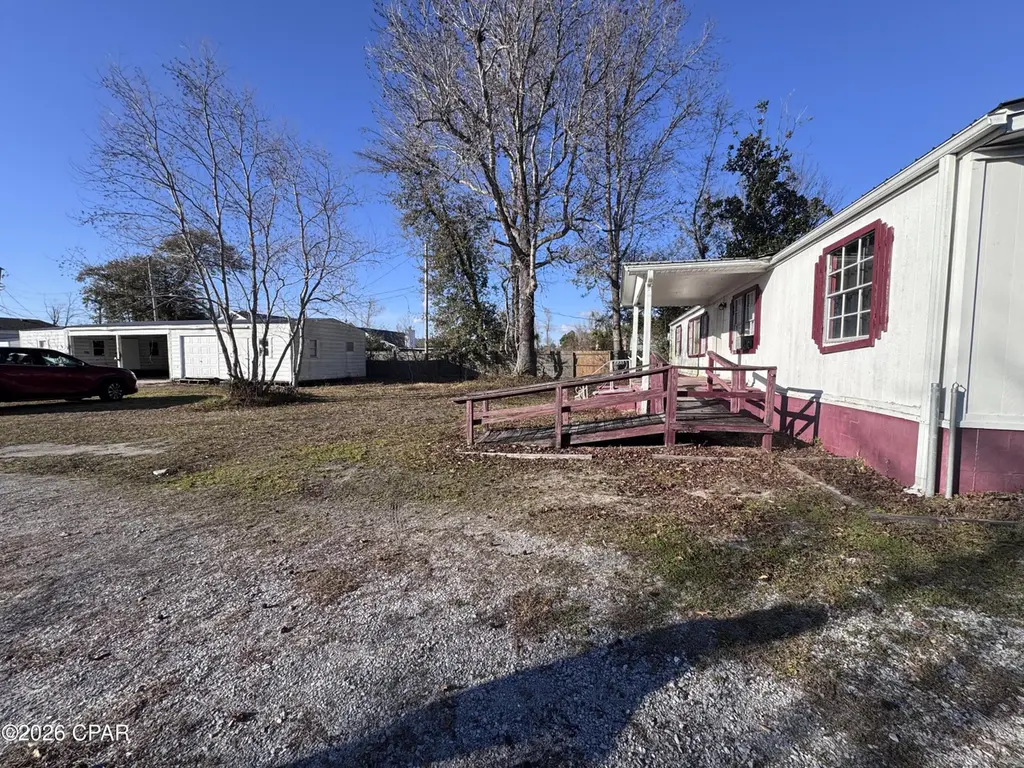
Affordable 3BR/2BA home on its own land in 32404! This 1977 mobile home offers a functional layout with split-bedroom potential, covered carport, and two storage sheds for added utility. The property is livable and ready for occupancy, making it a great option for an owner-occupant or investor seeking affordable housing with land ownership. Some repairs will need to be done. No lot rent. Outdoor space allows room for storage, hobbies, or small projects. Conveniently located near schools, shopping, and major roadways. Schedule your showing today!
Key facts
- Living space
- 0.5 acre lot
- Built 1977
Tags
Property features AI
Finance
- HOA & community: Short term rentals allowed
Exterior
- Utilities: Public sewer
- Home design: Single-story double wide mobile home
- Construction: Wood siding and wood frame construction; Metal roof
- Exterior features: Open porch
Interior
- Bedrooms: Two bedrooms on the first level; Primary bedroom on the first level
- Bathrooms: One full bathroom on the first level; One half bathroom on the first level
- Heating & cooling: Central heating; Central air conditioning
- Interior features: Total of 5 rooms
Neighborhood map
What this means for you Summary
Snapshot
- This is a 3-bed/2.0-bath manufactured listed at $86k.
Deal economics
- At list price, monthly cash flow is $1k ($13k/yr) — positive.
- The deal already cash-flows at list — no discount required.
- Meets the 1% rule at list price ($2k rent vs $86k).
- Cap rate 21.8% vs local median 5.1% in Callaway — top-decile yield for the area; either an underpriced asset or a hidden risk that comps aren't pricing in. Stress-test before assuming the spread holds.
Location & tenants
- Location reads 64/100 on livability (#690 in FL) — a middle-class / working-renter tenant base. Strengths: cost of living A+, housing A+; Watch: employment D+, amenities F, commute F.
- Bay (suburban): math 51% / reading 51% proficiency, ranked #29 of 73 in FL (top 40%) — acceptable for families but not a draw, mixed tenant base, ~2y average lease.
- Zoned schools: Parker Elementary School (math 24% / reading 32%, grade F, #1,951 of 2,144 statewide, top 91%, 496 students, 74% FRL); Rutherford High School (math 24% / reading 29%, grade F, #489 of 667 statewide, top 74%, 1,337 students, 63% FRL) — zoned schools average 69% FRL vs 48% district-wide (20 pts higher); higher-poverty schools than district average — tighter screening recommended.
- Zoned-school proficiency averages 27% at this address vs 51% district-wide (-24 pts) — the specific schools serving this property underperform the Bay average; the district grade overstates school quality for this exact location.
- Market conditions: Rents rising (+1.1%/yr); 983 active listings in the ZIP; 14 comparable units currently listed for rent nearby; rentals at typical pace (median 23d on market — plan ~3-4 weeks tenant-placement turnaround); 2,473 units permitted in Bay County in 2024 (559 in 5+ unit buildings).
Forward outlook
- Local home prices are declining (-3.0%/yr); year-one equity from $595 of loan paydown is wiped out by about $3k of value loss. Plan a longer hold.
- Bay County population projected at +24% by 2050 — long-run rental-demand tailwind backs the buy-and-hold thesis.
- At projected returns (-3.0% appreciation + 1.1% rent growth), your $24k cash investment doubles in ~3 years — after that, you're playing with house money.
Negotiation context
- Only 12 days on market — expect competitive offers; lowballing is unlikely to land.
- 5 sale attempts since 30y ago with the ask held roughly flat each time — persistent listings suggest the price (not the market) is what's stuck; bring a comps-based counter.
- Current owner paid $48k; list at $86k implies a 79% gain — meaningful room to come down on a strong offer.
Risks & watch-outs
- Watch-outs: flood insurance adds $66/mo.
- Climate carrying-cost: major flood risk; severe wind risk, 99% chance of damaging wind over 30y; extreme-heat days projected 7→21/yr by 2055 (HVAC capex compounding) — expect insurance premiums to compound above CPI over the hold.
Questions for the listing agent
- Built in 1977 — when were the roof, HVAC, electrical panel, plumbing, and water heater last replaced?
- What's the actual annual flood-insurance premium (NFIP or private), and is the property in a SFHA with mandatory coverage?
- Is there a deadline driving the sale (1031 exchange, divorce, estate, relocation)? That informs how much negotiation room exists.
- Schools are F-rated, which usually means shorter tenancies and higher turnover. Who's the typical renter profile here, and what's been the actual vacancy rate?
- What's the average days-on-market for RENTAL listings here right now (not sales)? A rising rental-DOM trend means longer vacancies and softer asking-rent achievability than the comps imply.
- What's the recent tenant-quality profile in this submarket — average credit score on applications, eviction rate, late-payment / NSF rate, and stable-employment percentage? A property-management company in the area should have these aggregated.
- How much new for-sale + rental construction is in the pipeline within 1–3 miles? Heavy new supply typically softens prices + rents 12–24 months out; constrained supply supports both.
Investment metrics
- 1% rule
- 2.46% ✓
- Cap rate
- 21.83%
- Cash-on-cash
- 55.50%
- DSCR
- 3.47
- GRM
- 3.4
CMA / ARV
- ARV (median comp)
- $171,567
- List price
- $86,000
- Delta
- -44.63%
- Verdict
- UNDERPRICED
- Comps
- 16 within 2.0 mi
Projected returns pro-forma
-3.0% appreciation · 1.12% rent growth · sell at horizon
- IRR
- 48.0%
- Equity multiple
- 3.03×
- Total profit
- $48,892
- Equity at exit
- $12,823
- IRR
- 52.8%
- Equity multiple
- 5.70×
- Total profit
- $113,154
- Equity at exit
- $7,436
Cash invested: $24,080 (down + closing). Projections, not guarantees.
Landlord ↔ Tenant lean methodology
- Overall (STATE)
- 87 Strongly Landlord-Friendly
- State Florida
- 87 Strongly Landlord-Friendly · R+3
- County
- — inherits STATE
- City
- — inherits STATE
ZIP-level market 32404
- Home prices YoY
- -16.1%
- Rents YoY
- 1.1%
- Active inventory
- 983
- Price-to-rent
- 3.4×
Monthly cashflow live
- Estimated rent
- $2,114 high interval (Pro) →
- Mortgage (P&I)
- −$451
- Tax from tax record
- −$70 /mo · $837/yr
- Insurance
- −$36
- Flood insurance flood zone
- −$66 /mo · $798/yr
- HOA
- −$0
- Vacancy / Maint / Mgmt
- −$444
- Net cashflow
- $1,047
Break-even live
Sensitivity live
| Price | -10% $1,096 | -5% $1,072 | +0% $1,047 | +5% $1,023 | +10% $999 |
|---|---|---|---|---|---|
| Rent | -10% $880 | -5% $964 | +0% $1,047 | +5% $1,131 | +10% $1,214 |
| Rate | -1.0pp $1,091 | -0.5pp $1,069 | base $1,047 | +0.5pp $1,025 | +1.0pp $1,002 |
UW: 25.0% down · 7.5% · 30yr · 1.5% tax · 5.0% vac · 8.0% maint · 8.0% mgmt
Financing live
Cash to close
- Down payment
- $21,500
- Closing costs
- $2,580
- Reserves months
- —
- Total cash needed
- —
Loan-product check · same deal, 3 products live
Conventional
25% down · 7.5% · 30yr
- Down + closing
- —
- Monthly P&I
- —
- Monthly cashflow
- —
- DSCR
- —
- Eligible?
- —
Personal DTI + credit; lowest rate.
DSCR
20% down · 8.5% · 30yr
- Down + closing
- —
- Monthly P&I
- —
- Monthly cashflow
- —
- DSCR
- —
- Eligible?
- —
No personal income docs; deal must DSCR.
Hard money
10% down · 12.0% · 12mo
- Down + closing
- —
- Monthly P&I
- —
- Monthly cashflow
- —
- DSCR
- —
- Eligible?
- —
Short-term bridge; refi at stabilization.
Rent comps 14 comps
| Address | Beds | Baths | Sqft | Rent | $/sqft | DOM | Units | Dist |
|---|---|---|---|---|---|---|---|---|
| 907 Lee Ct Panama City, FL | 3.0 | 3.0 | 2126 | $2,100 | $0.99 | 22d | 1 | 0.41mi |
| 133 Red Bay Rd Panama City, FL | 4.0 | 2.0 | 2208 | $2,500 | $1.13 | 22d | 1 | 0.54mi |
| 140 Carriage Rd Panama City, FL | 4.0 | 3.5 | 2147 | $2,800 | $1.30 | 22d | 1 | 0.58mi |
| 1128 S Gay Ave Lot 146 Panama City, FL | 3.0 | 2.0 | 1536 | $20,000 | $13.02 | 22d | 1 | 0.72mi |
| 1128 S Gay Ave Lot V Panama City, FL | 3.0 | 2.0 | 1152 | $30,000 | $26.04 | 22d | 1 | 0.72mi |
| 1128 S Gay Ave Lot 86 Panama City, FL | 3.0 | 2.0 | 1216 | $94,995 | $78.12 | 22d | 1 | 0.72mi |
| 1128 S Gay Ave Lot 56 Panama City, FL | 3.0 | 1.5 | 1216 | $35,000 | $28.78 | 22d | 1 | 0.72mi |
| 5717 Rebecca Ct Unit B Panama City, FL | 2.0 | 1.0 | 1612 | $1,350 | $0.84 | 22d | 1 | 1.13mi |
| 5813 Hickory St Panama City, FL | 3.0 | 2.0 | 1200 | $1,950 | $1.62 | 22d | 1 | 1.16mi |
| 6328 Olokee St Panama City, FL | 3.0 | 2.0 | 1131 | $1,850 | $1.64 | 15d | 1 | 1.22mi |
| 7709 Betty Louise Dr Panama City, FL | 3.0 | 2.0 | 1310 | $1,800 | $1.37 | 22d | 1 | 1.27mi |
| 114 S Kimbrel Ave Panama City, FL | 3.0 | 2.0 | 1400 | $1,850 | $1.32 | 22d | 1 | 1.37mi |
| 7727 Betty Louise Dr Panama City, FL | 3.0 | 2.0 | 1430 | $1,950 | $1.36 | 22d | 1 | 1.37mi |
| 509 Phillips Ct Panama City, FL | 3.0 | 2.0 | 1411 | $1,700 | $1.20 | 15d | 1 | 1.37mi |
Listing history 29 events
-
2026-06-21days on market $86,000 Active 12 DOM
-
2026-06-19days on market $86,000 Active 10 DOM
-
2026-06-18days on market $86,000 Active 9 DOM
-
2026-06-18price $86,000 Active 8 DOM
-
2026-06-17days on market $87,000 Active 8 DOM
-
2026-06-16days on market $87,000 Active 7 DOM
-
2026-06-15price $87,000 Active 6 DOM
-
2026-06-15days on market $89,000 Active 6 DOM
-
2026-06-14days on market $89,000 Active 4 DOM
-
2026-06-13days on market $89,000 Active 3 DOM
-
2026-06-10pricedays on market $89,000 Active 1 DOM
-
2026-06-05days on market $95,000 Active 113 DOM
-
2026-06-03days on market $95,000 Active 112 DOM
-
2026-06-03price $95,000 Active 111 DOM
-
2026-06-02days on market $105,000 Active 111 DOM
-
2026-06-01pricedays on market $105,000 Active 110 DOM
-
2026-05-31days on market $115,000 Active 109 DOM
-
2026-05-30days on market $115,000 Active 108 DOM
-
2026-03-29price $115,000 554-char remark
-
2026-03-08price $120,000 554-char remark
-
2026-02-11$125,000 Active 554-char remark
-
2021-12-09historical
-
2021-12-09historical
-
2001-04-16$52,900
-
2000-08-25$66,000
-
1997-08-01soldstatus $48,000
-
1996-07-25soldstatus $42,900
-
1996-07-01soldstatus $42,857
-
1996-06-17$44,900
ⓘ Source: listings_history table (triggers on properties + properties_extension) + one-shot
backfill from property_details.listing_events for pre-trigger history.
Tax reassessment forecast FL · Resets to sale price
- Current annual tax
- $837 · $70/mo
- Projected year-2 tax
- $837 · $70/mo
- Expected delta
- $0/yr ($0/mo · 0.0%)
ⓘ Screening estimate from a state-policy table — verify with the county assessor before closing.
Climate risk First Street
- Flood 7/10 Severe FEMA zone X (unshaded) · 74% chance over 30 yrs
- Wildfire 4/10 Moderate
- Heat 10/10 Extreme 7 d/yr ≥104°F today · 21 d/yr by 30 yrs out
- Wind 10/10 Extreme 99% chance of damaging wind over 30 yrs
- Air quality 1/10 Low 0 unhealthy d/yr today · 0 by 30 yrs out
Nearby sold comps map
Loading sold comps map…
Walkable amenities ~0.75 mi
Loading nearby amenities…
Taxation est. · year 1
- Rental income
- $25,372
- − Mortgage interest
- −$4,817
- − Property taxes
- −$837
- − Insurance
- −$1,228
- − Repairs & maintenance
- −$2,030
- − Management
- −$2,030
- − Depreciation
- −$2,502
- Taxable income
- $11,929
- Est. tax owed @ 24.0%
- −$2,863
- After-tax cash flow
- $9,705/yr
For passive investors: Depreciation is non-cash, so a rental often shows a tax loss while cash-flowing — sheltering income. Rental losses are passive: they offset passive income freely, and up to $25,000/yr can offset ordinary (W-2) income if you actively participate and your MAGI is under $100k (phasing out to $0 by $150k); unused losses carry forward. On sale, claimed depreciation is recaptured at up to 25%, and gains may owe capital-gains tax (a 1031 exchange can defer both). Figures are a year-1 estimate at your 24.0% rate — not tax advice; consult a CPA.
Schools (NCES district)
- District
- Bay
- NCES district ID
- 1200090
- Math proficiency
- 51% ▼ -8.00%
- Reading proficiency
- 51% ▼ -7.00%
- Median HH income
- $47,740
- Composite
- 43.41/100
- National rank
- #3014
- State rank
- #29 of 73 in FL
Livability — Callaway
- Score
- 64/100
- State rank
- #690
- US rank
- #14384
Category grades
Schools grade is shown separately in the Schools card above.
Census & demographics
- Census place
- Callaway, FL
- County
- Bay County · 163,593 people
- Metro
- Panama City, FL
- Population (ZIP)
- 42,514
- Household income
- $74,708
- Rent vs Own
- Severe rent burden
- 1218.0
Population outlook (Bay County) Hauer SSP2
- Today (2025)
- 206,264 people
- By 2030
- 217,740 · +5.6%
- By 2040
- 238,738 · +15.7%
- By 2050
- 255,545 · +23.9%
- By 2075
- 288,295 · +39.8%
- By 2100
- 288,638 · +39.9%
Race, ethnicity, and origin ACS 2023
- Neighborhood character
- Predominantly White (69%)
- Race & ethnicity
- White 69% Black 12% Two or more races 10% Hispanic / Latino 9% Asian 3%
- Hispanic origin (detail)
- Mexican 2% Puerto Rican 3%
- Common ancestry
- Lithuanian 3% Slovak 2% Italian 2%
- Foreign-born
- 7% · Canada, Vietnam, Mexico
- Languages at home
- 90% English-only · Spanish 6% Vietnamese 1% Other Asian/Pacific 1%
Political lean MEDSL · Bay
- 2024 margin
- Solid R (+47.4) · D 25.8% · R 73.1% · Other 1.1%
- 2008→2024 swing
- -6.6pp toward R · 2008: -40.7pp · 2024: -47.4pp
- All cycles
- 2024: R+47.4 2020: R+43.5 2016: R+46.3 2012: R+43.6 2008: R+40.7
Not yet ingested
- Civics
- —
Market trends
- HPI YoY
- ▼ -50.59%
- Current HPI
- 263.7178
- Rent YoY
- ▲ 1.12%
- Metro
- Panama City, FL
- State GDP YoY
- ▲ 3.28%
- F500 in state
- 36
Industry mix (Fortune 500 HQ in FL)
| Industry | F500 HQs | Revenue |
|---|---|---|
| Industrial Technology | 2 | $29B |
|
||
| Insurance | 2 | $17B |
|
||
| Retail | 1 | $60B |
|
||
| Technology Distribution | 1 | $58B |
|
||
| Homebuilding | 1 | $35B |
|
||
| Technology Manufacturing | 1 | $35B |
|
||
Price history
+91.5% since first listed16 events — show timeline
- 2026-06-18 Price Changed $86,000 CPARMLS
- 2026-06-15 Price Changed $87,000 CPARMLS
- 2026-06-08 Listed $89,000 CPARMLS
- 2026-06-02 Price Changed $95,000 CPARMLS
- 2026-06-01 Price Changed $105,000 CPARMLS
- 2026-03-29 Price Changed $115,000 CPARMLS
- 2026-03-08 Price Changed $120,000 CPARMLS
- 2026-02-11 Listed $125,000 CPARMLS
- 2021-12-09 Listing Removed — CPARMLS
- 2021-12-09 Listing Removed — CPARMLS
- 2001-04-16 Listed $52,900 CPARMLS
- 2000-08-25 Listed $66,000 CPARMLS
- 1997-08-01 Sold (Public Records) $48,000 Public Records
- 1996-07-25 Sold (MLS) $42,900 CPARMLS
- 1996-07-01 Sold (Public Records) $42,857 Public Records
- 1996-06-17 Listed $44,900 CPARMLS
Property tax history
+2.0%/yrLatest (2025): $837 · +3.8% YoY. Source: county tax records.
Cash-flow waterfall
monthlySold comps — $/sqft
last 12 mo · ≤1 miLoading sold comps…