19511 Blanco Dr · Lago Vista, TX
Flood risk 1/10 · Minimal
- FEMA flood zone
- X (unshaded)
- Chance of flooding over 30 yrs
- 0.0%
- Est. flood insurance / yr
- $507 – $1,088
Fire risk 4/10 · Minor
- Est. fire insurance / yr
- $1,222 – $2,270
Heat risk 8/10 · Major
- Hot days now (above 107°F)
- 7 days/yr
- Hot days in 30 yrs
- 23 days/yr
Wind risk 6/10 · Moderate
- Chance of severe wind over 30 yrs
- 68.0%
Air-quality risk 1/10 · Minimal
- Unhealthy air days now
- 0 days/yr
- Unhealthy air days in 30 yrs
- 0 days/yr
Risk factors via First Street. Map © Google.
Why this score? — see what drove the D- grade
The composite is a weighted blend of 9 inputs, each scored 0–100. Each bar is that input's sub-score; the figure is the points it added to the 100-point composite (weight × sub-score).
- Cash flow +11.7/30.0
- ARV discount +7.5/15.0
- Schools +3.8/10.0
- Livability +3.6/5.0
- DSCR +3.4/10.0
- Rent growth +3.2/5.0
- 1% rule +2.8/10.0
- Condition / age +2.5/5.0
- Appreciation +0.0/10.0
$249,000
🖨 Deal sheet (PDF) 📄 Offer letter ✓ Due diligence
Listing remarks MLS
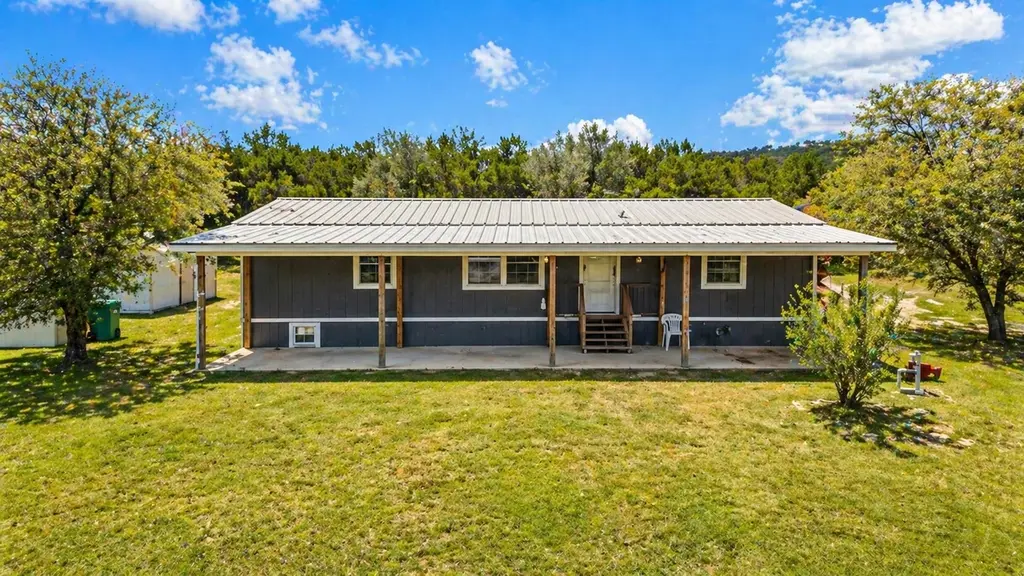
Fixer upper with a great view. This home can be brought back to life and become a home to be enjoyed for years to come. This home has great potential and is sold AS-IS.
Key facts
- Natural light
- Panoramic views
- Covered front patio
Tags
Property features AI
Exterior
- Parking: Gravel parking; 5 parking spaces
- Utilities: Electricity connected; Sewer connected (septic tank); Water connected (shared well)
- Home design: Single-story home; Resale property; Pillar/post/pier foundation
- Construction: Board and batten siding; Metal roof; Built according to public records
- Exterior features: Rear covered porch; Patio; Sloped up lot with few trees; Has view; Faces northeast
Interior
- Kitchen: Free-standing electric range; Free-standing refrigerator; Stainless steel appliances; Quartz counters; Eat-in kitchen
- Bedrooms: 3 main level bedrooms
- Flooring: Vinyl flooring
- Bathrooms: 2 full bathrooms
- Heating & cooling: Central air conditioning; Electric heating; Hot water heating
- Interior features: Open floorplan; Eat-in kitchen; In-law floorplan; Main level primary bedroom; Double vanity; Quartz counters; Walk-in closet(s); Vinyl windows
- Laundry & utility: Laundry room; Electric water heater
Neighborhood map
What this means for you Summary
Snapshot
- This is a 3-bed/2.0-bath manufactured listed at $249k.
Deal economics
- At list price, monthly cash flow is $-75 ($-896/yr) — negative.
- To cash-flow at today's rent, offer at most $236k (5.3% below list).
- To meet the 1% rule (rent ≥ 1% of price), the offer needs to be $195k (21.7% below list).
- Recommended offer: $195k (21.7% below list) — sets the bar for 1% rule.
- Cap rate 5.9% vs local median 2.2% in Lago Vista — top-decile yield for the area; either an underpriced asset or a hidden risk that comps aren't pricing in. Stress-test before assuming the spread holds.
Location & tenants
- Location reads 72/100 on livability (#275 in TX) — a middle-class / working-renter tenant base. Strengths: crime A+, employment A+, housing A+; Watch: amenities F, commute F, health & safety F.
- Lago Vista ISD (rural): math 33% / reading 51% proficiency, ranked #269 of 826 in TX (top 33%) — families likely to look elsewhere, expect single-tenant / working-renter base with shorter leases.
- Zoned schools: Lago Vista El (math 32% / reading 47%, grade F, #1,545 of 4,322 statewide, top 38%, 502 students, 34% FRL); Lago Vista Middle (math 28% / reading 47%, grade F, #736 of 1,662 statewide, top 45%, 433 students, 25% FRL); Lago Vista H S (math 42% / reading 57%, grade D, #509 of 1,632 statewide, top 34%, 636 students, 22% FRL) — zoned schools at 27% FRL track the district average.
- Market conditions: Rents rising (+3.0%/yr); 1101 active listings in the ZIP; 18 comparable units currently listed for rent nearby; rentals at typical pace (median 20d on market — plan ~3-4 weeks tenant-placement turnaround); high-income renter base; 17,121 units permitted in Travis County in 2024 (11,963 in 5+ unit buildings).
Forward outlook
- Local home prices are declining (-3.0%/yr); year-one equity from $2k of loan paydown is wiped out by about $7k of value loss. Plan a longer hold.
- Travis County population projected at +60% by 2050 — long-run rental-demand tailwind backs the buy-and-hold thesis.
Negotiation context
- It's been on market 53 days — a 3% lower offer ($242k) is reasonable based on typical stale-listing flexibility.
- 5 sale attempts since 24y ago with the ask held roughly flat each time — persistent listings suggest the price (not the market) is what's stuck; bring a comps-based counter.
Risks & watch-outs
- Climate carrying-cost: major wind risk, 68% chance of damaging wind over 30y; extreme-heat days projected 7→23/yr by 2055 (HVAC capex compounding) — expect insurance premiums to compound above CPI over the hold.
Questions for the listing agent
- What do current leases actually rent for vs. the listed asking? Can we see a recent rent roll and the last 12 months of T-12 income?
- It's been on market 53 days. Have you received any prior offers? Is the seller open to a 22% concession, seller financing, or rate buy-down credit?
- Is there a deadline driving the sale (1031 exchange, divorce, estate, relocation)? That informs how much negotiation room exists.
- The area grade is low — what's the realistic commute time and amenity access for the typical tenant pool here? Any planned neighborhood developments (good or bad) we should know about?
- What's the average days-on-market for RENTAL listings here right now (not sales)? A rising rental-DOM trend means longer vacancies and softer asking-rent achievability than the comps imply.
- What's the recent tenant-quality profile in this submarket — average credit score on applications, eviction rate, late-payment / NSF rate, and stable-employment percentage? A property-management company in the area should have these aggregated.
- How much new for-sale + rental construction is in the pipeline within 1–3 miles? Heavy new supply typically softens prices + rents 12–24 months out; constrained supply supports both.
Investment metrics
- 1% rule
- 0.78% ✗
- Cap rate
- 5.93%
- Cash-on-cash
- -1.29%
- DSCR
- 0.94
- GRM
- 10.6
CMA / ARV
No comps found within radius.
Projected returns pro-forma
-3.0% appreciation · 2.98% rent growth · sell at horizon
- IRR
- -18.5%
- Equity multiple
- 0.35×
- Total profit
- $-45,180
- Equity at exit
- $37,127
- IRR
- -10.9%
- Equity multiple
- 0.34×
- Total profit
- $-45,773
- Equity at exit
- $21,529
Cash invested: $69,720 (down + closing). Projections, not guarantees.
Landlord ↔ Tenant lean methodology
- Overall (STATE)
- 87 Strongly Landlord-Friendly
- State Texas
- 87 Strongly Landlord-Friendly · R+5
- County
- — inherits STATE
- City
- — inherits STATE
ZIP-level market 78645
- Home prices YoY
- -31.6%
- Rents YoY
- 3.0%
- Active inventory
- 1101
- Price-to-rent
- 10.6×
Monthly cashflow live
- Estimated rent
- $1,949 high interval (Pro) →
- Mortgage (P&I)
- −$1,306
- Tax from tax record
- −$205 /mo · $2,461/yr
- Insurance
- −$104
- HOA
- −$0
- Vacancy / Maint / Mgmt
- −$409
- Net cashflow
- $-75
Break-even live
Sensitivity live
| Price | -10% $66 | -5% $-4 | +0% $-75 | +5% $-145 | +10% $-216 |
|---|---|---|---|---|---|
| Rent | -10% $-229 | -5% $-152 | +0% $-75 | +5% $2 | +10% $79 |
| Rate | -1.0pp $51 | -0.5pp $-11 | base $-75 | +0.5pp $-139 | +1.0pp $-205 |
UW: 25.0% down · 7.5% · 30yr · 1.5% tax · 5.0% vac · 8.0% maint · 8.0% mgmt
Financing live
Cash to close
- Down payment
- $62,250
- Closing costs
- $7,470
- Reserves months
- —
- Total cash needed
- —
Loan-product check · same deal, 3 products live
Conventional
25% down · 7.5% · 30yr
- Down + closing
- —
- Monthly P&I
- —
- Monthly cashflow
- —
- DSCR
- —
- Eligible?
- —
Personal DTI + credit; lowest rate.
DSCR
20% down · 8.5% · 30yr
- Down + closing
- —
- Monthly P&I
- —
- Monthly cashflow
- —
- DSCR
- —
- Eligible?
- —
No personal income docs; deal must DSCR.
Hard money
10% down · 12.0% · 12mo
- Down + closing
- —
- Monthly P&I
- —
- Monthly cashflow
- —
- DSCR
- —
- Eligible?
- —
Short-term bridge; refi at stabilization.
Rent comps 18 comps
| Address | Beds | Baths | Sqft | Rent | $/sqft | DOM | Units | Dist |
|---|---|---|---|---|---|---|---|---|
| 20103 Park Strip St Unit A Lago Vista, TX | 3.0 | 2.0 | 1519 | $1,795 | $1.18 | 6d | 1 | 0.55mi |
| 20105 Park Strip St Unit B Lago Vista, TX | 3.0 | 2.0 | 1519 | $1,850 | $1.22 | 45d | 1 | 0.57mi |
| 20107 Park Strip St Unit B Lago Vista, TX | 3.0 | 2.0 | 1532 | $1,900 | $1.24 | 19d | 1 | 0.59mi |
| 20111 Travis Dr Unit A Lago Vista, TX | 2.0 | 2.0 | 1000 | $1,745 | $1.75 | 19d | 1 | 0.61mi |
| 20111 Travis Dr Unit B Lago Vista, TX | 2.0 | 2.0 | 1075 | $1,745 | $1.62 | 6d | 1 | 0.61mi |
| 5509 Thunderbird St Apt B Lago Vista, TX | 2.0 | 2.0 | 950 | $1,450 | $1.53 | 19d | 1 | 1.03mi |
| 20507 Bonanza Lago Vista, TX | 3.0 | 2.5 | 1451 | $1,895 | $1.31 | 45d | 1 | 1.03mi |
| 20600 Bonanza Unit 4 Leander, TX | 2.0 | 1.0 | 1062 | $1,300 | $1.22 | 22d | 1 | 1.06mi |
| 20600 Bonanza Unit 3 Leander, TX | 4.0 | 1.5 | 1143 | $1,450 | $1.27 | 4d | 1 | 1.06mi |
| 5211 Thunderbird St Unit B Lago Vista, TX | 3.0 | 1.5 | 1500 | $1,550 | $1.03 | 19d | 1 | 1.15mi |
| 5205 Thunderbird Lago Vista, TX | 3.0 | 2.0 | 1527 | $2,100 | $1.38 | 25d | 1 | 1.18mi |
| 19903 Lincoln Cv Lago Vista, TX | 4.0 | 2.0 | 1813 | $2,250 | $1.24 | 19d | 1 | 1.32mi |
| 5909 Lago Vista Way Unit B Lago Vista, TX | 2.0 | 2.0 | 918 | $1,645 | $1.79 | 19d | 1 | 1.33mi |
| 5909 Lago Vista Way Unit D Lago Vista, TX | 2.0 | 2.0 | 918 | $1,545 | $1.68 | 19d | 1 | 1.33mi |
| 5102 Moss Pt Lago Vista, TX | 3.0 | 2.0 | 1801 | $2,250 | $1.25 | 25d | 1 | 1.40mi |
| 5914 Lago Vista Way Unit C23 Lago Vista, TX | 2.0 | 2.0 | 1037 | $1,295 | $1.25 | 25d | 1 | 1.43mi |
| 20703 Ridgeview Rd Lago Vista, TX | 3.0 | 2.0 | 1813 | $2,200 | $1.21 | 6d | 1 | 1.45mi |
| 5916 Lago Vista Way Unit B-10 UP Lago Vista, TX | 2.0 | 2.0 | 1110 | $1,295 | $1.17 | 45d | 1 | 1.45mi |
Listing history 29 events
-
2026-06-21days on market $249,000 Active 53 DOM
-
2026-06-18days on market $249,000 Active 50 DOM
-
2026-06-17days on market $249,000 Active 49 DOM
-
2026-06-16days on market $249,000 Active 48 DOM
-
2026-06-15days on market $249,000 Active 47 DOM
-
2026-06-13days on market $249,000 Active 45 DOM
-
2026-06-09days on market $249,000 Active 41 DOM
-
2026-06-08days on market $249,000 Active 40 DOM
-
2026-06-07days on market $249,000 Active 39 DOM
-
2026-06-04days on market $249,000 Active 36 DOM
-
2026-06-03days on market $249,000 Active 35 DOM
-
2026-06-02days on market $249,000 Active 34 DOM
-
2026-06-01days on market $249,000 Active 33 DOM
-
2026-05-31days on market $249,000 Active 32 DOM
-
2026-04-29$249,000 Active 706-char remark
-
2018-01-19soldstatus Sold 168-char remark
Show marketing remark (168 chars)
Fixer upper with a great view. This home can be brought back to life and become a home to be enjoyed for years to come. This home has great potential and is sold AS-IS.
-
2018-01-19soldstatus
Show marketing remark (168 chars)
Fixer upper with a great view. This home can be brought back to life and become a home to be enjoyed for years to come. This home has great potential and is sold AS-IS.
-
2018-01-08status Pending - Taking Backups 168-char remark
Show marketing remark (168 chars)
Fixer upper with a great view. This home can be brought back to life and become a home to be enjoyed for years to come. This home has great potential and is sold AS-IS.
-
2018-01-06$69,700 Active 168-char remark
Show marketing remark (168 chars)
Fixer upper with a great view. This home can be brought back to life and become a home to be enjoyed for years to come. This home has great potential and is sold AS-IS.
-
2017-12-31historical $69,700 168-char remark
Show marketing remark (168 chars)
Fixer upper with a great view. This home can be brought back to life and become a home to be enjoyed for years to come. This home has great potential and is sold AS-IS.
-
2003-10-13soldstatus
-
2003-09-29soldstatus
-
2003-09-15historical
-
2003-03-30$54,000
-
2003-02-14soldstatus
-
2003-01-13historical
-
2002-12-01$39,900
-
2002-11-30historical
-
2002-09-06
ⓘ Source: listings_history table (triggers on properties + properties_extension) + one-shot
backfill from property_details.listing_events for pre-trigger history.
Tax reassessment forecast TX · Resets to sale price
- Current annual tax
- $2,461 · $205/mo
- Projected year-2 tax
- $4,557 · $380/mo
- Expected delta
- +$2,096/yr (+$175/mo · 85.2%)
ⓘ Screening estimate from a state-policy table — verify with the county assessor before closing.
Climate risk First Street
- Flood 1/10 Low FEMA zone X (unshaded) · 0% chance over 30 yrs
- Wildfire 4/10 Moderate
- Heat 8/10 Severe 7 d/yr ≥107°F today · 23 d/yr by 30 yrs out
- Wind 6/10 Major 68% chance of damaging wind over 30 yrs
- Air quality 1/10 Low 0 unhealthy d/yr today · 0 by 30 yrs out
Nearby sold comps map
Loading sold comps map…
Walkable amenities ~0.75 mi
Loading nearby amenities…
Taxation est. · year 1
- Rental income
- $23,391
- − Mortgage interest
- −$13,948
- − Property taxes
- −$2,461
- − Insurance
- −$1,245
- − Repairs & maintenance
- −$1,871
- − Management
- −$1,871
- − Depreciation
- −$7,244
- Taxable loss
- −$5,249
- Est. tax savings @ 24.0%
- +$1,260
- After-tax cash flow
- $364/yr
For passive investors: Depreciation is non-cash, so a rental often shows a tax loss while cash-flowing — sheltering income. Rental losses are passive: they offset passive income freely, and up to $25,000/yr can offset ordinary (W-2) income if you actively participate and your MAGI is under $100k (phasing out to $0 by $150k); unused losses carry forward. On sale, claimed depreciation is recaptured at up to 25%, and gains may owe capital-gains tax (a 1031 exchange can defer both). Figures are a year-1 estimate at your 24.0% rate — not tax advice; consult a CPA.
Schools (NCES district)
- District
- Lago Vista ISD
- NCES district ID
- 4826400
- Math proficiency
- 33% ▼ -24.00%
- Reading proficiency
- 51% ▼ -11.00%
- Median HH income
- $73,671
- Composite
- 38.35/100
- National rank
- #4216
- State rank
- #269 of 826 in TX
Livability — Lago Vista
- Score
- 72/100
- State rank
- #275
- US rank
- #6393
Category grades
Schools grade is shown separately in the Schools card above.
Census & demographics
- County
- Travis County · 1,299,254 people
- City population
- 15,256
- Metro
- Austin-Round Rock-Georgetown, TX
- Population (ZIP)
- 15,256
- Household income
- $113,008
- Rent vs Own
- Severe rent burden
- 20.0
Population outlook (Travis County) Hauer SSP2
- Today (2025)
- 1,545,133 people
- By 2030
- 1,729,269 · +11.9%
- By 2040
- 2,097,596 · +35.8%
- By 2050
- 2,463,890 · +59.5%
- By 2075
- 3,249,374 · +110.3%
- By 2100
- 3,801,868 · +146.1%
Race, ethnicity, and origin ACS 2023
- Neighborhood character
- Predominantly White (73%)
- Race & ethnicity
- White 73% Hispanic / Latino 19% Two or more races 11% Black 2%
- Hispanic origin (detail)
- Mexican 15%
- Common ancestry
- Italian 7% Slovak 4% Lithuanian 4%
- Foreign-born
- 10% · Canada
- Languages at home
- 85% English-only · Spanish 12% Other Indo-European 1% German/W. Germanic 1%
Political lean MEDSL · Travis
- 2024 margin
- Solid D (+39.3) · D 68.8% · R 29.4% · Other 1.8%
- 2008→2024 swing
- +9.9pp toward D · 2008: 29.4pp · 2024: 39.3pp
- All cycles
- 2024: D+39.3 2020: D+45.0 2016: D+38.9 2012: D+23.9 2008: D+29.4
Not yet ingested
- Civics
- —
Market trends
- HPI YoY
- ▼ -98.02%
- Current HPI
- 211.9678
- Rent YoY
- ▲ 2.98%
- Metro
- Austin-Round Rock-Georgetown, TX
- State GDP YoY
- ▲ 3.95%
- F500 in state
- 110
Industry mix (Fortune 500 HQ in TX)
| Industry | F500 HQs | Revenue |
|---|---|---|
| Energy | 16 | $1,198B |
|
||
| Technology | 5 | $198B |
|
||
| Engineering / Construction | 4 | $72B |
|
||
| Energy Services | 3 | $60B |
|
||
| Utilities | 3 | $41B |
|
||
| Healthcare | 2 | $330B |
|
||
Price history
+524.1% since first listed15 events — show timeline
- 2026-04-29 Listed $249,000 Unlock MLS
- 2018-01-19 Sold (Public Records) — Public Records
- 2018-01-19 Sold (MLS) — Unlock MLS
- 2018-01-08 Pending — Unlock MLS
- 2018-01-06 Listed $69,700 Unlock MLS
- 2017-12-31 Coming Soon $69,700 Unlock MLS
- 2003-10-13 Sold (Public Records) — Public Records
- 2003-09-29 Sold (MLS) — Unlock MLS
- 2003-09-15 Delisted — Unlock MLS
- 2003-03-30 Listed $54,000 Unlock MLS
- 2003-02-14 Sold (MLS) — Unlock MLS
- 2003-01-13 Delisted — Unlock MLS
- 2002-12-01 Listed $39,900 Unlock MLS
- 2002-11-30 Delisted — Unlock MLS
- 2002-09-06 Listed — Unlock MLS
Property tax history
+7.6%/yrLatest (2026): $2,461 · -18.5% YoY. Source: county tax records.
Cash-flow waterfall
monthlySold comps — $/sqft
last 12 mo · ≤1 miLoading sold comps…