10302 Bluegill Way · San Antonio, TX
Flood risk No data
- FEMA flood zone
- —
- Chance of flooding over 30 yrs
- —
- Est. flood insurance / yr
- —
Fire risk No data
- Est. fire insurance / yr
- —
Heat risk No data
- Hot days now (above threshold)
- —
- Hot days in 30 yrs
- —
Wind risk No data
- Chance of severe wind over 30 yrs
- —
Air-quality risk No data
- Unhealthy air days now
- —
- Unhealthy air days in 30 yrs
- —
Risk factors via First Street. Map © Google.
Why this score? — see what drove the D- grade
The composite is a weighted blend of 9 inputs, each scored 0–100. Each bar is that input's sub-score; the figure is the points it added to the 100-point composite (weight × sub-score).
- Appreciation +10.0/10.0
- Cash flow +8.1/30.0
- Livability +4.0/5.0
- ARV discount +3.6/15.0
- 1% rule +2.7/10.0
- Rent growth +2.7/5.0
- Condition / age +2.5/5.0
- Schools +2.2/10.0
- DSCR +2.1/10.0
$249,999
🖨 Deal sheet 📄 Offer letter ✓ Due diligence
Listing remarks
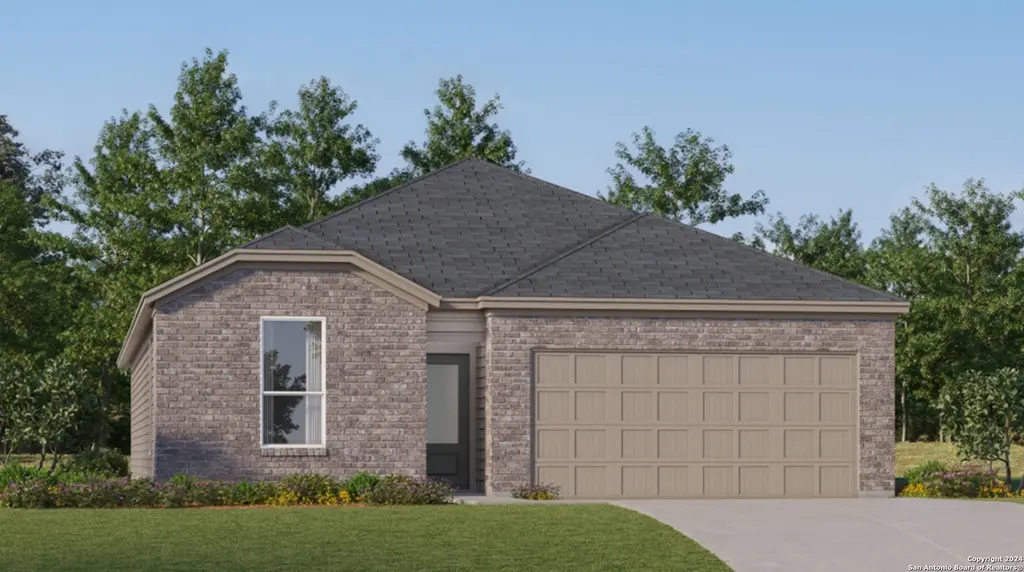
The Clearwater - This new single-level home is host to an inviting open-concept floorplan with convenient access to a covered patio, ready for seamless entertaining and multitasking. Three secondary bedrooms are located off the foyer, with the luxe owner's suite tucked into a private rear corner, complete with a spa-inspired bathroom and walk-in closet. Prices and features may vary and are subject to change. Photos are for illustrative purposes only. Estimated Completion July 2026. The completion date, prices and features may vary and are subject to change. Please verify with Lennar directly. Photos are for illustrative purposes only.
Key facts
- 4,791 sq ft lot
- 2 garage spots
- Built 2026
Property features AI
Finance
- HOA & community: Mandatory HOA with a $100 quarterly fee; Association transfer fee of $450
Exterior
- Parking: 2-car garage
- Utilities: Water service (SAWS); Sewer service (SAWS); Gas supplied by CPS; Electricity supplied by CPS; Garbage service by Tiger
- Home design: New construction by Lennar
- Construction: Slab foundation; Composition roof
- Exterior features: Brick and cement fiber exterior
Interior
- Kitchen: Kitchen approximately 16 x 9; Stove/Range; Dishwasher; Breakfast bar
- Bedrooms: Master bedroom on lower level with walk-in closet and full bath; Bedroom 2 approximately 10 x 12; Bedroom 3 approximately 11 x 12; Bedroom 4 approximately 13 x 11; Master bedroom approximately 12 x 15
- Flooring: Carpeting; Vinyl flooring
- Bathrooms: Three full bathrooms; Master bath with shower only and double vanity
- Heating & cooling: Central heating; Electric and natural gas heat; Central air conditioning
- Interior features: Open floor plan; Breakfast bar; 1 living area; Utility room inside; Walk-in closets; All bedrooms downstairs; Laundry room / Laundry on main level
- Laundry & utility: Washer connection; Dryer connection; Laundry room / Laundry on main level; Utility room inside
Neighborhood map
What this means for you Summary
Snapshot
- This is a 4-bed/3.0-bath townhouse listed at $250k.
Deal economics
- At list price, monthly cash flow is $-244 ($-3k/yr) — negative.
- To cash-flow at today's rent, offer at most $215k (14.1% below list).
- To meet the 1% rule (rent ≥ 1% of price), the offer needs to be $192k (23.2% below list).
- Recommended offer: $192k (23.2% below list) — sets the bar for 1% rule.
- Cap rate 5.1% vs local median 3.8% in San Antonio — top-decile yield for the area; either an underpriced asset or a hidden risk that comps aren't pricing in. Stress-test before assuming the spread holds.
Location & tenants
- Location reads 80/100 on livability (#31 in TX, #1,616 nationally) — a professional / high-income tenant draw. Strengths: amenities A+, commute A+, cost of living A+; Watch: crime F.
- Southwest ISD (rural): math 21% / reading 31% proficiency, ranked #701 of 826 in TX (top 85%) — low school quality limits family demand, transient renter base, plan for 1-2y turnover; 75% free/reduced lunch — lower-income household profile, screen leases tightly.
- Zoned schools: Spicewood Park El (math 16% / reading 23%, grade F, #3,583 of 4,322 statewide, top 86%, 593 students, 93% FRL); Southwest H S (math 17% / reading 39%, grade F, #1,170 of 1,632 statewide, top 72%, 2,152 students, 72% FRL).
- Market conditions: Rents flat; 274 active listings in the ZIP; 40 comparable units currently listed for rent nearby; rentals at typical pace (median 24d on market — plan ~3-4 weeks tenant-placement turnaround); 40% of comp listings sitting > 30 days — soft ceiling on asking rent; 8,308 units permitted in Bexar County in 2024 (2,506 in 5+ unit buildings).
- This rent runs 38% of the median local income ($60k/yr) — at the standard rent-burdened threshold; future hikes will face affordability resistance.
Forward outlook
- In year one you build about $27k of equity ($2k loan paydown + $25k appreciation (10.0% local appreciation)).
- Bexar County population projected at +50% by 2050 — long-run rental-demand tailwind backs the buy-and-hold thesis.
- By year 2, paydown + projected appreciation supports a ~$43k cash-out refi (75% LTV) — recoverable capital for the next deal without selling this one.
Negotiation context
- It's been on market 23 days — a 2% lower offer ($246k) is reasonable based on typical stale-listing flexibility.
Questions for the listing agent
- What do current leases actually rent for vs. the listed asking? Can we see a recent rent roll and the last 12 months of T-12 income?
- What does the HOA fee cover, when was the last increase, and are there any pending special assessments or reserve-fund shortfalls?
- Is there a deadline driving the sale (1031 exchange, divorce, estate, relocation)? That informs how much negotiation room exists.
- Crime grade is F in this area — have there been break-ins, vandalism, or insurance claims at this property in the last 3 years? What carrier currently insures it and at what premium?
- The area grade is low — what's the realistic commute time and amenity access for the typical tenant pool here? Any planned neighborhood developments (good or bad) we should know about?
- What's the average days-on-market for RENTAL listings here right now (not sales)? A rising rental-DOM trend means longer vacancies and softer asking-rent achievability than the comps imply.
- What's the recent tenant-quality profile in this submarket — average credit score on applications, eviction rate, late-payment / NSF rate, and stable-employment percentage? A property-management company in the area should have these aggregated.
- How much new for-sale + rental construction is in the pipeline within 1–3 miles? Heavy new supply typically softens prices + rents 12–24 months out; constrained supply supports both.
Investment metrics
- 1% rule
- 0.77% ✗
- Cap rate
- 5.12%
- Cash-on-cash
- -4.18%
- DSCR
- 0.81
- GRM
- 10.9
CMA / ARV
- ARV (median comp)
- $229,842
- List price
- $249,999
- Delta
- 8.77%
- Verdict
- FAIR
- Comps
- 20 within 1.0 mi
Show comp detail 1 sale within ~0.75 mi
| Address | Dist | Beds/Ba | Sqft | Sold | Price | $/sf | Match |
|---|---|---|---|---|---|---|---|
| 10011 University Way | 0.70mi | 3/2.5 (-1) | 1,814 (-10%) | 4mo | $364,000 | $201 | 40 |
Match score weights: distance 35% · size 25% · config 20% · recency 20%. Top-matched comps best support the ARV.
Projected returns pro-forma
10.0% appreciation · 0.83% rent growth · sell at horizon
- IRR
- 20.7%
- Equity multiple
- 2.67×
- Total profit
- $116,558
- Equity at exit
- $225,219
- IRR
- 18.4%
- Equity multiple
- 5.97×
- Total profit
- $347,958
- Equity at exit
- $485,693
Cash invested: $70,000 (down + closing). Projections, not guarantees.
Landlord ↔ Tenant lean methodology
- Overall (STATE)
- 87 Strongly Landlord-Friendly
- State Texas
- 87 Strongly Landlord-Friendly · R+5
- County
- — inherits STATE
- City
- — inherits STATE
ZIP-level market 78224
- Home prices YoY
- 12.4%
- Rents YoY
- 0.8%
- Active inventory
- 274
- Price-to-rent
- 10.9×
Monthly cashflow live
- Estimated rent
- $1,920 high interval (Pro) →
- Mortgage (P&I)
- −$1,311
- Tax est. 1.5%
- −$312 /mo · $3,750/yr
- Insurance
- −$104
- HOA
- −$33
- Vacancy / Maint / Mgmt
- −$403
- Net cashflow
- $-244
Break-even live
UW: 25.0% down · 7.5% · 30yr · 1.5% tax · 5.0% vac · 8.0% maint · 8.0% mgmt
Financing live
Cash to close
- Down payment
- $62,500
- Closing costs
- $7,500
- Reserves months
- —
- Total cash needed
- —
Loan-product check · same deal, 3 products live
Conventional
25% down · 7.5% · 30yr
- Down + closing
- —
- Monthly P&I
- —
- Monthly cashflow
- —
- DSCR
- —
- Eligible?
- —
Personal DTI + credit; lowest rate.
DSCR
20% down · 8.5% · 30yr
- Down + closing
- —
- Monthly P&I
- —
- Monthly cashflow
- —
- DSCR
- —
- Eligible?
- —
No personal income docs; deal must DSCR.
Hard money
10% down · 12.0% · 12mo
- Down + closing
- —
- Monthly P&I
- —
- Monthly cashflow
- —
- DSCR
- —
- Eligible?
- —
Short-term bridge; refi at stabilization.
Rent comps 40 comps
| Address | Beds | Baths | Sqft | Rent | $/sqft | DOM | Units | Dist |
|---|---|---|---|---|---|---|---|---|
| 10523 Goose Way San Antonio, TX | 4.0 | 2.5 | 1917 | $1,785 | $0.93 | 44d | 1 | 0.31mi |
| 2107 Bigmouth Rod San Antonio, TX | 3.0 | 2.5 | 1777 | $1,675 | $0.94 | 44d | 1 | 0.33mi |
| 2111 Bigmouth Rod San Antonio, TX | 4.0 | 2.5 | 1917 | $1,700 | $0.89 | 44d | 1 | 0.34mi |
| 2115 Bigmouth Rod San Antonio, TX | 4.0 | 2.5 | 1847 | $1,755 | $0.95 | 44d | 1 | 0.35mi |
| 10611 Vesta Curv San Antonio, TX | 4.0 | 2.0 | 1627 | $1,735 | $1.07 | 4d | 1 | 0.40mi |
| 10622 Vesta Curv San Antonio, TX | 4.0 | 2.0 | 1627 | $1,725 | $1.06 | 4d | 1 | 0.41mi |
| 10723 Goose Way San Antonio, TX | 4.0 | 2.5 | 1917 | $1,785 | $0.93 | 44d | 1 | 0.41mi |
| 10710 Butterfly Pass San Antonio, TX | 4.0 | 2.5 | 1917 | $1,785 | $0.93 | 44d | 1 | 0.42mi |
| 10542 Nye Pass San Antonio, TX | 3.0 | 2.0 | 1440 | $1,595 | $1.11 | 44d | 1 | 0.42mi |
| 10151 Asta Trl San Antonio, TX | 4.0 | 2.0 | 1625 | $1,650 | $1.02 | 13d | 1 | 0.43mi |
| 2222 Fishing Trl San Antonio, TX | 4.0 | 2.5 | 1917 | $1,785 | $0.93 | 24d | 1 | 0.44mi |
| 10527 Hunters Pond San Antonio, TX | 4.0 | 2.5 | 1510 | $1,395 | $0.92 | 44d | 1 | 0.44mi |
| 2226 Fishing Trl San Antonio, TX | 3.0 | 2.5 | 1777 | $1,650 | $0.93 | 24d | 1 | 0.45mi |
| 10719 Butterfly Pass San Antonio, TX | 3.0 | 2.5 | 1645 | $1,640 | $1.00 | 44d | 1 | 0.45mi |
| 1451 Neria Loop Unit 3 San Antonio, TX | 4.0 | 3.0 | 1867 | $700 | $0.37 | 13d | 1 | 0.45mi |
| 2230 Fishing Trl San Antonio, TX | 4.0 | 2.5 | 1847 | $1,755 | $0.95 | 24d | 1 | 0.45mi |
| 10723 Butterfly Pass San Antonio, TX | 4.0 | 2.5 | 1687 | $1,675 | $0.99 | 44d | 1 | 0.45mi |
| 1347 Neria LOOP San Antonio, TX | 4.0 | 2.5 | 2173 | $1,699 | $0.78 | 44d | 1 | 0.46mi |
| 10811 Soupe CV San Antonio, TX | 4.0 | 2.5 | 2173 | $1,995 | $0.92 | 3d | 1 | 0.46mi |
| 2235 Fishing Trl San Antonio, TX | 4.0 | 2.5 | 1847 | $1,755 | $0.95 | 44d | 1 | 0.47mi |
| 10807 Bernal Cv San Antonio, TX | 4.0 | 2.0 | 1575 | $1,700 | $1.08 | 16d | 1 | 0.48mi |
| 2242 Fishing Trl San Antonio, TX | 4.0 | 2.5 | 1917 | $1,785 | $0.93 | 44d | 1 | 0.48mi |
| 10135 Ana Hts San Antonio, TX | 4.0 | 2.0 | 1952 | $2,200 | $1.13 | 2d | 1 | 0.49mi |
| 10823 Bernal Cv San Antonio, TX | 4.0 | 2.0 | 1600 | $2,000 | $1.25 | 2d | 1 | 0.50mi |
| 10107 Kersey Ml San Antonio, TX | 4.0 | 2.0 | 1628 | $1,695 | $1.04 | 24d | 1 | 0.51mi |
| 10031 Kersey Ml San Antonio, TX | 4.0 | 2.5 | 1950 | $1,895 | $0.97 | 2d | 1 | 0.51mi |
| 10007 Kersey Ml San Antonio, TX | 3.0 | 2.0 | 1440 | $1,495 | $1.04 | 44d | 1 | 0.52mi |
| 10042 Kersey Ml San Antonio, TX | 3.0 | 2.0 | 1450 | $1,650 | $1.14 | 22d | 1 | 0.54mi |
| 1407 Mira Ml San Antonio, TX | 4.0 | 2.0 | 1600 | $2,000 | $1.25 | 16d | 1 | 0.56mi |
| 2307 Applewhite Mdw San Antonio, TX | 4.0 | 2.5 | 1798 | $1,750 | $0.97 | 44d | 1 | 0.56mi |
| 10258 Asta Trl San Antonio, TX | 4.0 | 2.0 | 1625 | $1,590 | $0.98 | 16d | 1 | 0.57mi |
| 2318 Applewhite Mdw San Antonio, TX | 4.0 | 2.5 | 1798 | $1,795 | $1.00 | 24d | 1 | 0.59mi |
| 2330 Redlove Dr San Antonio, TX | 3.0 | 2.5 | 1420 | $1,600 | $1.13 | 4d | 1 | 0.61mi |
| 9514 Veronica St San Antonio, TX | 3.0 | 2.0 | 1455 | $1,450 | $1.00 | 3d | 1 | 0.61mi |
| 2335 Applewhite Mdw San Antonio, TX | 3.0 | 2.5 | 1529 | $1,550 | $1.01 | 4d | 1 | 0.62mi |
| 2343 Applewhite Mdw San Antonio, TX | 4.0 | 2.5 | 1798 | $1,795 | $1.00 | 24d | 1 | 0.63mi |
| 10750 Twyla Rd San Antonio, TX | 3.0 | 2.0 | 1402 | $1,750 | $1.25 | 16d | 1 | 0.64mi |
| 2350 Redlove Dr San Antonio, TX | 3.0 | 2.5 | 1420 | $1,675 | $1.18 | 24d | 1 | 0.64mi |
| 2350 Dry Moss Way San Antonio, TX | 3.0 | 2.5 | 1420 | $1,650 | $1.16 | 44d | 1 | 0.67mi |
| 2434 Dry Moss Way San Antonio, TX | 4.0 | 2.5 | 2417 | $2,500 | $1.03 | 2d | 1 | 0.76mi |
HOA detail
- Monthly dues
- $33 · $396/yr
- Likely covers
- water
Listing history 7 events
-
2026-06-07status $249,999 Pending 23 DOM
-
2026-06-04days on market $249,999 Price Change 23 DOM
-
2026-06-03days on market $249,999 Price Change 22 DOM
-
2026-06-02days on market $249,999 Price Change 21 DOM
-
2026-06-01days on market $249,999 Price Change 20 DOM
-
2026-05-31days on market $249,999 Price Change 19 DOM
-
2026-05-12$269,999 New 642-char remark
ⓘ Source: listings_history table (triggers on properties + properties_extension) + one-shot
backfill from property_details.listing_events for pre-trigger history.
Nearby sold comps map
Loading sold comps map…
Walkable amenities ~0.75 mi
Loading nearby amenities…
Taxation est. · year 1
- Rental income
- $23,037
- − Mortgage interest
- −$14,004
- − Property taxes
- −$3,750
- − Insurance
- −$1,250
- − Repairs & maintenance
- −$1,843
- − Management
- −$1,843
- − HOA
- −$396
- − Depreciation
- −$7,273
- Taxable loss
- −$7,321
- Est. tax savings @ 24.0%
- +$1,757
- After-tax cash flow
- $-1,172/yr
For passive investors: Depreciation is non-cash, so a rental often shows a tax loss while cash-flowing — sheltering income. Rental losses are passive: they offset passive income freely, and up to $25,000/yr can offset ordinary (W-2) income if you actively participate and your MAGI is under $100k (phasing out to $0 by $150k); unused losses carry forward. On sale, claimed depreciation is recaptured at up to 25%, and gains may owe capital-gains tax (a 1031 exchange can defer both). Figures are a year-1 estimate at your 24.0% rate — not tax advice; consult a CPA.
Schools (NCES district)
- District
- Southwest ISD
- NCES district ID
- 4840950
- Math proficiency
- 21% ▼ -21.00%
- Reading proficiency
- 31% ▼ -5.00%
- Median HH income
- $43,362
- Composite
- 22.22/100
- National rank
- #8153
- State rank
- #701 of 826 in TX
Livability — San Antonio
- Score
- 80/100
- State rank
- #31
- US rank
- #1616
Category grades
Schools grade is shown separately in the Schools card above.
Census & demographics
- Census place
- San Antonio, TX
- County
- Bexar County · 1,990,555 people
- City population
- 1,806,925
- Metro
- San Antonio-New Braunfels, TX
- Population (ZIP)
- 22,232
- Household income
- $59,891
- Rent vs Own
- Severe rent burden
- 721.0
Population outlook (Bexar County) Hauer SSP2
- Today (2025)
- 2,336,851 people
- By 2030
- 2,560,728 · +9.6%
- By 2040
- 3,020,569 · +29.3%
- By 2050
- 3,493,522 · +49.5%
- By 2075
- 4,668,459 · +99.8%
- By 2100
- 5,533,242 · +136.8%
Race, ethnicity, and origin ACS 2023
- Neighborhood character
- Predominantly Hispanic (90%)
- Race & ethnicity
- Hispanic / Latino 90% Two or more races 24% White 6% Native American 2% Asian 2%
- Hispanic origin (detail)
- Mexican 75%
- Common ancestry
- Italian 1%
- Foreign-born
- 18% · Canada, Vietnam, China
- Languages at home
- 44% English-only · Spanish 55% Chinese 1%
Political lean MEDSL · Bexar
- 2024 margin
- Lean D (+9.8) · D 54.3% · R 44.6% · Other 1.1%
- 2008→2024 swing
- +4.2pp toward D · 2008: 5.6pp · 2024: 9.8pp
- All cycles
- 2024: D+9.8 2020: D+18.2 2016: D+13.5 2012: D+4.6 2008: D+5.6
Not yet ingested
- Civics
- —
Market trends
- HPI YoY
- ▲ 29.95%
- Current HPI
- 272.0709
- Rent YoY
- ▲ 0.83%
- Metro
- San Antonio-New Braunfels, TX
- State GDP YoY
- ▲ 3.95%
- F500 in state
- 110
Industry mix (Fortune 500 HQ in TX)
| Industry | F500 HQs | Revenue |
|---|---|---|
| Energy | 16 | $1,198B |
|
||
| Technology | 5 | $198B |
|
||
| Engineering / Construction | 4 | $72B |
|
||
| Energy Services | 3 | $60B |
|
||
| Utilities | 3 | $41B |
|
||
| Healthcare | 2 | $330B |
|
||
Price history
-7.4% since first listed3 events — show timeline
- 2026-06-04 Pending — LERA
- 2026-05-26 Price Changed $249,999 LERA
- 2026-05-12 Listed $269,999 LERA
Cash-flow waterfall
monthlySold comps — $/sqft
last 12 mo · ≤1 miLoading sold comps…