 Duplex
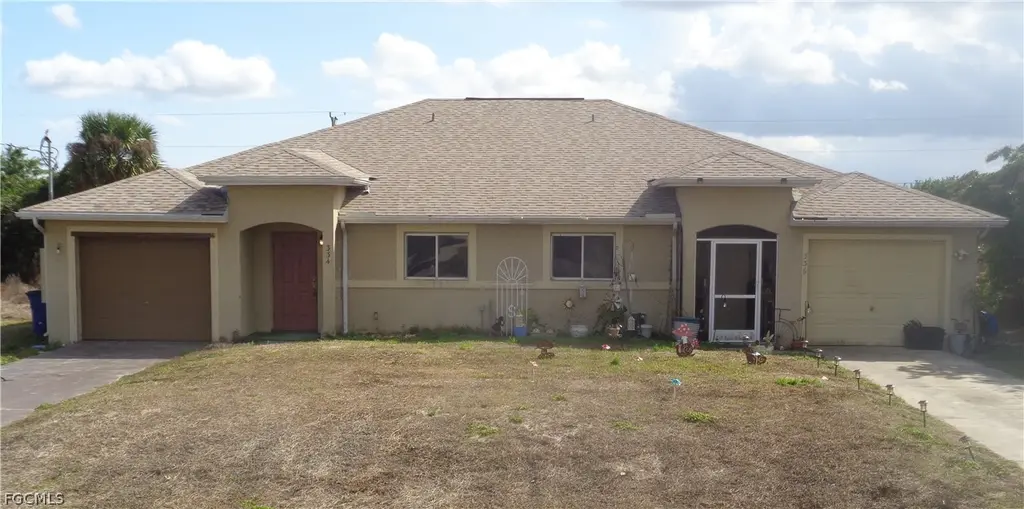
334/336 Poplar St · Lehigh Acres, FL
Flood risk 1/10 · Minimal
- FEMA flood zone
- X (unshaded)
- Chance of flooding over 30 yrs
- 0.0%
- Est. flood insurance / yr
- $507 – $1,088
Fire risk 4/10 · Minor
- Est. fire insurance / yr
- $947 – $1,759
Heat risk 10/10 · Severe
- Hot days now (above 107°F)
- 7 days/yr
- Hot days in 30 yrs
- 29 days/yr
Wind risk 10/10 · Severe
- Chance of severe wind over 30 yrs
- 99.0%
Air-quality risk 2/10 · Minimal
- Unhealthy air days now
- 1 days/yr
- Unhealthy air days in 30 yrs
- 2 days/yr
Risk factors via First Street. Map © Google.
Why this score? — see what drove the C+ grade
The composite is a weighted blend of 9 inputs, each scored 0–100. Each bar is that input's sub-score; the figure is the points it added to the 100-point composite (weight × sub-score).
- Cash flow +16.6/30.0
- ARV discount +15.0/15.0
- Appreciation +10.0/10.0
- DSCR +5.2/10.0
- 1% rule +4.5/10.0
- Schools +4.1/10.0
- Condition / age +3.8/5.0
- Livability +3.0/5.0
- Rent growth +1.3/5.0
$389,900
🖨 Deal sheet 📄 Offer letter ✓ Due diligence
Multi-family units
County records classify this as Multi-Family (2-4 Unit). Listing-text estimate: 2 units. confirmed
Listing remarks
GREAT DUPLEX IN SOUGHT AFTER AREA OF LEHIGH ACRES: Perfect to live in one unit and rent the second unit or for investment as a rental income producing property. This duplex has 6 bedrooms, 4 bathrooms and 2 car garage (3 bedrooms, 2 bathrooms and 1 car garage on each unit). The roof was replaced in 2024. This duplex is fully tiled and offers generous size bedrooms. Both Master bedrooms have double closets and full bathrooms with shower/tub. Each unit offer interior laundry. Kitchens offer plenty of storage space on their respective cabinets. Also, kitchens have large surface counters and are ideal for casual dining. In addition, kitchen offers spacious area for formal dining. Great location
Key facts
- 0.25 acre lot
- 2 garage spots
- Built 2010
Property features AI
Finance
- Other: Pets allowed; Tenants are responsible for cable TV, electricity and telephone
- Financial info: Gross scheduled income: $12,600; Operating expenses: $9,580; Actual/pro forma rent for one unit: $1,050; Property contains 2 rental units
- HOA & community: No association fee
Exterior
- Parking: Each unit includes an attached 1-car garage (2 attached garages total)
- Utilities: Well water; Septic tank sewer; Cable not available
- Home design: Multifamily property with 2 total units; Resale property; Zoned RM-2
- Construction: Built with block, concrete and stucco construction; Shingle roof
- Exterior features: Patio; Rectangular lot; Paved, publicly maintained road
Interior
- Kitchen: No appliance details provided
- Bedrooms: Two 3-bedroom units (each unit has 3 bedrooms)
- Flooring: Tile flooring
- Bathrooms: Each unit has 2 full bathrooms (4 full bathrooms total)
- Heating & cooling: Central heating (electric); Central air conditioning (electric)
- Interior features: Single hung windows; Tile flooring
- Laundry & utility: Laundry in each residence
Neighborhood map
What this means for you Summary
Snapshot
- This is a 2 × 3-bed/2.0-bath units multifamily listed at $390k. Condition is rated good.
Deal economics
- At list price, monthly cash flow is $239 ($3k/yr) — positive. Per door: $119/mo.
- The deal already cash-flows at list — no discount required.
- To meet the 1% rule (rent ≥ 1% of price), the offer needs to be $371k (4.8% below list).
- Recommended offer: $367k (6.0% below list) — sets the bar for market timing.
- Cap rate 7.0% vs local median 4.7% in Lehigh Acres — top-decile yield for the area; either an underpriced asset or a hidden risk that comps aren't pricing in. Stress-test before assuming the spread holds.
Location & tenants
- Location reads 59/100 on livability (#826 in FL) — a working-class tenant base; expect higher turnover. Strengths: cost of living A+, housing A+; Watch: crime C-, employment D+, schools D-.
- Lee (suburban): math 47% / reading 50% proficiency, ranked #42 of 73 in FL (top 58%) — families likely to look elsewhere, expect single-tenant / working-renter base with shorter leases.
- Market conditions: Rents falling (-4.7%/yr); 2460 active listings in the ZIP; 6 comparable units currently listed for rent nearby; rentals at typical pace (median 21d on market — plan ~3-4 weeks tenant-placement turnaround); 15,411 units permitted in Lee County in 2024 (4,686 in 5+ unit buildings).
- At $3,713/mo this rent would consume 62% of the median local household income ($72k/yr) (locally 434% of renters already pay >50% of income on rent) — very limited rent-growth headroom before tenants either downsize or default.
Forward outlook
- In year one you build about $42k of equity ($3k loan paydown + $39k appreciation (10.0% local appreciation)).
- Lee County population projected at +44% by 2050 — long-run rental-demand tailwind backs the buy-and-hold thesis.
- At projected returns (10.0% appreciation + 0.0% rent growth), your $109k cash investment doubles in ~3 years — after that, you're playing with house money.
- By year 2, paydown + projected appreciation supports a ~$67k cash-out refi (75% LTV) — recoverable capital for the next deal without selling this one.
Negotiation context
- It's been on market 64 days — a 6% lower offer ($367k) is reasonable based on typical stale-listing flexibility.
Risks & watch-outs
- Climate carrying-cost: severe wind risk, 99% chance of damaging wind over 30y; extreme-heat days projected 7→29/yr by 2055 (HVAC capex compounding) — expect insurance premiums to compound above CPI over the hold.
Questions for the listing agent
- It's been on market 64 days. Have you received any prior offers? Is the seller open to a 6% concession, seller financing, or rate buy-down credit?
- Can we see the unit-by-unit rent roll, current vacancy, and any below-market leases? What's the average tenancy length?
- What capital expenditures (roof, boiler, parking lot, exteriors) have been made in the last 5 years, and what's planned in the next 2?
- Why hasn't it sold? Are there any deal-killer items the seller is aware of (foundation, flood, title, zoning, code violations)?
- Is there a deadline driving the sale (1031 exchange, divorce, estate, relocation)? That informs how much negotiation room exists.
- Schools are D-rated, which usually means shorter tenancies and higher turnover. Who's the typical renter profile here, and what's been the actual vacancy rate?
- What's the average days-on-market for RENTAL listings here right now (not sales)? A rising rental-DOM trend means longer vacancies and softer asking-rent achievability than the comps imply.
- What's the recent tenant-quality profile in this submarket — average credit score on applications, eviction rate, late-payment / NSF rate, and stable-employment percentage? A property-management company in the area should have these aggregated.
- How much new apartment / multifamily construction is in the pipeline within 1–3 miles? Heavy new supply (>2% of stock underway) typically softens rents 12–24 months out; light construction supports rent growth.
Investment metrics
- 1% rule
- 0.95% ✗
- Cap rate
- 7.03%
- Cash-on-cash
- 2.62%
- DSCR
- 1.12
- GRM
- 8.8
CMA / ARV
- ARV (on-the-fly)
- $510,774
- Comps found
- 3
Show comp detail 3 sales within ~0.75 mi
| Address | Dist | Beds/Ba | Sqft | Sold | Price | $/sf | Match |
|---|---|---|---|---|---|---|---|
| 322-324 Poplar St | 0.04mi | 6/4.0 | 2,398 (0%) | 2mo | $510,000 | $213 | 96 |
| 318-320 Poplar St | 0.06mi | 6/4.0 | 2,398 (0%) | 3mo | $515,000 | $215 | 95 |
| 326-328 Grant Blvd | 0.08mi | 6/4.0 | 2,330 (-3%) | 14mo | $400,000 | $172 | 80 |
Match score weights: distance 35% · size 25% · config 20% · recency 20%. Top-matched comps best support the ARV.
Projected returns pro-forma
10.0% appreciation · 0.0% rent growth · sell at horizon
- IRR
- 25.1%
- Equity multiple
- 2.99×
- Total profit
- $216,731
- Equity at exit
- $351,253
- IRR
- 21.4%
- Equity multiple
- 6.56×
- Total profit
- $606,907
- Equity at exit
- $757,490
Cash invested: $109,172 (down + closing). Projections, not guarantees.
Landlord ↔ Tenant lean methodology
- Overall (STATE)
- 87 Strongly Landlord-Friendly
- State Florida
- 87 Strongly Landlord-Friendly · R+3
- County
- — inherits STATE
- City
- — inherits STATE
ZIP-level market 33974
- Home prices YoY
- 5.8%
- Rents YoY
- -4.7%
- Active inventory
- 2460
- Price-to-rent
- 17.5×
Monthly cashflow live
- Estimated rent
- $3,713 high interval (Pro) →
- Mortgage (P&I)
- −$2,045
- Tax est. 1.5%
- −$487 /mo · $5,848/yr
- Insurance
- −$162
- HOA
- −$0
- Vacancy / Maint / Mgmt
- −$780
- Net cashflow
- $239
Break-even live
2-unit breakdown (identical units grouped — click to expand)
| Units | Beds | Baths | Est. rent |
|---|---|---|---|
| 2× units | 3 | 2 | $3,714 |
| #1 | 3 | 2 | $1,857 |
| #2 | 3 | 2 | $1,857 |
| Total (2 units) | $3,713 | ||
UW: 25.0% down · 7.5% · 30yr · 1.5% tax · 5.0% vac · 8.0% maint · 8.0% mgmt
Financing live
Cash to close
- Down payment
- $97,475
- Closing costs
- $11,697
- Reserves months
- —
- Total cash needed
- —
Loan-product check · same deal, 3 products live
Conventional
25% down · 7.5% · 30yr
- Down + closing
- —
- Monthly P&I
- —
- Monthly cashflow
- —
- DSCR
- —
- Eligible?
- —
Personal DTI + credit; lowest rate.
DSCR
20% down · 8.5% · 30yr
- Down + closing
- —
- Monthly P&I
- —
- Monthly cashflow
- —
- DSCR
- —
- Eligible?
- —
No personal income docs; deal must DSCR.
Hard money
10% down · 12.0% · 12mo
- Down + closing
- —
- Monthly P&I
- —
- Monthly cashflow
- —
- DSCR
- —
- Eligible?
- —
Short-term bridge; refi at stabilization.
Rent comps 6 comps
| Address | Beds | Baths | Sqft | Rent | $/sqft | DOM | Units | Dist |
|---|---|---|---|---|---|---|---|---|
| 19525 Fairhill Ct Lehigh Acres, FL | 6.0 | 3.0 | 2463 | $2,499 | $1.01 | 23d | 1 | 0.43mi |
| 11902 Savanna Lakes Blvd Lehigh Acres, FL | 6.0 | 3.0 | 3041 | $2,750 | $0.90 | 16d | 1 | 0.63mi |
| 11634 Savanna Lakes Blvd Lehigh Acres, FL | 5.0 | 3.0 | 2451 | $2,650 | $1.08 | 21d | 1 | 0.64mi |
| 11613 Savanna Lakes Blvd Lehigh Acres, FL | 5.0 | 3.0 | 2451 | $2,700 | $1.10 | 16d | 1 | 0.96mi |
| 19972 Green Pasture Rd Lehigh Acres, FL | 5.0 | 2.5 | 2959 | $3,000 | $1.01 | 21d | 1 | 1.00mi |
| 10601 Crossback Ln Lehigh Acres, FL | 5.0 | 3.0 | 2634 | $2,800 | $1.06 | 23d | 1 | 1.01mi |
Listing history 7 events
-
2026-06-07statusdays on market $389,900 Pending 64 DOM
-
2026-06-03days on market $389,900 Active 63 DOM
-
2026-06-02days on market $389,900 Active 62 DOM
-
2026-06-01days on market $389,900 Active 61 DOM
-
2026-06-01days on market $389,900 Active 60 DOM
-
2026-04-27price $389,900
-
2026-04-02$394,900 Active
ⓘ Source: listings_history table (triggers on properties + properties_extension) + one-shot
backfill from property_details.listing_events for pre-trigger history.
Climate risk First Street
- Flood 1/10 Low FEMA zone X (unshaded) · 0% chance over 30 yrs
- Wildfire 4/10 Moderate
- Heat 10/10 Extreme 7 d/yr ≥107°F today · 29 d/yr by 30 yrs out
- Wind 10/10 Extreme 99% chance of damaging wind over 30 yrs
- Air quality 2/10 Low 1 unhealthy d/yr today · 2 by 30 yrs out
Nearby sold comps map
Loading sold comps map…
Walkable amenities ~0.75 mi
Loading nearby amenities…
Taxation est. · year 1
- Rental income
- $44,556
- − Mortgage interest
- −$21,840
- − Property taxes
- −$5,848
- − Insurance
- −$1,950
- − Repairs & maintenance
- −$3,564
- − Management
- −$3,564
- − Depreciation
- −$11,343
- Taxable loss
- −$3,554
- Est. tax savings @ 24.0%
- +$853
- After-tax cash flow
- $3,718/yr
For passive investors: Depreciation is non-cash, so a rental often shows a tax loss while cash-flowing — sheltering income. Rental losses are passive: they offset passive income freely, and up to $25,000/yr can offset ordinary (W-2) income if you actively participate and your MAGI is under $100k (phasing out to $0 by $150k); unused losses carry forward. On sale, claimed depreciation is recaptured at up to 25%, and gains may owe capital-gains tax (a 1031 exchange can defer both). Figures are a year-1 estimate at your 24.0% rate — not tax advice; consult a CPA.
Condition & rehab AI · 13 photos
This well-maintained duplex in Lehigh Acres is in good condition with a good roof and exterior. Some landscaping and painting would further enhance its curb appeal and value.
Repairs flagged
- Minor Landscaping — Some areas of the landscaping appear overgrown and could benefit from trimming and maintenance.
Value-add opportunities
- Both Landscaping — A well-maintained landscape can enhance the curb appeal and increase both resale and rental value.
- Both Painting — Fresh paint can make the home look more inviting and increase its value.
Renovation cost estimate screening
| Repair item | Severity | Est. cost |
|---|---|---|
| Landscaping · Some areas of the landscaping appear overgrown and could benefit from trimming and maintenance. | Minor | $500–3,000 |
| Total estimated repair cost · 1 items | $500–3,000 |
Value-add ROI direction
- Both Landscaping — A well-maintained landscape can enhance the curb appeal and increase both resale and rental value. ↑
- Both Painting — Fresh paint can make the home look more inviting and increase its value. ↑
ⓘ Cost ranges are severity-bucket heuristics (US national rule-of-thumb). Get contractor quotes + a written scope before underwriting a rehab budget.
Schools (NCES district)
- District
- Lee
- NCES district ID
- 1201080
- Math proficiency
- 47% ▼ -11.00%
- Reading proficiency
- 50% ▼ -4.00%
- Median HH income
- $49,518
- Composite
- 41.49/100
- National rank
- #3458
- State rank
- #42 of 73 in FL
Livability — Lehigh Acres
- Score
- 59/100
- State rank
- #826
- US rank
- #20055
Category grades
Schools grade is shown separately in the Schools card above.
Census & demographics
- Census place
- Lehigh Acres, FL
- County
- Lee County · 788,662 people
- City population
- 130,638
- Metro
- Cape Coral-Fort Myers, FL
- Population (ZIP)
- 19,927
- Household income
- $72,192
- Rent vs Own
- Severe rent burden
- 434.0
Population outlook (Lee County) Hauer SSP2
- Today (2025)
- 871,946 people
- By 2030
- 955,468 · +9.6%
- By 2040
- 1,113,587 · +27.7%
- By 2050
- 1,256,891 · +44.1%
- By 2075
- 1,560,270 · +78.9%
- By 2100
- 1,726,848 · +98.0%
Race, ethnicity, and origin ACS 2023
- Neighborhood character
- Diverse neighborhood (Simpson 0.64)
- Race & ethnicity
- Hispanic / Latino 52% Two or more races 31% White 26% Black 18%
- Hispanic origin (detail)
- Mexican 12% Puerto Rican 7% Cuban 20% Dominican 4%
- Common ancestry
- Hispanic 7% Italian 1% Portuguese 1%
- Foreign-born
- 32% · Canada, Jamaica
- Languages at home
- 48% English-only · Spanish 43% French/Haitian/Cajun 7% Other Indo-European 1%
Political lean MEDSL · Lee
- 2024 margin
- Strong R (+28.4) · D 35.5% · R 63.9%
- 2008→2024 swing
- -18.0pp toward R · 2008: -10.4pp · 2024: -28.4pp
- All cycles
- 2024: R+28.4 2020: R+19.2 2016: R+20.4 2012: R+16.6 2008: R+10.4
Not yet ingested
- Civics
- —
Market trends
- HPI YoY
- ▲ 16.53%
- Current HPI
- 303.3399
- Rent YoY
- ▼ -4.68%
- Metro
- Cape Coral-Fort Myers, FL
- State GDP YoY
- ▲ 3.28%
- F500 in state
- 36
Industry mix (Fortune 500 HQ in FL)
| Industry | F500 HQs | Revenue |
|---|---|---|
| Industrial Technology | 2 | $29B |
|
||
| Insurance | 2 | $17B |
|
||
| Retail | 1 | $60B |
|
||
| Technology Distribution | 1 | $58B |
|
||
| Homebuilding | 1 | $35B |
|
||
| Technology Manufacturing | 1 | $35B |
|
||
Price history
-1.3% since first listed2 events — show timeline
- 2026-04-27 Price Changed $389,900 FORTMLS
- 2026-04-02 Listed $394,900 FORTMLS
Cash-flow waterfall
monthlySold comps — $/sqft
last 12 mo · ≤1 miLoading sold comps…