 Multi-family
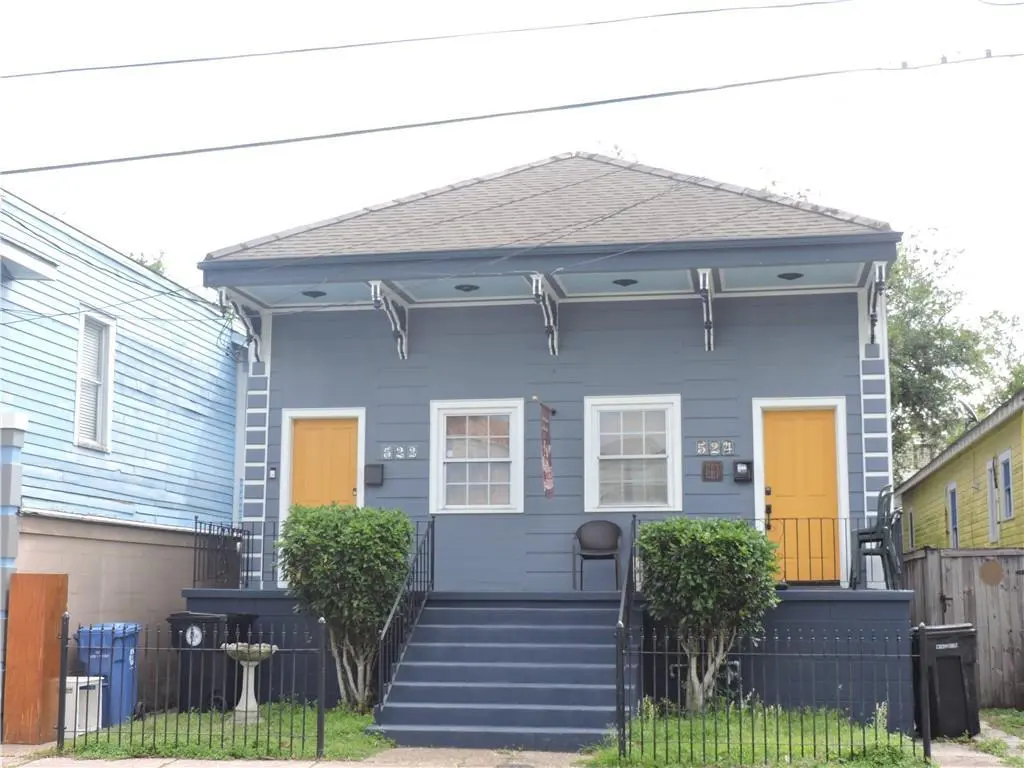
522 52 Verret St · New Orleans, LA
Flood risk 7/10 · Major
- FEMA flood zone
- X
- Chance of flooding over 30 yrs
- 0.6%
- Est. flood insurance / yr
- $507 – $1,088
Fire risk 1/10 · Minimal
- Est. fire insurance / yr
- $1,269 – $2,357
Heat risk 10/10 · Severe
- Hot days now (above 108°F)
- 7 days/yr
- Hot days in 30 yrs
- 21 days/yr
Wind risk 10/10 · Severe
- Chance of severe wind over 30 yrs
- 99.0%
Air-quality risk 4/10 · Minor
- Unhealthy air days now
- 4 days/yr
- Unhealthy air days in 30 yrs
- 4 days/yr
Risk factors via First Street. Map © Google.
Why this score? — see what drove the D grade
The composite is a weighted blend of 9 inputs, each scored 0–100. Each bar is that input's sub-score; the figure is the points it added to the 100-point composite (weight × sub-score).
- Cash flow +16.4/30.0
- ARV discount +8.9/15.0
- DSCR +5.1/10.0
- 1% rule +4.0/10.0
- Livability +4.0/5.0
- Condition / age +2.5/5.0
- Rent growth +2.3/5.0
- Schools +1.6/10.0
- Appreciation +0.0/10.0
$345,000
🖨 Deal sheet (PDF) 📄 Offer letter ✓ Due diligence
Multi-family units
County records classify this as Multi-Family (2-4 Unit). Listing-text estimate: 1 unit. estimate disagrees with records
Listing remarks MLS
Rare find in ALGIERS POINT! Historic Victorian Shotgun Double (4bed/2bath) with Ornate Brackets and freshly painted exterior. energy efficient windows, central A/C and heat on each side, utilities are metered individually, water on one source. Wrought iron fence welcomes you to raised home with covered concrete front porch and sturdy railings. solid wood entry doors open to beautiful wood floors, decorative fireplace mantels,12foot high ceilings, spacious rooms and windows that let the sun shine in. Bedrooms have large closets with plenty of storage. Owner has been diligent on maintaining property. courtyard in back of property has a shade tree, storage shed and fenced backyard. second unit has 10 foot ceilings, attic access and freshly painted. both units have similar floorplans. quiet location on a paved street with walking distance to grocery store, school, parks, levee and ferry landing , many homeowners on this block. excellent rental or owner occupied. historic tax credits may be available both state and federal. financing options are available. ready to move into or rent.
Key facts
- Courtyard in back
- Historic victorian
- Fenced backyard
Tags
Neighborhood map
What this means for you Summary
Snapshot
- This is a 4-bed/2.0-bath multifamily listed at $345k.
Deal economics
- At list price, monthly cash flow is $131 ($2k/yr) — positive.
- The deal already cash-flows at list — no discount required.
- To meet the 1% rule (rent ≥ 1% of price), the offer needs to be $310k (10.2% below list).
- Recommended offer: $310k (10.2% below list) — sets the bar for 1% rule.
- Cap rate 7.0% vs local median 4.4% in New Orleans — top-decile yield for the area; either an underpriced asset or a hidden risk that comps aren't pricing in. Stress-test before assuming the spread holds.
Location & tenants
- Location reads 81/100 on livability (#3 in LA, #1,383 nationally) — a professional / high-income tenant draw. Strengths: amenities A+, commute A+, health & safety A+; Watch: crime C-, employment D.
- Orleans Parish (urban): math 11% / reading 27% proficiency, ranked #69 of 98 in LA (top 70%) — low school quality limits family demand, transient renter base, plan for 1-2y turnover; 68% free/reduced lunch — lower-income household profile, screen leases tightly.
- Zoned schools: Benjamin Franklin Elem. Math And Science (math 12% / reading 23%, grade F, #479 of 646 statewide, top 75%, 747 students, 98% FRL, charter) — zoned schools average 98% FRL vs 68% district-wide (30 pts higher); higher-poverty schools than district average — tighter screening recommended.
- Market conditions: Rents soft (-0.7%/yr); 265 active listings in the ZIP; 40 comparable units currently listed for rent nearby; rentals at typical pace (median 26d on market — plan ~3-4 weeks tenant-placement turnaround); lower-income renter base — watch delinquency; 710 units permitted in Orleans Parish in 2024 (244 in 5+ unit buildings).
- At $3,098/mo this rent would consume 85% of the median local household income ($43k/yr) (locally 2240% of renters already pay >50% of income on rent) — very limited rent-growth headroom before tenants either downsize or default.
Forward outlook
- Local home prices are declining (-3.0%/yr); year-one equity from $2k of loan paydown is wiped out by about $10k of value loss. Plan a longer hold.
- Orleans County population projected at +61% by 2050 — long-run rental-demand tailwind backs the buy-and-hold thesis.
Negotiation context
- It's been on market 92 days — a 9% lower offer ($314k) is reasonable based on typical stale-listing flexibility.
- 7 sale attempts since 29y ago with the ask held roughly flat each time — persistent listings suggest the price (not the market) is what's stuck; bring a comps-based counter.
- Current owner paid $236k; 46% above their basis — modest negotiation headroom, anchor on the comps not their cost.
Risks & watch-outs
- Watch-outs: flood insurance adds $66/mo; built in 1900 — expect roof / HVAC / electrical / plumbing capex.
- Climate carrying-cost: major flood risk; severe wind risk, 99% chance of damaging wind over 30y; extreme-heat days projected 7→21/yr by 2055 (HVAC capex compounding) — expect insurance premiums to compound above CPI over the hold.
Questions for the listing agent
- It's been on market 92 days. Have you received any prior offers? Is the seller open to a 10% concession, seller financing, or rate buy-down credit?
- Built in 1900 — when were the roof, HVAC, electrical panel, plumbing, and water heater last replaced?
- What's the actual annual flood-insurance premium (NFIP or private), and is the property in a SFHA with mandatory coverage?
- Why hasn't it sold? Are there any deal-killer items the seller is aware of (foundation, flood, title, zoning, code violations)?
- Is there a deadline driving the sale (1031 exchange, divorce, estate, relocation)? That informs how much negotiation room exists.
- The area grade is low — what's the realistic commute time and amenity access for the typical tenant pool here? Any planned neighborhood developments (good or bad) we should know about?
- What's the average days-on-market for RENTAL listings here right now (not sales)? A rising rental-DOM trend means longer vacancies and softer asking-rent achievability than the comps imply.
- What's the recent tenant-quality profile in this submarket — average credit score on applications, eviction rate, late-payment / NSF rate, and stable-employment percentage? A property-management company in the area should have these aggregated.
- How much new apartment / multifamily construction is in the pipeline within 1–3 miles? Heavy new supply (>2% of stock underway) typically softens rents 12–24 months out; light construction supports rent growth.
Investment metrics
- 1% rule
- 0.90% ✗
- Cap rate
- 6.98%
- Cash-on-cash
- 2.46%
- DSCR
- 1.11
- GRM
- 9.3
CMA / ARV
- ARV (median comp)
- $356,240
- List price
- $345,000
- Delta
- -3.16%
- Verdict
- FAIR
- Comps
- 20 within 1.0 mi
Show comp detail 12 sales within ~0.75 mi
| Address | Dist | Beds/Ba | Sqft | Sold | Price | $/sf | Match |
|---|---|---|---|---|---|---|---|
| 904 06 Vallette St | 0.29mi | 4/2.0 | 1,788 (-2%) | 4mo | $165,000 | $92 | 80 |
| 538-40 Verret St | 0.02mi | 4/2.0 | 1,716 (-6%) | 12mo | $349,000 | $203 | 79 |
| 511 13 Pelican Ave | 0.27mi | 3/2.0 (-1) | 1,776 (-2%) | 1mo | $345,000 | $194 | 78 |
| 838-840 Elmira Ave | 0.33mi | 4/4.0 | 1,858 (+2%) | 1mo | $219,000 | $118 | 72 |
| 505 07 Seguin St | 0.13mi | 4/2.0 | 1,657 (-9%) | 10mo | $299,000 | $180 | 71 |
| 618-20 Seguin St | 0.06mi | 4/4.0 | 1,649 (-9%) | 13mo | $392,800 | $238 | 63 |
| 627-629 Seguin St | 0.09mi | 4/2.0 | 2,040 (+12%) | 18mo | $349,900 | $172 | 60 |
| 321 Diana St | 0.45mi | 4/2.0 | 1,634 (-10%) | 8mo | $216,600 | $133 | 55 |
| 505 Newton St | 0.35mi | 4/3.5 | 1,979 (+9%) | 18mo | $95,000 | $48 | 48 |
| 335 37 Pacific Ave | 0.30mi | 4/4.0 | 2,080 (+14%) | 7mo | $364,285 | $175 | 48 |
| 1427 De Armas St | 0.74mi | 4/2.0 | 1,600 (-12%) | 3mo | $80,000 | $50 | 43 |
| 612/614 Wagner St | 0.68mi | 4/2.0 | 1,617 (-11%) | 13mo | $317,500 | $196 | 38 |
Match score weights: distance 35% · size 25% · config 20% · recency 20%. Top-matched comps best support the ARV.
Projected returns pro-forma
-3.0% appreciation · 0.0% rent growth · sell at horizon
- IRR
- -17.0%
- Equity multiple
- 0.41×
- Total profit
- $-56,616
- Equity at exit
- $51,441
- IRR
- -15.6%
- Equity multiple
- 0.24×
- Total profit
- $-73,599
- Equity at exit
- $29,829
Cash invested: $96,600 (down + closing). Projections, not guarantees.
Landlord ↔ Tenant lean methodology
- Overall (STATE)
- 90 Strongly Landlord-Friendly
- State Louisiana
- 90 Strongly Landlord-Friendly · R+12
- County
- — inherits STATE
- City
- — inherits STATE
ZIP-level market 70114
- Rents YoY
- -0.7%
- Active inventory
- 265
- Price-to-rent
- 18.6×
Monthly cashflow live
- Estimated rent
- $3,098 high interval (Pro) →
- Mortgage (P&I)
- −$1,809
- Tax from tax record
- −$297 /mo · $3,560/yr
- Insurance
- −$144
- Flood insurance flood zone
- −$66 /mo · $798/yr
- HOA
- −$0
- Vacancy / Maint / Mgmt
- −$651
- Net cashflow
- $131
Break-even live
Sensitivity live
| Price | -10% $327 | -5% $229 | +0% $131 | +5% $34 | +10% $-64 |
|---|---|---|---|---|---|
| Rent | -10% $-113 | -5% $9 | +0% $131 | +5% $254 | +10% $376 |
| Rate | -1.0pp $305 | -0.5pp $219 | base $131 | +0.5pp $42 | +1.0pp $-49 |
2-unit breakdown (identical units grouped — click to expand)
| Units | Beds | Baths | Est. rent |
|---|---|---|---|
| 2× units | 2 | 1 | $3,098 |
| #1 | 2 | 1 | $1,549 |
| #2 | 2 | 1 | $1,549 |
| Total (2 units) | $3,098 | ||
UW: 25.0% down · 7.5% · 30yr · 1.5% tax · 5.0% vac · 8.0% maint · 8.0% mgmt
Financing live
Cash to close
- Down payment
- $86,250
- Closing costs
- $10,350
- Reserves months
- —
- Total cash needed
- —
Loan-product check · same deal, 3 products live
Conventional
25% down · 7.5% · 30yr
- Down + closing
- —
- Monthly P&I
- —
- Monthly cashflow
- —
- DSCR
- —
- Eligible?
- —
Personal DTI + credit; lowest rate.
DSCR
20% down · 8.5% · 30yr
- Down + closing
- —
- Monthly P&I
- —
- Monthly cashflow
- —
- DSCR
- —
- Eligible?
- —
No personal income docs; deal must DSCR.
Hard money
10% down · 12.0% · 12mo
- Down + closing
- —
- Monthly P&I
- —
- Monthly cashflow
- —
- DSCR
- —
- Eligible?
- —
Short-term bridge; refi at stabilization.
Rent comps 40 comps
| Address | Beds | Baths | Sqft | Rent | $/sqft | DOM | Units | Dist |
|---|---|---|---|---|---|---|---|---|
| 433 Homer St Unit 1 New Orleans, LA | 4.0 | 2.0 | 1570 | $1,850 | $1.18 | 25d | 1 | 0.26mi |
| 249 Vallette St New Orleans, LA | 4.0 | 2.0 | 1734 | $2,500 | $1.44 | 18d | 1 | 0.26mi |
| 729 Elmira Ave New Orleans, LA | 4.0 | 2.0 | 2000 | $2,000 | $1.00 | 18d | 1 | 0.26mi |
| 336 Elmira Ave New Orleans, LA | 3.0 | 1.0 | 1250 | $1,825 | $1.46 | 25d | 1 | 0.31mi |
| 119 Vallette St New Orleans, LA | 3.0 | 2.5 | 1500 | $2,100 | $1.40 | 25d | 1 | 0.34mi |
| 527 Atlantic Ave New Orleans, LA | 3.0 | 2.0 | 1800 | $2,050 | $1.14 | 25d | 1 | 0.34mi |
| 807 Whitney Ave Unit 1 New Orleans, LA | 3.0 | 2.0 | 1262 | $1,500 | $1.19 | 5d | 1 | 0.64mi |
| 400 Park Blvd Unit A New Orleans, LA | 4.0 | 1.5 | 1275 | $2,200 | $1.73 | 25d | 1 | 0.70mi |
| 513 Park Blvd New Orleans, LA | 3.0 | 2.0 | 1600 | $2,300 | $1.44 | 5d | 1 | 0.73mi |
| 701 Behrman Ave New Orleans, LA | 3.0 | 2.0 | 1368 | $2,300 | $1.68 | 5d | 1 | 0.86mi |
| 535 Decatur St Unit 3 New Orleans, LA | 3.0 | 2.0 | 1600 | $2,800 | $1.75 | 13d | 1 | 0.87mi |
| 515 Saint Ann St Unit 3 New Orleans, LA | 3.0 | 2.0 | 1644 | $3,600 | $2.19 | 46d | 1 | 0.87mi |
| 527 Saint Ann St Unit 3 New Orleans, LA | 3.0 | 2.0 | 1687 | $3,500 | $2.07 | 45d | 1 | 0.89mi |
| 751 Chartres St New Orleans, LA | 2.0–3.0 | 2.0 | 1461 | $3,450 | $2.36 | 45d | 1 | 0.93mi |
| 431 Gravier St Ste 4 New Orleans, LA | 3.0 | 2.0 | 2100 | $3,700 | $1.76 | 45d | 1 | 0.98mi |
| 632 Mandeville St Unit 2B New Orleans, LA | 4.0 | 4.5 | 1337 | $4,500 | $3.37 | 19d | 1 | 1.02mi |
| 1414 Sumner St New Orleans, LA | 3.0 | 2.0 | 1800 | $1,450 | $0.81 | 18d | 1 | 1.03mi |
| 1418 Royal St Unit 1418 New Orleans, LA | 4.0 | 2.0 | 1300 | $2,450 | $1.88 | 25d | 1 | 1.07mi |
| 734 Ursulines Ave New Orleans, LA | 3.0 | 2.0 | 1340 | $2,800 | $2.09 | 45d | 1 | 1.07mi |
| 3134 Burgundy St New Orleans, LA | 3.0 | 2.0 | 1887 | $2,900 | $1.54 | 25d | 1 | 1.12mi |
| 2322 Burgundy St Unit C New Orleans, LA | 3.0 | 2.0 | 1250 | $2,200 | $1.76 | 25d | 1 | 1.15mi |
| 810 Bienville St New Orleans, LA | 1.0–3.0 | 1.0–2.0 | 995 | $2,688 | $2.70 | 5d | 9 | 1.15mi |
| 800 Gravier St Unit 1272312P New Orleans, LA | 2.0–4.0 | 2.0–4.0 | 1673 | $6,169 | $3.69 | 16d | 2 | 1.17mi |
| 1050 Annunciation St Unit 1272355P New Orleans, LA | 2.0–5.0 | 2.0–4.0 | 1544 | $3,489 | $2.26 | 5d | 3 | 1.19mi |
| 811 Burgundy St New Orleans, LA | 4.0 | 2.5 | 2059 | $5,000 | $2.43 | 45d | 1 | 1.21mi |
| 2320 N Rampart St New Orleans, LA | 3.0 | 3.0 | 2317 | $3,700 | $1.60 | 45d | 1 | 1.22mi |
| 939 Iberville St New Orleans, LA | 1.0–3.0 | 1.0 | 1502 | $3,800 | $2.53 | 13d | 7 | 1.22mi |
| 2317 N Rampart St Unit 1272378P New Orleans, LA | 3.0–6.0 | 2.0–4.0 | 1581 | $4,154 | $2.63 | 5d | 2 | 1.24mi |
| 1038 Montegut St New Orleans, LA | 3.0 | 2.5 | 2250 | $4,200 | $1.87 | 45d | 1 | 1.25mi |
| 1038 Montegut St New Orleans, LA | 3.0 | 2.5 | 2250 | $4,200 | $1.87 | 25d | 1 | 1.25mi |
| 419 Carondelet St Unit PHB New Orleans, LA | 3.0 | 2.5 | 2546 | $5,700 | $2.24 | 5d | 1 | 1.25mi |
| 928 Kerlerec St New Orleans, LA | 3.0 | 3.5 | 1684 | $2,750 | $1.63 | 5d | 1 | 1.25mi |
| 928 Kerlerec St New Orleans, LA | 3.0 | 3.5 | 1684 | $2,750 | $1.63 | 5d | 1 | 1.25mi |
| 618 N Rampart St #204 New Orleans, LA | 3.0 | 2.5 | 1904 | $4,500 | $2.36 | 45d | 1 | 1.26mi |
| 822 Perdido St Unit 1272370P New Orleans, LA | 1.0–5.0 | 1.0–5.0 | 1447 | $5,974 | $4.13 | 5d | 4 | 1.27mi |
| 1011 Canal St Unit 1513939P New Orleans, LA | 4.0 | 4.0 | 1765 | $11,253 | $6.38 | 25d | 1 | 1.30mi |
| 1011 Canal St Unit 1513926P New Orleans, LA | 1.0–4.0 | 1.0–4.0 | 1016 | $12,077 | $11.88 | 3d | 2 | 1.30mi |
| 3221 Saint Claude Ave New Orleans, LA | 3.0 | 1.0 | 1900 | $1,650 | $0.87 | 25d | 1 | 1.32mi |
| 1010 Isbell St Gretna, LA | 3.0 | 1.0 | 1300 | $1,350 | $1.04 | 45d | 1 | 1.36mi |
| 1021 Henriette Delille St New Orleans, LA | 3.0 | 2.0 | 2012 | $2,250 | $1.12 | 19d | 1 | 1.36mi |
Listing history 29 events
-
2026-06-21days on market $345,000 Active 92 DOM
-
2026-06-18days on market $345,000 Active 89 DOM
-
2026-06-17days on market $345,000 Active 88 DOM
-
2026-06-16days on market $345,000 Active 87 DOM
-
2026-06-15days on market $345,000 Active 86 DOM
-
2026-06-13days on market $345,000 Active 84 DOM
-
2026-06-10days on market $345,000 Active 81 DOM
-
2026-06-09days on market $345,000 Active 80 DOM
-
2026-06-08days on market $345,000 Active 79 DOM
-
2026-06-07days on market $345,000 Active 78 DOM
-
2026-06-05days on market $345,000 Active 75 DOM
-
2026-06-03days on market $345,000 Active 74 DOM
-
2026-06-02days on market $345,000 Active 73 DOM
-
2026-06-02price $345,000 Active 72 DOM
-
2026-06-01days on market $350,000 Active 72 DOM
-
2026-05-31days on market $350,000 Active 71 DOM
-
2026-03-12$350,000 Active 1095-char remark
Show marketing remark (1097 chars)
Rare find in ALGIERS POINT! Historic Victorian Shotgun Double (4bed/2bath) with Ornate Brackets and freshly painted exterior. energy efficient windows, central A/C and heat on each side, utilities are metered individually, water on one source. Wrought iron fence welcomes you to raised home with covered concrete front porch and sturdy railings. solid wood entry doors open to beautiful wood floors, decorative fireplace mantels, 12foot high ceilings, spacious rooms and windows that let the sun shine in. Bedrooms have large closets with plenty of storage. Owner has been diligent on maintaining property. courtyard in back of property has a shade tree, storage shed and fenced backyard. second unit has 10 foot ceilings, attic access and freshly painted. both units have similar floorplans. quiet location on a paved street with walking distance to grocery store, school, parks, levee and ferry landing , many homeowners on this block. excellent rental or owner occupied. historic tax credits may be available both state and federal. financing options are available. ready to move into or rent.
-
2026-03-12$350,000 Active 1097-char remark
Show marketing remark (1097 chars)
Rare find in ALGIERS POINT! Historic Victorian Shotgun Double (4bed/2bath) with Ornate Brackets and freshly painted exterior. energy efficient windows, central A/C and heat on each side, utilities are metered individually, water on one source. Wrought iron fence welcomes you to raised home with covered concrete front porch and sturdy railings. solid wood entry doors open to beautiful wood floors, decorative fireplace mantels, 12foot high ceilings, spacious rooms and windows that let the sun shine in. Bedrooms have large closets with plenty of storage. Owner has been diligent on maintaining property. courtyard in back of property has a shade tree, storage shed and fenced backyard. second unit has 10 foot ceilings, attic access and freshly painted. both units have similar floorplans. quiet location on a paved street with walking distance to grocery store, school, parks, levee and ferry landing , many homeowners on this block. excellent rental or owner occupied. historic tax credits may be available both state and federal. financing options are available. ready to move into or rent.
-
2013-07-31soldstatus $235,500
-
2013-05-08$239,000
-
2010-06-23soldstatus $196,000
-
2010-06-21soldstatus $196,000
-
2010-04-10$199,000
-
2010-04-10$199,000
-
1997-09-11soldstatus $86,900
-
1997-09-10soldstatus $86,900
-
1997-03-12$92,500
-
1997-03-12$92,500
-
1995-04-28soldstatus $45,000
ⓘ Source: listings_history table (triggers on properties + properties_extension) + one-shot
backfill from property_details.listing_events for pre-trigger history.
Tax reassessment forecast LA · Resets to sale price
- Current annual tax
- $3,560 · $297/mo
- Projected year-2 tax
- $3,560 · $297/mo
- Expected delta
- $0/yr ($0/mo · 0.0%)
ⓘ Screening estimate from a state-policy table — verify with the county assessor before closing.
Climate risk First Street
- Flood 7/10 Severe FEMA zone X · 60% chance over 30 yrs
- Wildfire 1/10 Low
- Heat 10/10 Extreme 7 d/yr ≥108°F today · 21 d/yr by 30 yrs out
- Wind 10/10 Extreme 99% chance of damaging wind over 30 yrs
- Air quality 4/10 Moderate 4 unhealthy d/yr today · 4 by 30 yrs out
Nearby sold comps map
Loading sold comps map…
Walkable amenities ~0.75 mi
Loading nearby amenities…
Taxation est. · year 1
- Rental income
- $37,176
- − Mortgage interest
- −$19,325
- − Property taxes
- −$3,560
- − Insurance
- −$2,522
- − Repairs & maintenance
- −$2,974
- − Management
- −$2,974
- − Depreciation
- −$10,036
- Taxable loss
- −$4,217
- Est. tax savings @ 24.0%
- +$1,012
- After-tax cash flow
- $2,588/yr
For passive investors: Depreciation is non-cash, so a rental often shows a tax loss while cash-flowing — sheltering income. Rental losses are passive: they offset passive income freely, and up to $25,000/yr can offset ordinary (W-2) income if you actively participate and your MAGI is under $100k (phasing out to $0 by $150k); unused losses carry forward. On sale, claimed depreciation is recaptured at up to 25%, and gains may owe capital-gains tax (a 1031 exchange can defer both). Figures are a year-1 estimate at your 24.0% rate — not tax advice; consult a CPA.
Schools (NCES district)
- District
- Orleans Parish
- NCES district ID
- 2201170
- Math proficiency
- 11% ▼ -52.00%
- Reading proficiency
- 27% ▼ -46.00%
- Median HH income
- $37,011
- Composite
- 15.78/100
- National rank
- #9271
- State rank
- #69 of 98 in LA
Livability — New Orleans
- Score
- 81/100
- State rank
- #3
- US rank
- #1383
Category grades
Schools grade is shown separately in the Schools card above.
Census & demographics
- Census place
- New Orleans, LA
- County
- Orleans Parish · 338,817 people
- City population
- 338,817
- Metro
- New Orleans-Metairie, LA
- Population (ZIP)
- 22,659
- Household income
- $43,493
- Rent vs Own
- Severe rent burden
- 2240.0
Population outlook (Orleans County) Hauer SSP2
- Today (2025)
- 513,025 people
- By 2030
- 575,781 · +12.2%
- By 2040
- 700,174 · +36.5%
- By 2050
- 826,541 · +61.1%
- By 2075
- 1,123,374 · +119.0%
- By 2100
- 1,355,609 · +164.2%
Race, ethnicity, and origin ACS 2023
- Neighborhood character
- Predominantly Black (72%)
- Race & ethnicity
- Black 72% White 16% Hispanic / Latino 8% Two or more races 5%
- Hispanic origin (detail)
- Mexican 2% Puerto Rican 1%
- Common ancestry
- Lithuanian 3% Slovak 1% Italian 1%
- Foreign-born
- 5% · Canada
- Languages at home
- 91% English-only · Spanish 6% French/Haitian/Cajun 2% Other Indo-European 1%
Political lean MEDSL · Orleans
- 2024 margin
- Solid D (+67.0) · D 82.2% · R 15.2% · Other 2.7%
- 2008→2024 swing
- +6.7pp toward D · 2008: 60.3pp · 2024: 67.0pp
- All cycles
- 2024: D+67.0 2020: D+68.2 2016: D+66.2 2012: D+62.5 2008: D+60.3
Not yet ingested
- Civics
- —
Market trends
- HPI YoY
- ▼ -98.56%
- Current HPI
- 149.0172
- Rent YoY
- ▼ -0.72%
- Metro
- New Orleans-Metairie, LA
- State GDP YoY
- ▲ 3.29%
- F500 in state
- 10
Industry mix (Fortune 500 HQ in LA)
| Industry | F500 HQs | Revenue |
|---|---|---|
| Telecommunications | 2 | $23B |
|
||
| Utilities | 1 | $12B |
|
||
| Wholesale / Distribution | 1 | $5B |
|
||
| Advertising | 1 | $2B |
|
||
Price history
+677.8% since first listed13 events — show timeline
- 2026-03-12 Listed $350,000 GSREIN
- 2026-03-12 Listed $350,000 AcadianaMLS
- 2013-07-31 Sold (Public Records) $235,500 Public Records
- 2013-05-08 Listed $239,000 AcadianaMLS
- 2010-06-23 Sold (Public Records) $196,000 Public Records
- 2010-06-21 Sold (MLS) $196,000 GSREIN
- 2010-04-10 Listed $199,000 AcadianaMLS
- 2010-04-10 Listed $199,000 GSREIN
- 1997-09-11 Sold (Public Records) $86,900 Public Records
- 1997-09-10 Sold (MLS) $86,900 GSREIN
- 1997-03-12 Listed $92,500 GSREIN
- 1997-03-12 Listed $92,500 AcadianaMLS
- 1995-04-28 Sold (Public Records) $45,000 Public Records
Property tax history
+0.1%/yrLatest (2026): $3,560 · +0.0% YoY. Source: county tax records.
Cash-flow waterfall
monthlySold comps — $/sqft
last 12 mo · ≤1 miLoading sold comps…