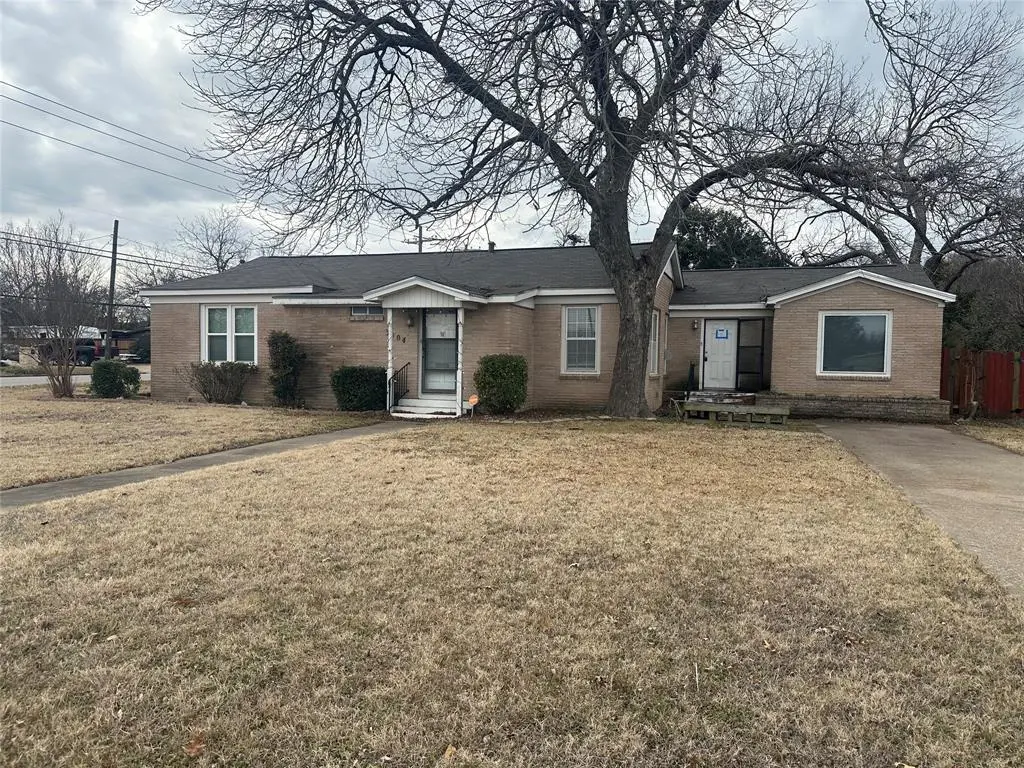
3204 N 31st St · Waco, TX
Flood risk 1/10 · Minimal
- FEMA flood zone
- X (unshaded)
- Chance of flooding over 30 yrs
- 0.0%
- Est. flood insurance / yr
- $507 – $1,088
Fire risk 4/10 · Minor
- Est. fire insurance / yr
- $1,222 – $2,270
Heat risk 7/10 · Major
- Hot days now (above 109°F)
- 7 days/yr
- Hot days in 30 yrs
- 24 days/yr
Wind risk 6/10 · Moderate
- Chance of severe wind over 30 yrs
- 60.0%
Air-quality risk 2/10 · Minimal
- Unhealthy air days now
- 0 days/yr
- Unhealthy air days in 30 yrs
- 1 days/yr
Risk factors via First Street. Map © Google.
Why this score? — see what drove the C- grade
The composite is a weighted blend of 9 inputs, each scored 0–100. Each bar is that input's sub-score; the figure is the points it added to the 100-point composite (weight × sub-score).
- ARV discount +15.0/15.0
- Cash flow +14.5/30.0
- 1% rule +6.9/10.0
- DSCR +4.4/10.0
- Livability +3.7/5.0
- Condition / age +2.5/5.0
- Rent growth +2.3/5.0
- Schools +1.8/10.0
- Appreciation +0.0/10.0
$145,000
🖨 Deal sheet (PDF) 📄 Offer letter ✓ Due diligence
Listing remarks MLS
Huge corner lot with so much potential. This home is owned by the Secretary of Veterans Affairs. They do not pay customary closing costs such as title or survey.
Key facts
- 0.46 acre lot
- 2 parking spots
- Built 1950
Neighborhood map
What this means for you Summary
Snapshot
- This is a 3-bed/2.0-bath single-family listed at $145k.
Deal economics
- At list price, monthly cash flow is $33 ($393/yr) — positive.
- The deal already cash-flows at list — no discount required.
- Meets the 1% rule at list price ($2k rent vs $145k).
- Recommended offer: $132k (9.0% below list) — sets the bar for market timing.
- Cap rate 6.6% vs local median 3.9% in Waco — top-decile yield for the area; either an underpriced asset or a hidden risk that comps aren't pricing in. Stress-test before assuming the spread holds.
Location & tenants
- Location reads 74/100 on livability (#166 in TX, #4,378 nationally) — a middle-class / working-renter tenant base. Strengths: cost of living A+, housing A+, health & safety A+; Watch: crime D, commute F, employment D-.
- Waco ISD (urban): math 20% / reading 24% proficiency, ranked #773 of 826 in TX (top 94%) — low school quality limits family demand, transient renter base, plan for 1-2y turnover; 81% free/reduced lunch — lower-income household profile, screen leases tightly.
- Zoned schools: Mountainview El (math 12% / reading 27%, grade F, #3,583 of 4,322 statewide, top 86%, 402 students, 78% FRL); Tennyson Middle (math 29% / reading 35%, grade F, #971 of 1,662 statewide, top 60%, 999 students, 86% FRL); Waco H S (math 26% / reading 24%, grade F, #1,250 of 1,632 statewide, top 77%, 2,011 students, 88% FRL) — zoned schools at 84% FRL track the district average.
- Market conditions: Rents soft (-0.8%/yr); 381 active listings in the ZIP; 24 comparable units currently listed for rent nearby; rentals at typical pace (median 23d on market — plan ~3-4 weeks tenant-placement turnaround); 1,014 units permitted in McLennan County in 2024 (200 in 5+ unit buildings).
Forward outlook
- Local home prices are declining (-3.0%/yr); year-one equity from $1k of loan paydown is wiped out by about $4k of value loss. Plan a longer hold.
- McLennan County population projected at +17% by 2050 — long-run rental-demand tailwind backs the buy-and-hold thesis.
Negotiation context
- It's been on market 113 days — a 9% lower offer ($132k) is reasonable based on typical stale-listing flexibility.
- 4 sale attempts since 4y ago; this cycle's ask has dropped $38k (21%) from the opening price — seller is motivated, your offer sets the floor, not the list.
Risks & watch-outs
- Watch-outs: property tax is 4.2% of price; built in 1950 — expect roof / HVAC / electrical / plumbing capex.
- Climate carrying-cost: major wind risk, 60% chance of damaging wind over 30y; extreme-heat days projected 7→24/yr by 2055 (HVAC capex compounding) — expect insurance premiums to compound above CPI over the hold.
Questions for the listing agent
- It's been on market 113 days. Have you received any prior offers? Is the seller open to a 9% concession, seller financing, or rate buy-down credit?
- Built in 1950 — when were the roof, HVAC, electrical panel, plumbing, and water heater last replaced?
- Property tax is high relative to price — has the assessment been appealed recently, and will the sale trigger a re-assessment?
- Why hasn't it sold? Are there any deal-killer items the seller is aware of (foundation, flood, title, zoning, code violations)?
- Is there a deadline driving the sale (1031 exchange, divorce, estate, relocation)? That informs how much negotiation room exists.
- Schools are D-rated, which usually means shorter tenancies and higher turnover. Who's the typical renter profile here, and what's been the actual vacancy rate?
- Crime grade is D in this area — have there been break-ins, vandalism, or insurance claims at this property in the last 3 years? What carrier currently insures it and at what premium?
- What's the average days-on-market for RENTAL listings here right now (not sales)? A rising rental-DOM trend means longer vacancies and softer asking-rent achievability than the comps imply.
- What's the recent tenant-quality profile in this submarket — average credit score on applications, eviction rate, late-payment / NSF rate, and stable-employment percentage? A property-management company in the area should have these aggregated.
- How much new for-sale + rental construction is in the pipeline within 1–3 miles? Heavy new supply typically softens prices + rents 12–24 months out; constrained supply supports both.
Investment metrics
- 1% rule
- 1.19% ✓
- Cap rate
- 6.56%
- Cash-on-cash
- 0.97%
- DSCR
- 1.04
- GRM
- 7.0
CMA / ARV
- ARV (median comp)
- $207,143
- List price
- $145,000
- Delta
- -30.00%
- Verdict
- UNDERPRICED
- Comps
- 20 within 1.0 mi
Show comp detail 12 sales within ~0.75 mi
| Address | Dist | Beds/Ba | Sqft | Sold | Price | $/sf | Match |
|---|---|---|---|---|---|---|---|
| 3216 Macarthur Dr | 0.18mi | 3/2.0 | 1,860 (-2%) | 4mo | $199,900 | $107 | 85 |
| 3412 N 32nd St | 0.21mi | 3/2.0 | 1,662 (-12%) | 1mo | $285,000 | $171 | 69 |
| 3020 Mcferrin Ave | 0.14mi | 3/2.0 | 1,724 (-9%) | 12mo | $180,000 | $104 | 68 |
| 3313 Cliffdale Dr | 0.70mi | 3/2.0 | 1,899 (+0%) | 0mo | $325,000 | $171 | 66 |
| 2412 Summer Ave | 0.54mi | 3/2.0 | 1,861 (-2%) | 7mo | $105,000 | $56 | 66 |
| 3310 Lake Heights Dr | 0.63mi | 3/2.0 | 1,892 (-0%) | 6mo | $270,000 | $143 | 65 |
| 2701 Macarthur Dr | 0.47mi | 3/2.0 | 1,991 (+5%) | 8mo | $99,350 | $50 | 63 |
| 3917 N 31st St | 0.60mi | 3/2.5 | 1,945 (+3%) | 8mo | $344,900 | $177 | 59 |
| 3808 N 27 St | 0.55mi | 3/1.0 | 1,661 (-12%) | 4mo | $225,000 | $135 | 47 |
| 3407 Oakridge Ln | 0.61mi | 3/2.0 | 2,089 (+10%) | 12mo | $334,000 | $160 | 45 |
| 3317 Mitchell Rd | 0.58mi | 3/2.0 | 1,628 (-14%) | 9mo | $249,900 | $154 | 42 |
| 4016 N 27th St | 0.72mi | 4/2.0 (+1) | 2,137 (+13%) | 10mo | $450,000 | $211 | 31 |
Match score weights: distance 35% · size 25% · config 20% · recency 20%. Top-matched comps best support the ARV.
Projected returns pro-forma
-3.0% appreciation · 0.0% rent growth · sell at horizon
- IRR
- -19.1%
- Equity multiple
- 0.35×
- Total profit
- $-26,224
- Equity at exit
- $21,620
- IRR
- -23.1%
- Equity multiple
- 0.05×
- Total profit
- $-38,712
- Equity at exit
- $12,537
Cash invested: $40,600 (down + closing). Projections, not guarantees.
Landlord ↔ Tenant lean methodology
- Overall (STATE)
- 87 Strongly Landlord-Friendly
- State Texas
- 87 Strongly Landlord-Friendly · R+5
- County
- — inherits STATE
- City
- — inherits STATE
ZIP-level market 76708
- Home prices YoY
- -26.5%
- Rents YoY
- -0.8%
- Active inventory
- 381
- Price-to-rent
- 7.0×
Monthly cashflow live
- Estimated rent
- $1,720 high interval (Pro) →
- Mortgage (P&I)
- −$760
- Tax from tax record
- −$505 /mo · $6,063/yr
- Insurance
- −$60
- HOA
- −$0
- Vacancy / Maint / Mgmt
- −$361
- Net cashflow
- $33
Break-even live
Sensitivity live
| Price | -10% $115 | -5% $74 | +0% $33 | +5% $-8 | +10% $-49 |
|---|---|---|---|---|---|
| Rent | -10% $-103 | -5% $-35 | +0% $33 | +5% $101 | +10% $169 |
| Rate | -1.0pp $106 | -0.5pp $70 | base $33 | +0.5pp $-5 | +1.0pp $-43 |
UW: 25.0% down · 7.5% · 30yr · 1.5% tax · 5.0% vac · 8.0% maint · 8.0% mgmt
Financing live
Cash to close
- Down payment
- $36,250
- Closing costs
- $4,350
- Reserves months
- —
- Total cash needed
- —
Loan-product check · same deal, 3 products live
Conventional
25% down · 7.5% · 30yr
- Down + closing
- —
- Monthly P&I
- —
- Monthly cashflow
- —
- DSCR
- —
- Eligible?
- —
Personal DTI + credit; lowest rate.
DSCR
20% down · 8.5% · 30yr
- Down + closing
- —
- Monthly P&I
- —
- Monthly cashflow
- —
- DSCR
- —
- Eligible?
- —
No personal income docs; deal must DSCR.
Hard money
10% down · 12.0% · 12mo
- Down + closing
- —
- Monthly P&I
- —
- Monthly cashflow
- —
- DSCR
- —
- Eligible?
- —
Short-term bridge; refi at stabilization.
Rent comps 24 comps
| Address | Beds | Baths | Sqft | Rent | $/sqft | DOM | Units | Dist |
|---|---|---|---|---|---|---|---|---|
| 3310 MacArthur Dr Waco, TX | 3.0 | 2.0 | 1586 | $2,000 | $1.26 | 15d | 1 | 0.20mi |
| 2400 Reuter Ave Waco, TX | 4.0 | 2.0 | 1426 | $1,650 | $1.16 | 22d | 1 | 0.60mi |
| 2401 McKenzie Ave Waco, TX | 3.0 | 1.5 | 1288 | $1,300 | $1.01 | 22d | 1 | 0.62mi |
| 2704 Herring Ave Waco, TX | 2.0 | 2.0 | 1286 | $1,750 | $1.36 | 22d | 1 | 0.76mi |
| 4372 Lake Shore Dr Waco, TX | 1.0–3.0 | 1.0–2.0 | 1027 | $1,480 | $1.44 | 15d | 1 | 0.77mi |
| 3800 N 21st a St Waco, TX | 4.0 | 2.5 | 1500 | $1,350 | $0.90 | 22d | 1 | 0.84mi |
| 2505 Proctor Ave Waco, TX | 3.0 | 2.0 | 1588 | $1,550 | $0.98 | 22d | 1 | 0.86mi |
| 2810 Stewart Dr Waco, TX | 2.0 | 2.0 | 1326 | $1,735 | $1.31 | 22d | 1 | 0.89mi |
| 2804 Stewart Dr Waco, TX | 2.0 | 2.0 | 1327 | $1,475 | $1.11 | 45d | 1 | 0.90mi |
| 2802 Stewart Dr Waco, TX | 2.0 | 2.0 | 1326 | $1,635 | $1.23 | 15d | 1 | 0.92mi |
| 2100 N 33rd St Waco, TX | 3.0 | 3.0 | 1858 | $2,200 | $1.18 | 45d | 1 | 1.01mi |
| 1920 Lyle Ave Waco, TX | 2.0 | 1.0 | 1519 | $1,200 | $0.79 | 45d | 1 | 1.06mi |
| 1920 Lyle Ave Waco, TX | 2.0 | 1.0 | 1519 | $1,200 | $0.79 | 22d | 1 | 1.06mi |
| 3825 Kimberly Dr Waco, TX | 2.0 | 2.0 | 1233 | $1,250 | $1.01 | 22d | 1 | 1.07mi |
| 2736 Lake Shore Dr Waco, TX | 1.0–2.0 | 1.0–2.0 | 1034 | $1,774 | $1.71 | 15d | 1 | 1.11mi |
| 1817 Lyle Ave Waco, TX | 3.0 | 2.5 | 2430 | $2,295 | $0.94 | 22d | 1 | 1.12mi |
| 1621 Alexander Ave Unit A Waco, TX | 3.0 | 2.0 | 1400 | $1,695 | $1.21 | 22d | 1 | 1.16mi |
| 1901 N 28th St Waco, TX | 3.0 | 2.0 | 1794 | $1,950 | $1.09 | 22d | 1 | 1.23mi |
| 2213 N 41st St Waco, TX | 3.0 | 1.5 | 1299 | $1,550 | $1.19 | 15d | 1 | 1.29mi |
| 2000 Windsor Ave Waco, TX | 4.0 | 2.5 | 1450 | $1,800 | $1.24 | 45d | 1 | 1.30mi |
| 3007 Parrott Ave Unit 1 Waco, TX | 3.0 | 2.0 | 1458 | $1,650 | $1.13 | 22d | 1 | 1.39mi |
| 1825 Cumberland Ave Waco, TX | 3.0 | 1.0 | 1400 | $1,325 | $0.95 | 15d | 1 | 1.41mi |
| 3400 Adeline Dr Waco, TX | 2.0 | 1.0 | 1232 | $1,150 | $0.93 | 45d | 1 | 1.44mi |
| 2511 Parrott Ave Waco, TX | 3.0 | 2.0 | 1463 | $1,695 | $1.16 | 45d | 1 | 1.46mi |
Listing history 19 events
-
2026-05-13price $145,000 163-char remark
Show marketing remark (163 chars)
Huge corner lot with so much potential. This home is owned by the Secretary of Veterans Affairs. They do not pay customary closing costs such as title or survey.
-
2026-05-05status Active 163-char remark
Show marketing remark (163 chars)
Huge corner lot with so much potential. This home is owned by the Secretary of Veterans Affairs. They do not pay customary closing costs such as title or survey.
-
2026-05-04historical 163-char remark
Show marketing remark (163 chars)
Huge corner lot with so much potential. This home is owned by the Secretary of Veterans Affairs. They do not pay customary closing costs such as title or survey.
-
2026-04-08price $160,000 163-char remark
Show marketing remark (163 chars)
Huge corner lot with so much potential. This home is owned by the Secretary of Veterans Affairs. They do not pay customary closing costs such as title or survey.
-
2026-03-11price $170,000 163-char remark
Show marketing remark (163 chars)
Huge corner lot with so much potential. This home is owned by the Secretary of Veterans Affairs. They do not pay customary closing costs such as title or survey.
-
2026-02-03$183,000 Active 163-char remark
Show marketing remark (163 chars)
Huge corner lot with so much potential. This home is owned by the Secretary of Veterans Affairs. They do not pay customary closing costs such as title or survey.
-
2025-09-02historical
-
2025-08-16price $230,000
-
2025-07-13price $240,000
-
2025-07-12price $259,000
-
2025-07-04price $265,000
-
2025-06-09price $267,750
-
2025-06-01price $275,000
-
2025-04-18$280,000 Active
-
2022-09-29soldstatus
-
2022-09-28soldstatus
-
2022-07-14$259,500
-
2006-08-30soldstatus
-
2004-07-19soldstatus
ⓘ Source: listings_history table (triggers on properties + properties_extension) + one-shot
backfill from property_details.listing_events for pre-trigger history.
Tax reassessment forecast TX · Resets to sale price
- Current annual tax
- $6,063 · $505/mo
- Projected year-2 tax
- $6,063 · $505/mo
- Expected delta
- $0/yr ($0/mo · 0.0%)
ⓘ Screening estimate from a state-policy table — verify with the county assessor before closing.
Climate risk First Street
- Flood 1/10 Low FEMA zone X (unshaded) · 0% chance over 30 yrs
- Wildfire 4/10 Moderate
- Heat 7/10 Severe 7 d/yr ≥109°F today · 24 d/yr by 30 yrs out
- Wind 6/10 Major 60% chance of damaging wind over 30 yrs
- Air quality 2/10 Low 0 unhealthy d/yr today · 1 by 30 yrs out
Nearby sold comps map
Loading sold comps map…
Walkable amenities ~0.75 mi
Loading nearby amenities…
Taxation est. · year 1
- Rental income
- $20,640
- − Mortgage interest
- −$8,122
- − Property taxes
- −$6,063
- − Insurance
- −$725
- − Repairs & maintenance
- −$1,651
- − Management
- −$1,651
- − Depreciation
- −$4,218
- Taxable loss
- −$1,790
- Est. tax savings @ 24.0%
- +$430
- After-tax cash flow
- $823/yr
For passive investors: Depreciation is non-cash, so a rental often shows a tax loss while cash-flowing — sheltering income. Rental losses are passive: they offset passive income freely, and up to $25,000/yr can offset ordinary (W-2) income if you actively participate and your MAGI is under $100k (phasing out to $0 by $150k); unused losses carry forward. On sale, claimed depreciation is recaptured at up to 25%, and gains may owe capital-gains tax (a 1031 exchange can defer both). Figures are a year-1 estimate at your 24.0% rate — not tax advice; consult a CPA.
Schools (NCES district)
- District
- Waco ISD
- NCES district ID
- 4844280
- Math proficiency
- 20% ▼ -14.00%
- Reading proficiency
- 24% ▼ -6.00%
- Median HH income
- $29,208
- Composite
- 17.57/100
- National rank
- #9043
- State rank
- #773 of 826 in TX
Livability — Waco
- Score
- 74/100
- State rank
- #166
- US rank
- #4378
Category grades
Schools grade is shown separately in the Schools card above.
Census & demographics
- Census place
- Waco, TX
- County
- McLennan County · 213,088 people
- City population
- 125,319
- Metro
- Waco, TX
- Population (ZIP)
- 27,790
- Household income
- $68,856
- Rent vs Own
- Severe rent burden
- 583.0
Population outlook (McLennan County) Hauer SSP2
- Today (2025)
- 264,191 people
- By 2030
- 273,578 · +3.6%
- By 2040
- 291,506 · +10.3%
- By 2050
- 308,044 · +16.6%
- By 2075
- 349,648 · +32.3%
- By 2100
- 364,779 · +38.1%
Race, ethnicity, and origin ACS 2023
- Neighborhood character
- Diverse neighborhood (Simpson 0.63)
- Race & ethnicity
- White 50% Hispanic / Latino 31% Two or more races 20% Black 13% Asian 2%
- Hispanic origin (detail)
- Mexican 28%
- Common ancestry
- Slovak 2% Lithuanian 1% Italian 1%
- Foreign-born
- 11% · Canada, Vietnam
- Languages at home
- 76% English-only · Spanish 21% Other Asian/Pacific 1%
Political lean MEDSL · McLennan
- 2024 margin
- Solid R (+30.9) · D 34.0% · R 64.9% · Other 1.0%
- 2008→2024 swing
- -7.0pp toward R · 2008: -23.9pp · 2024: -30.9pp
- All cycles
- 2024: R+30.9 2020: R+23.4 2016: R+27.1 2012: R+29.8 2008: R+23.9
Not yet ingested
- Civics
- —
Market trends
- HPI YoY
- ▼ -78.80%
- Current HPI
- 218.9643
- Rent YoY
- ▼ -0.80%
- Metro
- Waco, TX
- State GDP YoY
- ▲ 3.95%
- F500 in state
- 110
Industry mix (Fortune 500 HQ in TX)
| Industry | F500 HQs | Revenue |
|---|---|---|
| Energy | 16 | $1,198B |
|
||
| Technology | 5 | $198B |
|
||
| Engineering / Construction | 4 | $72B |
|
||
| Energy Services | 3 | $60B |
|
||
| Utilities | 3 | $41B |
|
||
| Healthcare | 2 | $330B |
|
||
Price history
-44.1% since first listed19 events — show timeline
- 2026-05-13 Price Changed $145,000 NTREIS
- 2026-05-05 Relisted — NTREIS
- 2026-05-04 Listing Removed — NTREIS
- 2026-04-08 Price Changed $160,000 NTREIS
- 2026-03-11 Price Changed $170,000 NTREIS
- 2026-02-03 Listed $183,000 NTREIS
- 2025-09-02 Listing Removed — NTREIS
- 2025-08-16 Price Changed $230,000 NTREIS
- 2025-07-13 Price Changed $240,000 NTREIS
- 2025-07-12 Price Changed $259,000 NTREIS
- 2025-07-04 Price Changed $265,000 NTREIS
- 2025-06-09 Price Changed $267,750 NTREIS
- 2025-06-01 Price Changed $275,000 NTREIS
- 2025-04-18 Listed $280,000 NTREIS
- 2022-09-29 Sold (Public Records) — Public Records
- 2022-09-28 Sold (MLS) — NTREIS
- 2022-07-14 Listed $259,500 NTREIS
- 2006-08-30 Sold (Public Records) — Public Records
- 2004-07-19 Sold (Public Records) — Public Records
Property tax history
+8.4%/yrLatest (2025): $6,063 · -0.1% YoY. Source: county tax records.
Cash-flow waterfall
monthlySold comps — $/sqft
last 12 mo · ≤1 miLoading sold comps…