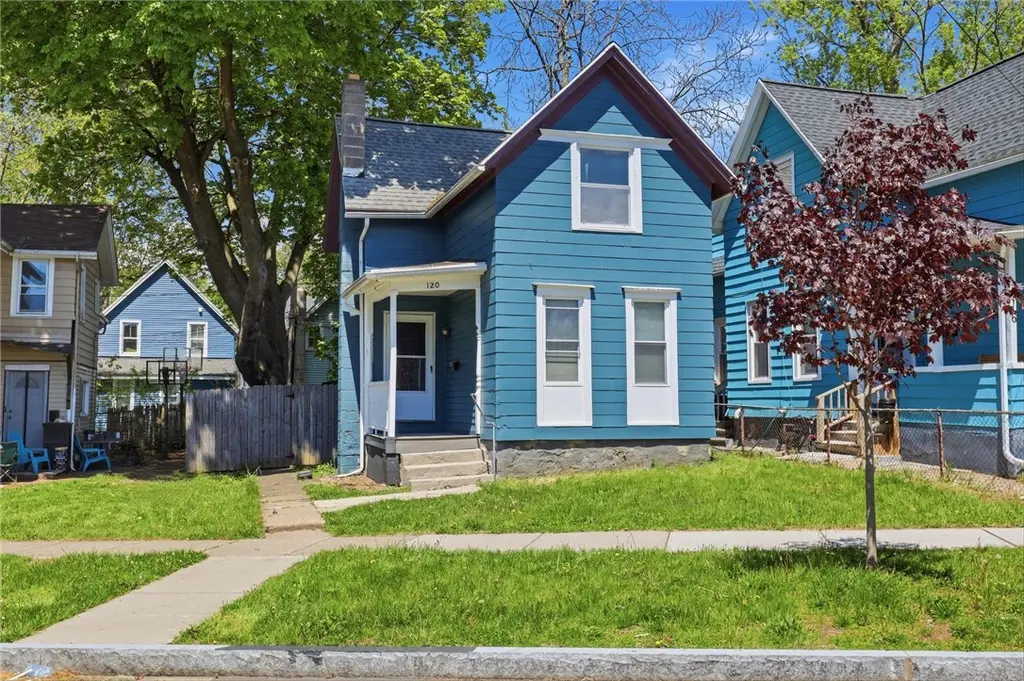
120 Cottage St · Rochester, NY
Flood risk 1/10 · Minimal
- FEMA flood zone
- X (unshaded)
- Chance of flooding over 30 yrs
- 0.0%
- Est. flood insurance / yr
- $473 – $860
Fire risk 2/10 · Minimal
- Est. fire insurance / yr
- $691 – $1,283
Heat risk 2/10 · Minimal
- Hot days now (above 96°F)
- 7 days/yr
- Hot days in 30 yrs
- 14 days/yr
Wind risk 1/10 · Minimal
- Chance of severe wind over 30 yrs
- —
Air-quality risk 2/10 · Minimal
- Unhealthy air days now
- 1 days/yr
- Unhealthy air days in 30 yrs
- 1 days/yr
Risk factors via First Street. Map © Google.
Why this score? — see what drove the B+ grade
The composite is a weighted blend of 9 inputs, each scored 0–100. Each bar is that input's sub-score; the figure is the points it added to the 100-point composite (weight × sub-score).
- Cash flow +30.0/30.0
- 1% rule +10.0/10.0
- DSCR +10.0/10.0
- ARV discount +8.3/15.0
- Appreciation +6.8/10.0
- Rent growth +4.2/5.0
- Livability +3.8/5.0
- Condition / age +2.5/5.0
- Schools +1.9/10.0
$119,990
🖨 Deal sheet 📄 Offer letter ✓ Due diligence
Listing remarks
Welcome home! This thoughtfully updated gem feels like a brand-new home from the moment you walk in. Featuring new flooring, fresh carpet, fresh paint and a beautifully renovated upstairs bathroom, every space has been refreshed with comfort and style in mind. Perfect for first-time home buyers or savvy investors, this move-in ready home means no extra projects or weekend repair lists — just unpack and enjoy. The convenient first-floor laundry and half bath make everyday living easy, while basement laundry hookups offer flexibility if you'd prefer to convert the laundry area into a potential fourth bedroom or bonus space. Step outside to enjoy the private backyard, perfect for relaxin
Key facts
- Fresh paint
- Private backyard
- New flooring
Tags
Property features AI
Exterior
- Parking: No garage; No driveway
- Utilities: Electricity connected; High-speed internet available; Sewer connected; Public water connected
- Home design: Two stories; Existing construction
- Construction: Composite siding; PEX plumbing; Stone foundation; Asphalt roof
- Exterior features: Fully fenced yard; Covered and open porch; Patio/porch
Interior
- Kitchen: Gas oven; Gas range; Refrigerator
- Bedrooms: One main-level bedroom
- Flooring: Carpet; Linoleum; Vinyl; Varies
- Bathrooms: One full bathroom; One half bathroom; One main-level bathroom
- Heating & cooling: Gas forced-air heating
- Interior features: Eat-in kitchen; Separate/formal living room; Convertible bedroom; See remarks
- Laundry & utility: Main-level laundry; Gas water heater
Neighborhood map
What this means for you Summary
Snapshot
- This is a 4-bed/1.5-bath single-family listed at $120k.
Deal economics
- At list price, monthly cash flow is $709 ($9k/yr) — positive.
- The deal already cash-flows at list — no discount required.
- Meets the 1% rule at list price ($2k rent vs $120k).
- Recommended offer: $118k (1.5% below list) — sets the bar for market timing.
- Cap rate 13.4% vs local median 9.3% in Rochester — top-decile yield for the area; either an underpriced asset or a hidden risk that comps aren't pricing in. Stress-test before assuming the spread holds.
Location & tenants
- Location reads 76/100 on livability (#222 in NY, #3,482 nationally) — a middle-class / working-renter tenant base. Strengths: commute A+, cost of living A+, housing A+; Watch: schools D+, crime F, employment F.
- Rochester City School District (urban): math 21% / reading 26% proficiency, ranked #589 of 590 in NY (top 100%) — low school quality limits family demand, transient renter base, plan for 1-2y turnover; 82% free/reduced lunch — lower-income household profile, screen leases tightly.
- Market conditions: Rents rising fast (+6.6%/yr); 51 active listings in the ZIP; 21 comparable units currently listed for rent nearby; rentals at typical pace (median 24d on market — plan ~3-4 weeks tenant-placement turnaround); 43% of comp listings sitting > 30 days — soft ceiling on asking rent; lower-income renter base — watch delinquency; 1,169 units permitted in Monroe County in 2024 (591 in 5+ unit buildings).
- At $1,853/mo this rent would consume 55% of the median local household income ($41k/yr) (locally 1300% of renters already pay >50% of income on rent) — very limited rent-growth headroom before tenants either downsize or default.
Forward outlook
- In year one you build about $5k of equity ($830 loan paydown + $4k appreciation (3.7% local appreciation)).
- Monroe County population projected to shrink 6% by 2050 — rents likely to lag national; underwrite the cash flow, not the appreciation.
- At projected returns (3.7% appreciation + 6.6% rent growth), your $34k cash investment doubles in ~3 years — after that, you're playing with house money.
- By year 7, paydown + projected appreciation supports a ~$33k cash-out refi (75% LTV) — recoverable capital for the next deal without selling this one.
Negotiation context
- It's been on market 16 days — a 2% lower offer ($118k) is reasonable based on typical stale-listing flexibility.
- 2 sale attempts with the ask held roughly flat each time — persistent listings suggest the price (not the market) is what's stuck; bring a comps-based counter.
Risks & watch-outs
- Watch-outs: built in 1890 — expect roof / HVAC / electrical / plumbing capex.
Questions for the listing agent
- Built in 1890 — when were the roof, HVAC, electrical panel, plumbing, and water heater last replaced?
- Is there a deadline driving the sale (1031 exchange, divorce, estate, relocation)? That informs how much negotiation room exists.
- Schools are D-rated, which usually means shorter tenancies and higher turnover. Who's the typical renter profile here, and what's been the actual vacancy rate?
- Crime grade is F in this area — have there been break-ins, vandalism, or insurance claims at this property in the last 3 years? What carrier currently insures it and at what premium?
- What's the average days-on-market for RENTAL listings here right now (not sales)? A rising rental-DOM trend means longer vacancies and softer asking-rent achievability than the comps imply.
- What's the recent tenant-quality profile in this submarket — average credit score on applications, eviction rate, late-payment / NSF rate, and stable-employment percentage? A property-management company in the area should have these aggregated.
- How much new for-sale + rental construction is in the pipeline within 1–3 miles? Heavy new supply typically softens prices + rents 12–24 months out; constrained supply supports both.
Investment metrics
- 1% rule
- 1.54% ✓
- Cap rate
- 13.38%
- Cash-on-cash
- 25.31%
- DSCR
- 2.13
- GRM
- 5.4
CMA / ARV
- ARV (median comp)
- $122,141
- List price
- $119,990
- Delta
- -1.76%
- Verdict
- FAIR
- Comps
- 20 within 1.0 mi
Show comp detail 12 sales within ~0.75 mi
| Address | Dist | Beds/Ba | Sqft | Sold | Price | $/sf | Match |
|---|---|---|---|---|---|---|---|
| 90 Cottage St | 0.04mi | 3/1.0 (-1) | 1,303 (+6%) | 1mo | $145,000 | $111 | 81 |
| 1074 Exchange St | 0.17mi | 3/1.0 (-1) | 1,170 (-5%) | 1mo | $120,000 | $103 | 75 |
| 84 Stratford Park | 0.35mi | 3/1.0 (-1) | 1,275 (+4%) | 1mo | $83,000 | $65 | 70 |
| 18 Melrose St | 0.58mi | 4/1.5 | 1,286 (+4%) | 2mo | $180,000 | $140 | 64 |
| 797 Seward St | 0.36mi | 3/1.5 (-1) | 1,336 (+8%) | 1mo | $170,000 | $127 | 64 |
| 116 W High Ter | 0.65mi | 3/1.0 (-1) | 1,256 (+2%) | 6mo | $74,500 | $59 | 54 |
| 790 Genesee St | 0.46mi | 4/2.0 | 1,389 (+13%) | 2mo | $145,000 | $104 | 54 |
| 88 Monica St | 0.60mi | 4/1.0 | 1,342 (+9%) | 2mo | $97,500 | $73 | 54 |
| 92 Sawyer St | 0.43mi | 3/1.5 (-1) | 1,388 (+13%) | 2mo | $166,000 | $120 | 52 |
| 98 Barton St | 0.33mi | 3/1.0 (-1) | 1,401 (+14%) | 5mo | $151,000 | $108 | 50 |
| 36 Spruce Ave | 0.73mi | 3/1.0 (-1) | 1,172 (-5%) | 3mo | $165,000 | $141 | 48 |
| 455 Frost Ave | 0.67mi | 3/1.5 (-1) | 1,352 (+10%) | 1mo | $77,000 | $57 | 47 |
Match score weights: distance 35% · size 25% · config 20% · recency 20%. Top-matched comps best support the ARV.
Projected returns pro-forma
3.69% appreciation · 6.61% rent growth · sell at horizon
- IRR
- 35.2%
- Equity multiple
- 3.11×
- Total profit
- $70,984
- Equity at exit
- $58,682
- IRR
- 36.5%
- Equity multiple
- 6.84×
- Total profit
- $196,180
- Equity at exit
- $94,298
Cash invested: $33,597 (down + closing). Projections, not guarantees.
Landlord ↔ Tenant lean methodology
- Overall (STATE)
- 15 Strongly Tenant-Friendly
- State New York
- 15 Strongly Tenant-Friendly · D+10
- County
- — inherits STATE
- City
- — inherits STATE
ZIP-level market 14608
- Home prices YoY
- 1.3%
- Rents YoY
- 6.6%
- Active inventory
- 51
- Price-to-rent
- 5.4×
Monthly cashflow live
- Estimated rent
- $1,853 high interval (Pro) →
- Mortgage (P&I)
- −$629
- Tax from tax record
- −$76 /mo · $915/yr
- Insurance
- −$50
- HOA
- −$0
- Vacancy / Maint / Mgmt
- −$389
- Net cashflow
- $709
Break-even live
UW: 25.0% down · 7.5% · 30yr · 1.5% tax · 5.0% vac · 8.0% maint · 8.0% mgmt
Financing live
Cash to close
- Down payment
- $29,998
- Closing costs
- $3,600
- Reserves months
- —
- Total cash needed
- —
Loan-product check · same deal, 3 products live
Conventional
25% down · 7.5% · 30yr
- Down + closing
- —
- Monthly P&I
- —
- Monthly cashflow
- —
- DSCR
- —
- Eligible?
- —
Personal DTI + credit; lowest rate.
DSCR
20% down · 8.5% · 30yr
- Down + closing
- —
- Monthly P&I
- —
- Monthly cashflow
- —
- DSCR
- —
- Eligible?
- —
No personal income docs; deal must DSCR.
Hard money
10% down · 12.0% · 12mo
- Down + closing
- —
- Monthly P&I
- —
- Monthly cashflow
- —
- DSCR
- —
- Eligible?
- —
Short-term bridge; refi at stabilization.
Rent comps 21 comps
| Address | Beds | Baths | Sqft | Rent | $/sqft | DOM | Units | Dist |
|---|---|---|---|---|---|---|---|---|
| 686 Seward St Rochester, NY | 3.0 | 1.5 | 1166 | $1,600 | $1.37 | 44d | 1 | 0.20mi |
| 367 Hawley St Rochester, NY | 4.0 | 1.5 | 1210 | $1,395 | $1.15 | 44d | 1 | 0.46mi |
| 192 Bartlett St Unit 192 Rochester, NY | 3.0 | 1.0 | 1099 | $1,295 | $1.18 | 14d | 1 | 0.59mi |
| 193 Reynolds St Rochester, NY | 3.0 | 1.5 | 1342 | $1,800 | $1.34 | 21d | 1 | 0.69mi |
| 127 Congress Ave Rochester, NY | 3.0 | 1.0 | 1200 | $1,595 | $1.33 | 44d | 1 | 0.80mi |
| 59 Gold St Rochester, NY | 3.0 | 1.5 | 1264 | $2,000 | $1.58 | 44d | 1 | 0.87mi |
| 478 Tremont St Rochester, NY | 3.0 | 2.0 | 1424 | $1,500 | $1.05 | 44d | 1 | 0.90mi |
| 839 Elmwood Ave Rochester, NY | 3.0 | 1.0 | 1500 | $2,600 | $1.73 | 23d | 1 | 0.92mi |
| 30 Flanders St Rochester, NY | 3.0 | 1.5 | 1170 | $1,650 | $1.41 | 14d | 1 | 0.98mi |
| 485 Sawyer St Rochester, NY | 3.0 | 1.0 | 1400 | $1,900 | $1.36 | 3d | 1 | 0.98mi |
| 485 Sawyer St Unit 1 Rochester, NY | 3.0 | 1.0 | 1400 | $1,900 | $1.36 | 44d | 1 | 0.98mi |
| 190 Warwick Ave Rochester, NY | 3.0 | 1.5 | 1240 | $1,400 | $1.13 | 44d | 1 | 0.99mi |
| 102 Virginia Ave Rochester, NY | 4.0 | 1.5 | 1453 | $2,150 | $1.48 | 3d | 1 | 1.06mi |
| 444-450 Brooks Ave Unit 446 Rochester, NY | 4.0 | 2.0 | 1150 | $3,100 | $2.70 | 10d | 1 | 1.07mi |
| 132 Anthony St Rochester, NY | 3.0 | 1.0 | 1260 | $1,500 | $1.19 | 3d | 1 | 1.13mi |
| 175 Lattimore Rd Rochester, NY | 3.0 | 1.0 | 1480 | $2,265 | $1.53 | 14d | 1 | 1.15mi |
| 256 Gregory St Rochester, NY | 3.0 | 1.0 | 1150 | $1,700 | $1.48 | 44d | 1 | 1.20mi |
| 73 Somerset St Rochester, NY | 4.0 | 1.0 | 1000 | $1,750 | $1.75 | 44d | 1 | 1.31mi |
| 51 Elmerston Rd Rochester, NY | 3.0 | 2.0 | 1374 | $2,400 | $1.75 | 3d | 1 | 1.34mi |
| 54 Westmoreland Dr Rochester, NY | 4.0 | 1.0 | 1230 | $2,450 | $1.99 | 3d | 1 | 1.41mi |
| 416 Gregory St Unit Down Rochester, NY | 3.0 | 1.0 | 1374 | $1,995 | $1.45 | 23d | 1 | 1.43mi |
Listing history 5 events
-
2026-05-13$119,990 Active 907-char remark
-
2025-12-10historical
-
2025-12-05historical
-
2025-06-17$550,000 Active
-
2024-04-16soldstatus $310,000
ⓘ Source: listings_history table (triggers on properties + properties_extension) + one-shot
backfill from property_details.listing_events for pre-trigger history.
Tax reassessment forecast NY · Partial reset (capped growth)
- Current annual tax
- $915 · $76/mo
- Projected year-2 tax
- $1,471 · $123/mo
- Expected delta
- +$556/yr (+$46/mo · 60.8%)
ⓘ Screening estimate from a state-policy table — verify with the county assessor before closing.
Climate risk First Street
- Flood 1/10 Low FEMA zone X (unshaded) · 0% chance over 30 yrs
- Wildfire 2/10 Low
- Heat 2/10 Low 7 d/yr ≥96°F today · 14 d/yr by 30 yrs out
- Wind 1/10 Low
- Air quality 2/10 Low 1 unhealthy d/yr today · 1 by 30 yrs out
Nearby sold comps map
Loading sold comps map…
Walkable amenities ~0.75 mi
Loading nearby amenities…
Taxation est. · year 1
- Rental income
- $22,238
- − Mortgage interest
- −$6,721
- − Property taxes
- −$915
- − Insurance
- −$600
- − Repairs & maintenance
- −$1,779
- − Management
- −$1,779
- − Depreciation
- −$3,491
- Taxable income
- $6,953
- Est. tax owed @ 24.0%
- −$1,669
- After-tax cash flow
- $6,834/yr
For passive investors: Depreciation is non-cash, so a rental often shows a tax loss while cash-flowing — sheltering income. Rental losses are passive: they offset passive income freely, and up to $25,000/yr can offset ordinary (W-2) income if you actively participate and your MAGI is under $100k (phasing out to $0 by $150k); unused losses carry forward. On sale, claimed depreciation is recaptured at up to 25%, and gains may owe capital-gains tax (a 1031 exchange can defer both). Figures are a year-1 estimate at your 24.0% rate — not tax advice; consult a CPA.
Schools (NCES district)
- District
- Rochester City School District
- NCES district ID
- 3624750
- Math proficiency
- 21% ▬ 0.00%
- Reading proficiency
- 26% ▲ 4.00%
- Median HH income
- $30,923
- Composite
- 18.98/100
- National rank
- #8850
- State rank
- #589 of 590 in NY
Livability — Rochester
- Score
- 76/100
- State rank
- #222
- US rank
- #3482
Category grades
Schools grade is shown separately in the Schools card above.
Census & demographics
- Census place
- Rochester, NY
- County
- Monroe County · 674,131 people
- City population
- 432,803
- Metro
- Rochester, NY
- Population (ZIP)
- 12,792
- Household income
- $40,646
- Rent vs Own
- Severe rent burden
- 1300.0
Population outlook (Monroe County) Hauer SSP2
- Today (2025)
- 759,460 people
- By 2030
- 757,154 · -0.3%
- By 2040
- 740,644 · -2.5%
- By 2050
- 714,443 · -5.9%
- By 2075
- 645,883 · -15.0%
- By 2100
- 547,084 · -28.0%
Race, ethnicity, and origin ACS 2023
- Neighborhood character
- Diverse neighborhood (Simpson 0.67)
- Race & ethnicity
- Black 50% White 25% Two or more races 13% Hispanic / Latino 12% Asian 4%
- Hispanic origin (detail)
- Puerto Rican 10%
- Common ancestry
- Lithuanian 1% Romanian 1% Iranian 1%
- Foreign-born
- 8% · Canada, India
- Languages at home
- 85% English-only · Spanish 8% Other Indo-European 3% French/Haitian/Cajun 1%
Political lean MEDSL · Monroe
- 2024 margin
- D (+19.1) · D 59.5% · R 40.5%
- 2008→2024 swing
- +1.4pp toward D · 2008: 17.7pp · 2024: 19.1pp
- All cycles
- 2024: D+19.1 2020: D+21.0 2016: D+14.1 2012: D+17.4 2008: D+17.7
Not yet ingested
- Civics
- —
Market trends
- HPI YoY
- ▲ 3.69%
- Current HPI
- 280.2411
- Rent YoY
- ▲ 6.61%
- Metro
- Rochester, NY
- State GDP YoY
- ▲ 2.60%
- F500 in state
- 92
Industry mix (Fortune 500 HQ in NY)
| Industry | F500 HQs | Revenue |
|---|---|---|
| Financial Services | 10 | $950B |
|
||
| Consumer Goods | 9 | $162B |
|
||
| Insurance | 4 | $225B |
|
||
| Telecommunications | 2 | $144B |
|
||
| Pharmaceuticals | 2 | $112B |
|
||
| Media / Entertainment | 2 | $69B |
|
||
Price history
-61.3% since first listed6 events — show timeline
- 2026-05-29 Pending — UNYREIS
- 2026-05-13 Listed $119,990 UNYREIS
- 2025-12-10 Listing Removed — UNYREIS
- 2025-12-05 Listing Removed — UNYREIS
- 2025-06-17 Listed $550,000 UNYREIS
- 2024-04-16 Sold (Public Records) $310,000 Public Records
Property tax history
+2.3%/yrLatest (2025): $915 · +8.1% YoY. Source: county tax records.
Cash-flow waterfall
monthlySold comps — $/sqft
last 12 mo · ≤1 miLoading sold comps…