7775 England St · Overland Park, KS
Flood risk 1/10 · Minimal
- FEMA flood zone
- X (unshaded)
- Chance of flooding over 30 yrs
- 0.0%
- Est. flood insurance / yr
- $473 – $860
Fire risk 1/10 · Minimal
- Est. fire insurance / yr
- $1,154 – $2,142
Heat risk 4/10 · Minor
- Hot days now (above 106°F)
- 7 days/yr
- Hot days in 30 yrs
- 17 days/yr
Wind risk 2/10 · Minimal
- Chance of severe wind over 30 yrs
- —
Air-quality risk 2/10 · Minimal
- Unhealthy air days now
- 2 days/yr
- Unhealthy air days in 30 yrs
- 2 days/yr
Risk factors via First Street. Map © Google.
Why this score? — see what drove the D+ grade
The composite is a weighted blend of 9 inputs, each scored 0–100. Each bar is that input's sub-score; the figure is the points it added to the 100-point composite (weight × sub-score).
- Cash flow +14.2/30.0
- ARV discount +12.3/15.0
- DSCR +4.3/10.0
- Livability +4.0/5.0
- Schools +3.8/10.0
- 1% rule +3.5/10.0
- Condition / age +2.5/5.0
- Rent growth +1.8/5.0
- Appreciation +0.0/10.0
$199,900
🖨 Deal sheet (PDF) 📄 Offer letter ✓ Due diligence
Listing remarks MLS
NEWER CARPETING, KITCHEN CABINETS, COUNTERTOP, SINK & VINYL FLOORS. BATHROOMS UPDATED, 2 ADDITIONAL BDRM & FULL BATH IN BASEMENT & REC RM. ONLY NEED FLOORING TO BE COMPLETED. NEW VINYL WINDOWS UPSTAIRS. SELLER HAVING EXTERIOR PAINTED. STOVE & REFRIGERATOR DO NOT STAY!
Key facts
- Garage
- Built 1965
- Listed 23 days
Property features AI
Finance
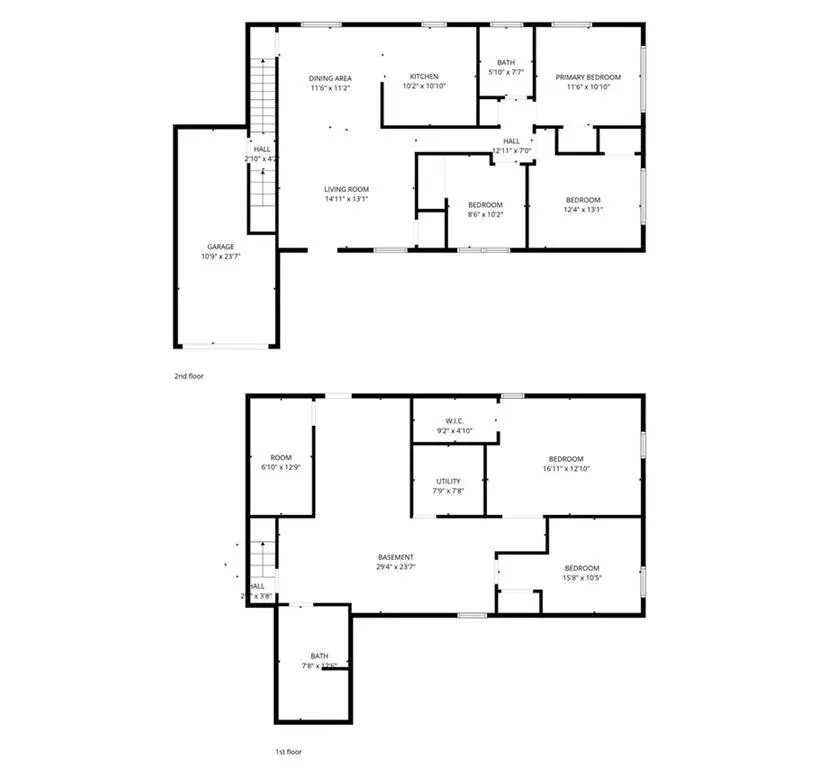
- Other: Living area approximately 1,355 total; Above-grade finished area reported as 908; Below-grade finished area reported as 447; Property listed as a fixer (needs repairs); Not in a flood plain
Exterior
- Parking: Attached garage that faces front (1-car)
- Security: Smoke detector(s)
- Utilities: Public water; Public sewer
- Home design: Half duplex (attached); Raised ranch floor plan; Residential property; Facing and entry level information not provided
- Construction: Brick trim and frame construction; Composition roof; Concrete foundation
- Exterior features: Deck; Patio; City lot; Fixer condition
Interior
- Kitchen: Dishwasher; Disposal; Refrigerator; Country-style kitchen
- Bedrooms: 3 bedrooms (includes a basement bedroom and a main-floor primary bedroom)
- Bathrooms: 2 full bathrooms
- Interior features: Ceiling fan(s); Storm windows; Finished basement with walk-out access; Basement bedroom; Recreation room; Formal living room; Main-floor primary bedroom; Country kitchen
- Laundry & utility: Washer and dryer; Laundry located in basement
Neighborhood map
What this means for you Summary
Snapshot
- This is a 3-bed/2.0-bath townhouse listed at $200k.
Deal economics
- At list price, monthly cash flow is $33 ($391/yr) — positive.
- The deal already cash-flows at list — no discount required.
- To meet the 1% rule (rent ≥ 1% of price), the offer needs to be $170k (14.9% below list).
- Recommended offer: $170k (14.9% below list) — sets the bar for 1% rule.
- Cap rate 6.5% vs local median 3.9% in Overland Park — top-decile yield for the area; either an underpriced asset or a hidden risk that comps aren't pricing in. Stress-test before assuming the spread holds.
Location & tenants
- Location reads 80/100 on livability (#16 in KS, #1,851 nationally) — a professional / high-income tenant draw. Strengths: employment A+, housing A+, crime B; Watch: health & safety C-, commute D+.
- Shawnee Mission Pub Schools (suburban): math 38% / reading 46% proficiency, ranked #22 of 169 in KS (top 13%) — families likely to look elsewhere, expect single-tenant / working-renter base with shorter leases.
- Zoned schools: Comanche Elem (math 22% / reading 37%, grade F, #463 of 684 statewide, top 73%, 381 students, 79% FRL); Westridge Middle (math 15% / reading 23%, grade F, #159 of 219 statewide, top 73%, 811 students, 58% FRL) — zoned schools average 69% FRL vs 29% district-wide (40 pts higher); higher-poverty schools than district average — tighter screening recommended.
- Zoned-school proficiency averages 24% at this address vs 42% district-wide (-18 pts) — the specific schools serving this property underperform the Shawnee Mission Pub Schools average; the district grade overstates school quality for this exact location.
- Market conditions: Rents soft (-2.9%/yr); 33 active listings in the ZIP; 37 comparable units currently listed for rent nearby; rentals leasing fast (median 12d on market — plan ~1-2 weeks tenant-placement turnaround); solid renter incomes; 2,969 units permitted in Johnson County in 2024 (1,066 in 5+ unit buildings).
Forward outlook
- Local home prices are declining (-3.0%/yr); year-one equity from $1k of loan paydown is wiped out by about $6k of value loss. Plan a longer hold.
- Johnson County population projected at +27% by 2050 — long-run rental-demand tailwind backs the buy-and-hold thesis.
Negotiation context
- It's been on market 23 days — a 2% lower offer ($197k) is reasonable based on typical stale-listing flexibility.
Questions for the listing agent
- Built in 1965 — when were the roof, HVAC, electrical panel, plumbing, and water heater last replaced?
- Is there a deadline driving the sale (1031 exchange, divorce, estate, relocation)? That informs how much negotiation room exists.
- Schools are B-rated — typically a magnet for longer-tenancy family renters. What's the average tenant stay here, and is there a school-zone premium baked into asking?
- The area grade is low — what's the realistic commute time and amenity access for the typical tenant pool here? Any planned neighborhood developments (good or bad) we should know about?
- What's the average days-on-market for RENTAL listings here right now (not sales)? A rising rental-DOM trend means longer vacancies and softer asking-rent achievability than the comps imply.
- What's the recent tenant-quality profile in this submarket — average credit score on applications, eviction rate, late-payment / NSF rate, and stable-employment percentage? A property-management company in the area should have these aggregated.
- How much new for-sale + rental construction is in the pipeline within 1–3 miles? Heavy new supply typically softens prices + rents 12–24 months out; constrained supply supports both.
Investment metrics
- 1% rule
- 0.85% ✗
- Cap rate
- 6.49%
- Cash-on-cash
- 0.70%
- DSCR
- 1.03
- GRM
- 9.8
CMA / ARV
- ARV (on-the-fly)
- $223,575
- Comps found
- 5
Show comp detail 5 sales within ~0.75 mi
| Address | Dist | Beds/Ba | Sqft | Sold | Price | $/sf | Match |
|---|---|---|---|---|---|---|---|
| 7728 Kessler Ln | 0.05mi | 2/1.5 (-1) | 1,452 (+7%) | 1mo | $310,000 | $213 | 78 |
| 7743 England Dr | 0.06mi | 2/2.5 (-1) | 1,467 (+8%) | 9mo | $242,500 | $165 | 69 |
| 7235 Mastin St | 0.73mi | 2/2.0 (-1) | 1,232 (-9%) | 13mo | $290,000 | $235 | 35 |
| 8221 Grant St | 0.62mi | 3/2.0 | 1,539 (+14%) | 23mo | $250,000 | $162 | 29 |
| 9406 W 83rd St | 0.64mi | 3/2.0 | 1,540 (+14%) | 22mo | $250,000 | $162 | 29 |
Match score weights: distance 35% · size 25% · config 20% · recency 20%. Top-matched comps best support the ARV.
Projected returns pro-forma
-3.0% appreciation · 0.0% rent growth · sell at horizon
- IRR
- -18.5%
- Equity multiple
- 0.37×
- Total profit
- $-35,321
- Equity at exit
- $29,806
- IRR
- -17.8%
- Equity multiple
- 0.15×
- Total profit
- $-47,421
- Equity at exit
- $17,284
Cash invested: $55,972 (down + closing). Projections, not guarantees.
Landlord ↔ Tenant lean methodology
- Overall (STATE)
- 83 Strongly Landlord-Friendly
- State Kansas
- 83 Strongly Landlord-Friendly · R+10
- County
- — inherits STATE
- City
- — inherits STATE
ZIP-level market 66214
- Rents YoY
- -2.9%
- Active inventory
- 33
- Price-to-rent
- 9.8×
Monthly cashflow live
- Estimated rent
- $1,701 high interval (Pro) →
- Mortgage (P&I)
- −$1,048
- Tax from tax record
- −$179 /mo · $2,153/yr
- Insurance
- −$83
- HOA
- −$0
- Vacancy / Maint / Mgmt
- −$357
- Net cashflow
- $33
Break-even live
Sensitivity live
| Price | -10% $146 | -5% $89 | +0% $33 | +5% $-24 | +10% $-81 |
|---|---|---|---|---|---|
| Rent | -10% $-102 | -5% $-35 | +0% $33 | +5% $100 | +10% $167 |
| Rate | -1.0pp $133 | -0.5pp $83 | base $33 | +0.5pp $-19 | +1.0pp $-72 |
UW: 25.0% down · 7.5% · 30yr · 1.5% tax · 5.0% vac · 8.0% maint · 8.0% mgmt
Financing live
Cash to close
- Down payment
- $49,975
- Closing costs
- $5,997
- Reserves months
- —
- Total cash needed
- —
Loan-product check · same deal, 3 products live
Conventional
25% down · 7.5% · 30yr
- Down + closing
- —
- Monthly P&I
- —
- Monthly cashflow
- —
- DSCR
- —
- Eligible?
- —
Personal DTI + credit; lowest rate.
DSCR
20% down · 8.5% · 30yr
- Down + closing
- —
- Monthly P&I
- —
- Monthly cashflow
- —
- DSCR
- —
- Eligible?
- —
No personal income docs; deal must DSCR.
Hard money
10% down · 12.0% · 12mo
- Down + closing
- —
- Monthly P&I
- —
- Monthly cashflow
- —
- DSCR
- —
- Eligible?
- —
Short-term bridge; refi at stabilization.
Rent comps 37 comps
| Address | Beds | Baths | Sqft | Rent | $/sqft | DOM | Units | Dist |
|---|---|---|---|---|---|---|---|---|
| 9130 W 78th St Overland Park, KS | 3.0 | 2.0 | 1527 | $1,745 | $1.14 | 19d | 1 | 0.12mi |
| 9128 W 78th St Overland Park, KS | 3.0 | 2.0 | 1527 | $1,745 | $1.14 | 14d | 1 | 0.13mi |
| 9213 W 79th St Overland Park, KS | 1.0–2.0 | 1.0–2.0 | 906 | $1,295 | $1.43 | 3d | 11 | 0.17mi |
| 7819 Carter St Overland Park, KS | 1.0–2.0 | 1.0–1.5 | 850 | $1,175 | $1.38 | 25d | 1 | 0.19mi |
| 9526 W 78th St Overland Park, KS | 2.0 | 2.0 | 1145 | $1,800 | $1.57 | 21d | 1 | 0.19mi |
| 7903 Grandview St Overland Park, KS | 2.0 | 1.0 | 972 | $1,295 | $1.33 | 25d | 1 | 0.24mi |
| 9400 W 81st St Overland Park, KS | 2.0 | 1.0 | 1050 | $1,345 | $1.28 | 13d | 1 | 0.36mi |
| 9010 W 82nd St Overland Park, KS | 3.0 | 1.0 | 1360 | $2,179 | $1.60 | 6d | 1 | 0.48mi |
| 8000 Perry St Overland Park, KS | 1.0–3.0 | 1.0–2.0 | 998 | $1,685 | $1.69 | 3d | 11 | 0.54mi |
| 8100 Perry St Overland Park, KS | 1.0–3.0 | 1.0–2.0 | 991 | $1,850 | $1.87 | 9d | 10 | 0.62mi |
| 7350 Kings Cove Dr Merriam, KS | 2.0 | 1.0–2.0 | 746 | $1,449 | $1.94 | 25d | 1 | 0.65mi |
| 7650 Goddard St Shawnee, KS | 2.0 | 1.0–2.5 | 1225 | $1,925 | $1.57 | 16d | 1 | 0.78mi |
| 8403 Carter St Overland Park, KS | 2.0–3.0 | 1.0–2.0 | 1732 | $4,750 | $2.74 | 12d | 1 | 0.84mi |
| 7200 Eby Ave Unit 26205 Overland Park, KS | 2.0 | 2.0 | 1078 | $1,560 | $1.45 | 16d | 1 | 0.87mi |
| 7200 Eby Ave Unit 13304 Overland Park, KS | 2.0 | 2.0 | 1128 | $1,555 | $1.38 | 25d | 1 | 0.87mi |
| 8909 W 71st St Overland Park, KS | 3.0 | 2.5 | 1118 | $1,895 | $1.69 | 9d | 1 | 0.88mi |
| 8342 Wedd St Overland Park, KS | 1.0–3.0 | 1.0–2.0 | 1223 | $1,455 | $1.19 | 25d | 1 | 0.88mi |
| 7106 Mastin St Unit 1 Shawnee, KS | 3.0 | 3.5 | 1700 | $2,300 | $1.35 | 6d | 1 | 0.90mi |
| 9551 W 85th St Overland Park, KS | 1.0–3.0 | 1.0–2.5 | 1026 | $1,225 | $1.19 | 14d | 2 | 0.95mi |
| 7512 Newton St Overland Park, KS | 3.0 | 2.0 | 1295 | $2,095 | $1.62 | 25d | 1 | 1.07mi |
| 10405 W 70th Ter Shawnee, KS | 1.0–2.0 | 1.0–2.0 | 830 | $1,540 | $1.86 | 25d | 1 | 1.09mi |
| 9634 W 87th St Overland Park, KS | 2.0 | 2.5 | 1100 | $1,475 | $1.34 | 9d | 4 | 1.12mi |
| 7801 W 83rd St Overland Park, KS | 1.0–2.0 | 1.0–2.0 | 875 | $1,450 | $1.66 | 9d | 3 | 1.15mi |
| 8300 Robinson St Apt 2 Overland Park, KS | 2.0 | 2.0 | 950 | $1,450 | $1.53 | 25d | 1 | 1.18mi |
| 8325 Lowell Ave Unit 6 Overland Park, KS | 2.0 | 1.0 | 900 | $1,195 | $1.33 | 9d | 1 | 1.20mi |
| 7843 Riley St Overland Park, KS | 1.0–2.0 | 1.0 | 726 | $1,934 | $2.66 | 3d | 49 | 1.24mi |
| 8640 Hadley St Overland Park, KS | 3.0 | 2.0 | 1100 | $1,925 | $1.75 | 23d | 1 | 1.24mi |
| 9301 Santa Fe Ln Overland Park, KS | 1.0–2.0 | 1.0–2.0 | 982 | $3,642 | $3.71 | 12d | 1 | 1.28mi |
| 7613 Flint St Overland Park, KS | 1.0–3.0 | 1.0–2.0 | 1000 | $1,750 | $1.75 | 12d | 13 | 1.33mi |
| 7613 Flint St Overland Park, KS | 1.0–3.0 | 1.0–2.0 | 1000 | $1,730 | $1.73 | 3d | 16 | 1.33mi |
| 8441 Robinson St Overland Park, KS | 2.0 | 1.5 | 950 | $1,290 | $1.36 | 3d | 1 | 1.33mi |
| 7201 W 80th St Overland Park, KS | 1.0–2.0 | 1.0–2.0 | 869 | $2,646 | $3.04 | 4d | 4 | 1.36mi |
| 8241 Riley St Overland Park, KS | 2.0 | 2.0 | 1128 | $2,200 | $1.95 | 5d | 1 | 1.38mi |
| 7109 Conser St Overland Park, KS | 4.0 | 2.0 | 1706 | $2,600 | $1.52 | 9d | 1 | 1.39mi |
| 7420 Flint St Shawnee, KS | 1.0–2.0 | 1.0–2.0 | 917 | $1,399 | $1.53 | 3d | 16 | 1.42mi |
| 7122 King St Shawnee, KS | 2.0 | 1.5 | 1300 | $1,695 | $1.30 | 25d | 1 | 1.45mi |
| 11501 W 81st St Overland Park, KS | 2.0 | 1.0–2.0 | 901 | $2,971 | $3.30 | 3d | 10 | 1.47mi |
Listing history 20 events
-
2026-06-21days on market $199,900 Active 23 DOM
-
2026-06-18days on market $199,900 Active 20 DOM
-
2026-06-17days on market $199,900 Active 19 DOM
-
2026-06-16days on market $199,900 Active 18 DOM
-
2026-06-15days on market $199,900 Active 17 DOM
-
2026-06-13days on market $199,900 Active 15 DOM
-
2026-06-13days on market $199,900 Active 14 DOM
-
2026-06-09days on market $199,900 Active 11 DOM
-
2026-06-08remarks 502-char remark
-
2026-06-08pricedays on market $199,900 Active 10 DOM
-
2026-06-07days on market $210,000 Active 9 DOM
-
2026-06-05days on market $210,000 Active 6 DOM
-
2026-06-03days on market $210,000 Active 5 DOM
-
2026-06-02days on market $210,000 Active 4 DOM
-
2026-06-01days on market $210,000 Active 3 DOM
-
2026-05-31days on market $210,000 Active 2 DOM
-
2026-05-28historical $210,000
-
2003-09-03soldstatus 292-char remark
Show marketing remark (292 chars)
NEWER CARPETING, KITCHEN CABINETS, COUNTERTOP, SINK & VINYL FLOORS. BATHROOMS UPDATED, 2 ADDITIONAL BDRM & FULL BATH IN BASEMENT & REC RM. ONLY NEED FLOORING TO BE COMPLETED. NEW VINYL WINDOWS UPSTAIRS. SELLER HAVING EXTERIOR PAINTED. STOVE & REFRIGERATOR DO NOT STAY!
-
2003-09-02soldstatus
-
2003-07-01$112,950 292-char remark
Show marketing remark (292 chars)
NEWER CARPETING, KITCHEN CABINETS, COUNTERTOP, SINK & VINYL FLOORS. BATHROOMS UPDATED, 2 ADDITIONAL BDRM & FULL BATH IN BASEMENT & REC RM. ONLY NEED FLOORING TO BE COMPLETED. NEW VINYL WINDOWS UPSTAIRS. SELLER HAVING EXTERIOR PAINTED. STOVE & REFRIGERATOR DO NOT STAY!
ⓘ Source: listings_history table (triggers on properties + properties_extension) + one-shot
backfill from property_details.listing_events for pre-trigger history.
Tax reassessment forecast KS · Resets to sale price
- Current annual tax
- $2,153 · $179/mo
- Projected year-2 tax
- $2,819 · $235/mo
- Expected delta
- +$666/yr (+$55/mo · 30.9%)
ⓘ Screening estimate from a state-policy table — verify with the county assessor before closing.
Climate risk First Street
- Flood 1/10 Low FEMA zone X (unshaded) · 0% chance over 30 yrs
- Wildfire 1/10 Low
- Heat 4/10 Moderate 7 d/yr ≥106°F today · 17 d/yr by 30 yrs out
- Wind 2/10 Low
- Air quality 2/10 Low 2 unhealthy d/yr today · 2 by 30 yrs out
Nearby sold comps map
Loading sold comps map…
Walkable amenities ~0.75 mi
Loading nearby amenities…
Taxation est. · year 1
- Rental income
- $20,408
- − Mortgage interest
- −$11,198
- − Property taxes
- −$2,153
- − Insurance
- −$1,000
- − Repairs & maintenance
- −$1,633
- − Management
- −$1,633
- − Depreciation
- −$5,815
- Taxable loss
- −$3,022
- Est. tax savings @ 24.0%
- +$725
- After-tax cash flow
- $1,116/yr
For passive investors: Depreciation is non-cash, so a rental often shows a tax loss while cash-flowing — sheltering income. Rental losses are passive: they offset passive income freely, and up to $25,000/yr can offset ordinary (W-2) income if you actively participate and your MAGI is under $100k (phasing out to $0 by $150k); unused losses carry forward. On sale, claimed depreciation is recaptured at up to 25%, and gains may owe capital-gains tax (a 1031 exchange can defer both). Figures are a year-1 estimate at your 24.0% rate — not tax advice; consult a CPA.
Schools (NCES district)
- District
- Shawnee Mission Pub Schools
- NCES district ID
- 2011640
- Math proficiency
- 38% ▼ -6.00%
- Reading proficiency
- 46% ▼ -2.00%
- Median HH income
- $64,923
- Composite
- 37.55/100
- National rank
- #4391
- State rank
- #22 of 169 in KS
Livability — Overland Park
- Score
- 80/100
- State rank
- #16
- US rank
- #1851
Category grades
Schools grade is shown separately in the Schools card above.
Census & demographics
- Census place
- Overland Park, KS
- County
- Johnson County · 574,662 people
- City population
- 180,138
- Metro
- Kansas City, MO-KS
- Population (ZIP)
- 12,351
- Household income
- $83,435
- Rent vs Own
- Severe rent burden
- 388.0
Population outlook (Johnson County) Hauer SSP2
- Today (2025)
- 663,396 people
- By 2030
- 702,585 · +5.9%
- By 2040
- 775,386 · +16.9%
- By 2050
- 841,772 · +26.9%
- By 2075
- 994,137 · +49.9%
- By 2100
- 1,073,036 · +61.7%
Race, ethnicity, and origin ACS 2023
- Neighborhood character
- Diverse neighborhood (Simpson 0.61)
- Race & ethnicity
- White 57% Black 17% Hispanic / Latino 17% Two or more races 10% Asian 3% Native American 2%
- Hispanic origin (detail)
- Mexican 12%
- Common ancestry
- Italian 4% Slovak 3% Lithuanian 2%
- Foreign-born
- 15% · Canada, China, Jamaica
- Languages at home
- 81% English-only · Spanish 10% Other Indo-European 1% Arabic 1%
Political lean MEDSL · Johnson
- 2024 margin
- Lean D (+8.5) · D 53.4% · R 44.9% · Other 1.8%
- 2008→2024 swing
- +17.5pp toward D · 2008: -9.0pp · 2024: 8.5pp
- All cycles
- 2024: D+8.5 2020: D+8.2 2016: R+2.7 2012: R+17.8 2008: R+9.0
Not yet ingested
- Civics
- —
Market trends
- HPI YoY
- ▼ -239.56%
- Current HPI
- 257.7275
- Rent YoY
- ▼ -2.89%
- Metro
- Kansas City, MO-KS
- State GDP YoY
- —
- F500 in state
- 0
Price history
+85.9% since first listed4 events — show timeline
- 2026-05-28 Coming Soon $210,000 Heartland MLS as Distributed by MLS Grid
- 2003-09-03 Sold (MLS) — Heartland MLS as Distributed by MLS Grid
- 2003-09-02 Sold (Public Records) — Public Records
- 2003-07-01 Listed $112,950 Heartland MLS as Distributed by MLS Grid
Property tax history
+4.1%/yrLatest (2025): $2,153 · +3.0% YoY. Source: county tax records.
Cash-flow waterfall
monthlySold comps — $/sqft
last 12 mo · ≤1 miLoading sold comps…