673 Sparano Loop · York, SC
Flood risk 5/10 · Moderate
- FEMA flood zone
- X (unshaded)
- Chance of flooding over 30 yrs
- 0.24%
- Est. flood insurance / yr
- $507 – $1,088
Fire risk 3/10 · Minor
- Est. fire insurance / yr
- $783 – $1,453
Heat risk 5/10 · Moderate
- Hot days now (above 105°F)
- 7 days/yr
- Hot days in 30 yrs
- 15 days/yr
Wind risk 5/10 · Moderate
- Chance of severe wind over 30 yrs
- 24.0%
Air-quality risk 3/10 · Minor
- Unhealthy air days now
- 3 days/yr
- Unhealthy air days in 30 yrs
- 3 days/yr
Risk factors via First Street. Map © Google.
Why this score? — see what drove the F grade
The composite is a weighted blend of 9 inputs, each scored 0–100. Each bar is that input's sub-score; the figure is the points it added to the 100-point composite (weight × sub-score).
- Cash flow +11.6/30.0
- Condition / age +4.8/5.0
- 1% rule +4.7/10.0
- DSCR +3.4/10.0
- Livability +3.2/5.0
- Schools +3.0/10.0
- Rent growth +2.5/5.0
- ARV discount +0.7/15.0
- Appreciation +0.0/10.0
$272,899
🖨 Deal sheet 📄 Offer letter ✓ Due diligence
Listing remarks
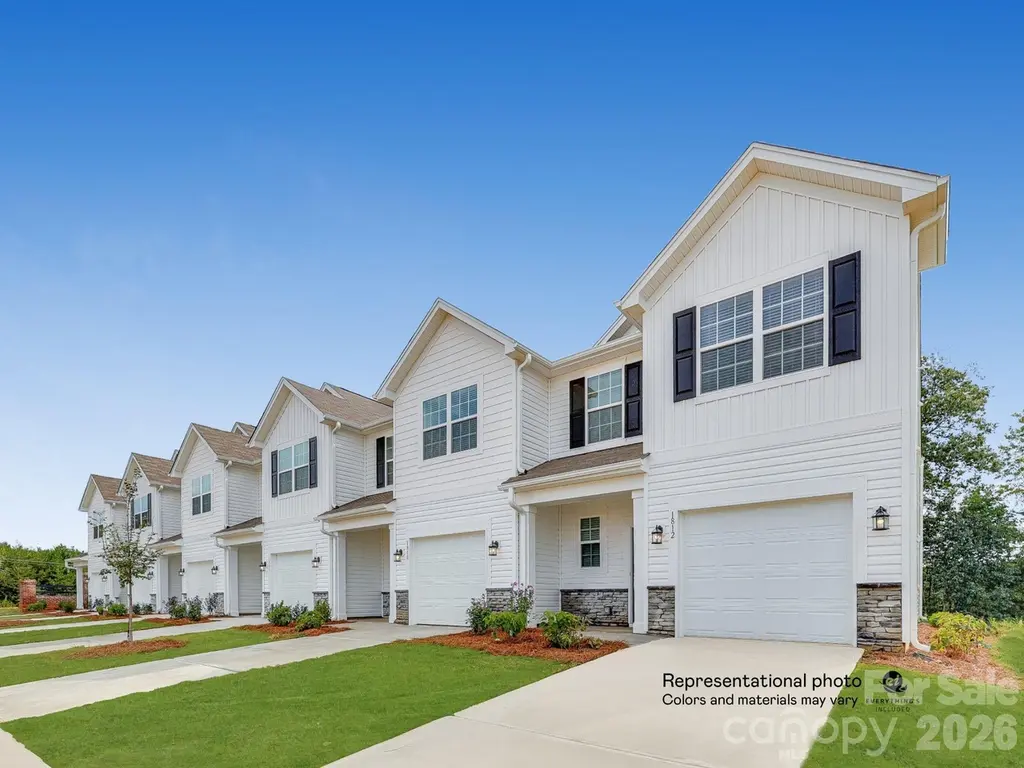
Past the foyer of this new two-story townhome end unit is a convenient, open-plan layout shared among the main living spaces. Showcasing a fully equipped kitchen, a family room made for gatherings and an intimate breakfast nook, while nearby is a patio for outdoor moments. Ideally upstairs are all three bedrooms to provide excellent sleeping accommodations, including the serene primary suite with a private bathroom. Plus, our signature Everything's Included program means you will get quartz or granite kitchen countertops, subway tile backsplash, ceramic tile, and luxury vinyl plank flooring on the first floor at no extra cost! Cannon Village is a master-planned community offering new single
Key facts
- $290 HOA
- Garage
- Community pool
Neighborhood map
What this means for you Summary
Snapshot
- This is a 3-bed/2.5-bath townhouse listed at $273k. Condition is rated excellent.
Deal economics
- At list price, monthly cash flow is $-86 ($-1k/yr) — negative.
- To cash-flow at today's rent, offer at most $260k (4.6% below list).
- To meet the 1% rule (rent ≥ 1% of price), the offer needs to be $265k (3.1% below list).
- Recommended offer: $260k (4.6% below list) — sets the bar for cash-flow.
- Cap rate 5.9% vs local median 4.6% in York — meaningfully above typical; check what's discounted (condition, days-on-market, listing class) to confirm the premium yield is real.
Location & tenants
- Location reads 65/100 on livability (#139 in SC) — a middle-class / working-renter tenant base. Strengths: cost of living A+, housing A+, health & safety A+; Watch: crime F, amenities F, commute F.
- York 01 (rural): math 31% / reading 40% proficiency, ranked #41 of 80 in SC (top 51%) — families likely to look elsewhere, expect single-tenant / working-renter base with shorter leases.
- Zoned schools: Hunter Street Elementary (math 52% / reading 47%, grade D, #168 of 597 statewide, top 31%, 405 students, 74% FRL); York Comprehensive High (math 39% / reading 82%, grade C+, #108 of 196 statewide, top 55%, 1,493 students, 68% FRL) — zoned schools average 71% FRL vs 54% district-wide (17 pts higher); higher-poverty schools than district average — tighter screening recommended.
- Zoned-school proficiency averages 55% at this address vs 36% district-wide (+20 pts) — the actual schools serving this property are materially stronger than the York 01 average implies; a family-tenant draw the district grade alone would hide.
- Market conditions: 541 active listings in the ZIP; 2 comparable units currently listed for rent nearby; solid renter incomes; 2,550 units permitted in York County in 2024 (350 in 5+ unit buildings).
- This rent runs 40% of the median local income ($79k/yr) — at the standard rent-burdened threshold; future hikes will face affordability resistance.
Forward outlook
- Local home prices are declining (-3.0%/yr); year-one equity from $2k of loan paydown is wiped out by about $8k of value loss. Plan a longer hold.
- York County population projected at +44% by 2050 — long-run rental-demand tailwind backs the buy-and-hold thesis.
Negotiation context
- It's been on market 22 days — a 2% lower offer ($269k) is reasonable based on typical stale-listing flexibility.
Risks & watch-outs
- Climate carrying-cost: moderate flood risk; moderate wind risk, 24% chance of damaging wind over 30y; extreme-heat days projected 7→15/yr by 2055 (HVAC capex compounding) — expect insurance premiums to compound above CPI over the hold.
Questions for the listing agent
- What do current leases actually rent for vs. the listed asking? Can we see a recent rent roll and the last 12 months of T-12 income?
- What does the HOA fee cover, when was the last increase, and are there any pending special assessments or reserve-fund shortfalls?
- Is there a deadline driving the sale (1031 exchange, divorce, estate, relocation)? That informs how much negotiation room exists.
- Schools are D-rated, which usually means shorter tenancies and higher turnover. Who's the typical renter profile here, and what's been the actual vacancy rate?
- Crime grade is F in this area — have there been break-ins, vandalism, or insurance claims at this property in the last 3 years? What carrier currently insures it and at what premium?
- The area grade is low — what's the realistic commute time and amenity access for the typical tenant pool here? Any planned neighborhood developments (good or bad) we should know about?
- What's the average days-on-market for RENTAL listings here right now (not sales)? A rising rental-DOM trend means longer vacancies and softer asking-rent achievability than the comps imply.
- What's the recent tenant-quality profile in this submarket — average credit score on applications, eviction rate, late-payment / NSF rate, and stable-employment percentage? A property-management company in the area should have these aggregated.
- How much new for-sale + rental construction is in the pipeline within 1–3 miles? Heavy new supply typically softens prices + rents 12–24 months out; constrained supply supports both.
Investment metrics
- 1% rule
- 0.97% ✗
- Cap rate
- 5.91%
- Cash-on-cash
- -1.35%
- DSCR
- 0.94
- GRM
- 8.6
CMA / ARV
- ARV (on-the-fly)
- $236,951
- Comps found
- 10
Show comp detail 10 sales within ~0.75 mi
| Address | Dist | Beds/Ba | Sqft | Sold | Price | $/sf | Match |
|---|---|---|---|---|---|---|---|
| 639 Sparano Loop | 0.00mi | 3/2.5 | 1,657 (0%) | 1mo | $243,132 | $147 | 99 |
| 647 Sparano Loop | 0.15mi | 3/2.5 | 1,657 (0%) | 1mo | $237,649 | $143 | 92 |
| 643 Sparano Loop | 0.15mi | 3/2.5 | 1,661 (+0%) | 1mo | $235,000 | $141 | 92 |
| 621 Sparano Loop | 0.16mi | 3/2.5 | 1,657 (0%) | 1mo | $225,849 | $136 | 92 |
| 625 Sparano Loop | 0.17mi | 3/2.5 | 1,661 (+0%) | 1mo | $245,000 | $148 | 91 |
| 613 Sparano Loop | 0.19mi | 3/2.5 | 1,657 (0%) | 1mo | $225,849 | $136 | 90 |
| 620 Sparano Loop | 0.18mi | 3/2.5 | 1,680 (+1%) | 1mo | $224,999 | $134 | 88 |
| 612 Sparano Loop | 0.19mi | 3/2.5 | 1,680 (+1%) | 1mo | $236,599 | $141 | 88 |
| 609 Sparano Loop | 0.22mi | 3/2.5 | 1,661 (+0%) | 1mo | $256,000 | $154 | 88 |
| 624 Sparano Loop | 0.18mi | 3/2.5 | 1,691 (+2%) | 1mo | $267,429 | $158 | 87 |
Match score weights: distance 35% · size 25% · config 20% · recency 20%. Top-matched comps best support the ARV.
Projected returns pro-forma
-3.0% appreciation · 3.0% rent growth · sell at horizon
- IRR
- -18.4%
- Equity multiple
- 0.35×
- Total profit
- $-49,486
- Equity at exit
- $40,690
- IRR
- -10.6%
- Equity multiple
- 0.36×
- Total profit
- $-49,264
- Equity at exit
- $23,595
Cash invested: $76,412 (down + closing). Projections, not guarantees.
Landlord ↔ Tenant lean methodology
- Overall (STATE)
- 90 Strongly Landlord-Friendly
- State South Carolina
- 90 Strongly Landlord-Friendly · R+6
- County
- — inherits STATE
- City
- — inherits STATE
ZIP-level market 29745
- Home prices YoY
- -30.3%
- Active inventory
- 541
- Price-to-rent
- 8.6×
Monthly cashflow live
- Estimated rent
- $2,645 medium interval (Pro) →
- Mortgage (P&I)
- −$1,431
- Tax est. 1.5%
- −$341 /mo · $4,093/yr
- Insurance
- −$114
- HOA
- −$290
- Vacancy / Maint / Mgmt
- −$556
- Net cashflow
- $-86
Break-even live
UW: 25.0% down · 7.5% · 30yr · 1.5% tax · 5.0% vac · 8.0% maint · 8.0% mgmt
Financing live
Cash to close
- Down payment
- $68,225
- Closing costs
- $8,187
- Reserves months
- —
- Total cash needed
- —
Loan-product check · same deal, 3 products live
Conventional
25% down · 7.5% · 30yr
- Down + closing
- —
- Monthly P&I
- —
- Monthly cashflow
- —
- DSCR
- —
- Eligible?
- —
Personal DTI + credit; lowest rate.
DSCR
20% down · 8.5% · 30yr
- Down + closing
- —
- Monthly P&I
- —
- Monthly cashflow
- —
- DSCR
- —
- Eligible?
- —
No personal income docs; deal must DSCR.
Hard money
10% down · 12.0% · 12mo
- Down + closing
- —
- Monthly P&I
- —
- Monthly cashflow
- —
- DSCR
- —
- Eligible?
- —
Short-term bridge; refi at stabilization.
Rent comps 2 comps
| Address | Beds | Baths | Sqft | Rent | $/sqft | DOM | Units | Dist |
|---|---|---|---|---|---|---|---|---|
| 515 Trading Post Ln York, SC | 3.0 | 2.5 | 1429 | $2,300 | $1.61 | 23d | 1 | 0.89mi |
| 495 Switch St York, SC | 3.0 | 2.5 | 1928 | $2,500 | $1.30 | 3d | 1 | 0.94mi |
HOA detail
- Monthly dues
- $290 · $3,480/yr
Listing history 15 events
-
2026-06-18days on market $272,899 Active 22 DOM
-
2026-06-17days on market $272,899 Active 21 DOM
-
2026-06-16days on market $272,899 Active 20 DOM
-
2026-06-15days on market $272,899 Active 19 DOM
-
2026-06-13days on market $272,899 Active 17 DOM
-
2026-06-09days on market $272,899 Active 13 DOM
-
2026-06-08days on market $272,899 Active 12 DOM
-
2026-06-07days on market $272,899 Active 11 DOM
-
2026-06-04days on market $272,899 Active 8 DOM
-
2026-06-03days on market $272,899 Active 7 DOM
-
2026-06-02days on market $272,899 Active 6 DOM
-
2026-06-01days on market $272,899 Active 5 DOM
-
2026-05-31days on market $272,899 Active 4 DOM
-
2026-04-05status Pending
-
2026-04-05$272,899 Active
ⓘ Source: listings_history table (triggers on properties + properties_extension) + one-shot
backfill from property_details.listing_events for pre-trigger history.
Climate risk First Street
- Flood 5/10 Major FEMA zone X (unshaded) · 24% chance over 30 yrs
- Wildfire 3/10 Moderate
- Heat 5/10 Major 7 d/yr ≥105°F today · 15 d/yr by 30 yrs out
- Wind 5/10 Major 24% chance of damaging wind over 30 yrs
- Air quality 3/10 Moderate 3 unhealthy d/yr today · 3 by 30 yrs out
Nearby sold comps map
Loading sold comps map…
Walkable amenities ~0.75 mi
Loading nearby amenities…
Taxation est. · year 1
- Rental income
- $31,745
- − Mortgage interest
- −$15,287
- − Property taxes
- −$4,093
- − Insurance
- −$1,364
- − Repairs & maintenance
- −$2,540
- − Management
- −$2,540
- − HOA
- −$3,480
- − Depreciation
- −$7,939
- Taxable loss
- −$5,498
- Est. tax savings @ 24.0%
- +$1,319
- After-tax cash flow
- $287/yr
For passive investors: Depreciation is non-cash, so a rental often shows a tax loss while cash-flowing — sheltering income. Rental losses are passive: they offset passive income freely, and up to $25,000/yr can offset ordinary (W-2) income if you actively participate and your MAGI is under $100k (phasing out to $0 by $150k); unused losses carry forward. On sale, claimed depreciation is recaptured at up to 25%, and gains may owe capital-gains tax (a 1031 exchange can defer both). Figures are a year-1 estimate at your 24.0% rate — not tax advice; consult a CPA.
Condition & rehab AI · 1 photo
This move-in-ready townhome in Cannon Village is in excellent condition with modern finishes and a well-maintained exterior. Minor updates to the exterior and landscaping would further enhance its value.
Value-add opportunities
- Both Painting exterior and interior walls — Enhances curb appeal and interior aesthetics.
- Both Landscaping improvements — Enhances curb appeal and adds value.
- Both Add smart home features — Improves convenience and adds modern appeal.
- Both Install smart thermostat — Saves on energy costs and adds modern appeal.
Renovation cost estimate screening
Value-add ROI direction
- Both Painting exterior and interior walls — Enhances curb appeal and interior aesthetics. ↑
- Both Landscaping improvements — Enhances curb appeal and adds value. ↑
- Both Add smart home features — Improves convenience and adds modern appeal. ↑
- Both Install smart thermostat — Saves on energy costs and adds modern appeal. ↑
ⓘ Cost ranges are severity-bucket heuristics (US national rule-of-thumb). Get contractor quotes + a written scope before underwriting a rehab budget.
Schools (NCES district)
- District
- York 01
- NCES district ID
- 4503810
- Math proficiency
- 31% ▼ -16.00%
- Reading proficiency
- 40% ▬ 0.00%
- Median HH income
- $44,491
- Composite
- 30.21/100
- National rank
- #6305
- State rank
- #41 of 80 in SC
Livability — York
- Score
- 65/100
- State rank
- #139
- US rank
- #13425
Category grades
Schools grade is shown separately in the Schools card above.
Census & demographics
- Census place
- York, SC
- County
- York County · 281,758 people
- City population
- 34,909
- Metro
- Charlotte-Concord-Gastonia, NC-SC
- Population (ZIP)
- 34,909
- Household income
- $79,117
- Rent vs Own
- Severe rent burden
- 321.0
Population outlook (York County) Hauer SSP2
- Today (2025)
- 307,757 people
- By 2030
- 335,979 · +9.2%
- By 2040
- 391,378 · +27.2%
- By 2050
- 443,234 · +44.0%
- By 2075
- 557,102 · +81.0%
- By 2100
- 625,837 · +103.4%
Race, ethnicity, and origin ACS 2023
- Neighborhood character
- Predominantly White (75%)
- Race & ethnicity
- White 75% Black 12% Two or more races 6% Hispanic / Latino 6% Asian 1%
- Hispanic origin (detail)
- Mexican 4%
- Common ancestry
- Romanian 3% Serbian 3% Italian 2%
- Foreign-born
- 4% · Canada
- Languages at home
- 94% English-only · Spanish 4%
Political lean MEDSL · York
- 2024 margin
- R (+19.1) · D 39.7% · R 58.8% · Other 1.5%
- 2008→2024 swing
- -1.4pp toward R · 2008: -17.7pp · 2024: -19.1pp
- All cycles
- 2024: R+19.1 2020: R+16.5 2016: R+22.1 2012: R+20.5 2008: R+17.7
Not yet ingested
- Civics
- —
Market trends
- HPI YoY
- ▼ -109.42%
- Current HPI
- 251.6848
- Rent YoY
- —
- Metro
- Charlotte-Concord-Gastonia, NC-SC
- State GDP YoY
- ▲ 4.51%
- F500 in state
- 2
Industry mix (Fortune 500 HQ in SC)
| Industry | F500 HQs | Revenue |
|---|---|---|
| Packaging | 1 | $7B |
|
||
Price history
2 events — show timeline
- 2026-04-05 Pending — CANOPYMLS as Distributed by MLS Grid
- 2026-04-05 Listed $272,899 CANOPYMLS as Distributed by MLS Grid
Cash-flow waterfall
monthlySold comps — $/sqft
last 12 mo · ≤1 miLoading sold comps…