1505 25th Ave · Vero Beach, FL
Flood risk 5/10 · Moderate
- FEMA flood zone
- X (unshaded)
- Chance of flooding over 30 yrs
- 0.67%
- Est. flood insurance / yr
- $507 – $1,088
Fire risk 1/10 · Minimal
- Est. fire insurance / yr
- $947 – $1,759
Heat risk 10/10 · Severe
- Hot days now (above 105°F)
- 7 days/yr
- Hot days in 30 yrs
- 25 days/yr
Wind risk 10/10 · Severe
- Chance of severe wind over 30 yrs
- 99.0%
Air-quality risk 1/10 · Minimal
- Unhealthy air days now
- 0 days/yr
- Unhealthy air days in 30 yrs
- 0 days/yr
Risk factors via First Street. Map © Google.
Why this score? — see what drove the F grade
The composite is a weighted blend of 9 inputs, each scored 0–100. Each bar is that input's sub-score; the figure is the points it added to the 100-point composite (weight × sub-score).
- Cash flow +6.9/30.0
- Schools +4.2/10.0
- Livability +4.0/5.0
- Condition / age +2.5/5.0
- Rent growth +2.1/5.0
- 1% rule +1.5/10.0
- DSCR +1.1/10.0
- ARV discount +0.0/15.0
- Appreciation +0.0/10.0
$275,000
🖨 Deal sheet 📄 Offer letter ✓ Due diligence
Listing remarks
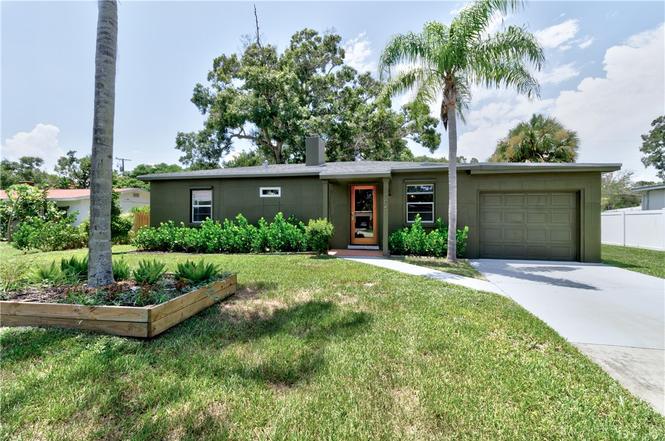
This charming vintage home in the heart of Vero Beach seamlessly blends modern updates with its traditional character. Notable updates include 2022 roof, kitchen+appliances, bath, paint & doors, 2023 fence, 2024 water heater. Featuring 3bedrooms, 1bathroom +GARAGE, this home retains its 1950s charm with original terrazzo floors & a cozy fireplace. Enjoy the outdoors on your covered patio or relax under a majestic oak tree, making the most of the serene spacious yard. Conveniently located w the w/ i city limits of Vero Beach, provides convenient access to city water/sewer, beach, shopping+parks
Key facts
- 0.26 acre lot
- Garage
- Built 1957
Property features AI
Finance
- Financial info: Pets allowed
- HOA & community: No association name listed; Community amenities: Playground, Park, Tennis Courts
Exterior
- Parking: Garage (1 space)
- Utilities: Public water; County sewer
- Home design: Single-story; Residential property
- Construction: Block and concrete construction; Shingle roof
- Exterior features: Patio; Lot roughly quarter to half acre (83 x 135); Faces east
Interior
- Kitchen: Range; Microwave; Dishwasher; Refrigerator
- Bedrooms: Bedroom (12 x 10); Bedroom (12 x 9); Bedroom (13 x 9)
- Flooring: Concrete
- Bathrooms: 1 full bathroom
- Heating & cooling: Central heating; Central air conditioning
- Interior features: Pantry; Unfurnished; Concrete flooring; Fireplace (1)
- Laundry & utility: Washer; Dryer; Laundry located in garage; Electric water heater
Neighborhood map
What this means for you Summary
Snapshot
- This is a 2-bed/1.0-bath single-family listed at $275k.
Deal economics
- At list price, monthly cash flow is $-418 ($-5k/yr) — negative.
- To cash-flow at today's rent, offer at most $201k (26.9% below list).
- To meet the 1% rule (rent ≥ 1% of price), the offer needs to be $179k (35.0% below list).
- Recommended offer: $179k (35.0% below list) — sets the bar for 1% rule.
- Cap rate 4.5% vs local median 2.9% in Vero Beach — top-decile yield for the area; either an underpriced asset or a hidden risk that comps aren't pricing in. Stress-test before assuming the spread holds.
Location & tenants
- Location reads 80/100 on livability (#116 in FL, #1,784 nationally) — a professional / high-income tenant draw. Strengths: crime A+, commute A+, health & safety A+; Watch: employment D+, amenities D.
- Indian River (other): math 48% / reading 52% proficiency, ranked #35 of 73 in FL (top 48%) — acceptable for families but not a draw, mixed tenant base, ~2y average lease.
- Market conditions: Rents soft (-1.7%/yr); 206 active listings in the ZIP; 28 comparable units currently listed for rent nearby; rentals at typical pace (median 21d on market — plan ~3-4 weeks tenant-placement turnaround); 564 units permitted in Indian River County in 2024 (281 in 5+ unit buildings).
- This rent runs 39% of the median local income ($55k/yr) — at the standard rent-burdened threshold; future hikes will face affordability resistance.
Forward outlook
- Local home prices are declining (-3.0%/yr); year-one equity from $2k of loan paydown is wiped out by about $8k of value loss. Plan a longer hold.
- Indian River County population projected at +18% by 2050 — long-run rental-demand tailwind backs the buy-and-hold thesis.
Negotiation context
- It's been on market 141 days — a 12% lower offer ($242k) is reasonable based on typical stale-listing flexibility.
- 3 sale attempts since 2y ago; this cycle's ask has dropped $24k (8%) from the opening price — seller is motivated, your offer sets the floor, not the list.
Risks & watch-outs
- Watch-outs: built in 1957 — expect roof / HVAC / electrical / plumbing capex.
- Climate carrying-cost: moderate flood risk; severe wind risk, 99% chance of damaging wind over 30y; extreme-heat days projected 7→25/yr by 2055 (HVAC capex compounding) — expect insurance premiums to compound above CPI over the hold.
Questions for the listing agent
- What do current leases actually rent for vs. the listed asking? Can we see a recent rent roll and the last 12 months of T-12 income?
- It's been on market 141 days. Have you received any prior offers? Is the seller open to a 35% concession, seller financing, or rate buy-down credit?
- Built in 1957 — when were the roof, HVAC, electrical panel, plumbing, and water heater last replaced?
- Why hasn't it sold? Are there any deal-killer items the seller is aware of (foundation, flood, title, zoning, code violations)?
- Is there a deadline driving the sale (1031 exchange, divorce, estate, relocation)? That informs how much negotiation room exists.
- The area grade is low — what's the realistic commute time and amenity access for the typical tenant pool here? Any planned neighborhood developments (good or bad) we should know about?
- What's the average days-on-market for RENTAL listings here right now (not sales)? A rising rental-DOM trend means longer vacancies and softer asking-rent achievability than the comps imply.
- What's the recent tenant-quality profile in this submarket — average credit score on applications, eviction rate, late-payment / NSF rate, and stable-employment percentage? A property-management company in the area should have these aggregated.
- How much new for-sale + rental construction is in the pipeline within 1–3 miles? Heavy new supply typically softens prices + rents 12–24 months out; constrained supply supports both.
Investment metrics
- 1% rule
- 0.65% ✗
- Cap rate
- 4.47%
- Cash-on-cash
- -6.51%
- DSCR
- 0.71
- GRM
- 12.8
CMA / ARV
- ARV (on-the-fly)
- $219,960
- Comps found
- 9
Show comp detail 9 sales within ~0.75 mi
| Address | Dist | Beds/Ba | Sqft | Sold | Price | $/sf | Match |
|---|---|---|---|---|---|---|---|
| 1654 26th Ave | 0.19mi | 2/1.0 | 870 (-7%) | 15mo | $300,000 | $345 | 67 |
| 1503 25th Ave | 0.02mi | 2/2.0 | 1,060 (+13%) | 9mo | $320,000 | $302 | 66 |
| 2630 11th Pl | 0.52mi | 1/1.0 (-1) | 912 (-3%) | 9mo | $130,000 | $143 | 59 |
| 1545 20th Ave | 0.34mi | 2/2.0 | 840 (-10%) | 10mo | $260,000 | $310 | 55 |
| 1735 31st Ave | 0.47mi | 3/1.0 (+1) | 948 (+1%) | 22mo | $224,000 | $236 | 53 |
| 1711 11th Pl | 0.66mi | 2/2.0 | 984 (+5%) | 5mo | $190,000 | $193 | 53 |
| 1225 28th Ave | 0.45mi | 2/1.5 | 1,020 (+9%) | 12mo | $240,000 | $235 | 52 |
| 1606 34th Ave | 0.55mi | 2/1.0 | 1,017 (+9%) | 12mo | $147,500 | $145 | 50 |
| 3056 12th St | 0.53mi | 2/2.0 | 1,025 (+10%) | 7mo | $210,000 | $205 | 50 |
Match score weights: distance 35% · size 25% · config 20% · recency 20%. Top-matched comps best support the ARV.
Projected returns pro-forma
-3.0% appreciation · 0.0% rent growth · sell at horizon
- IRR
- -30.8%
- Equity multiple
- 0.01×
- Total profit
- $-76,441
- Equity at exit
- $41,003
- IRR
- -52.3%
- Equity multiple
- -0.57×
- Total profit
- $-121,158
- Equity at exit
- $23,777
Cash invested: $77,000 (down + closing). Projections, not guarantees.
Landlord ↔ Tenant lean methodology
- Overall (STATE)
- 87 Strongly Landlord-Friendly
- State Florida
- 87 Strongly Landlord-Friendly · R+3
- County
- — inherits STATE
- City
- — inherits STATE
ZIP-level market 32960
- Home prices YoY
- -25.5%
- Rents YoY
- -1.7%
- Active inventory
- 206
- Price-to-rent
- 12.8×
Monthly cashflow live
- Estimated rent
- $1,788 high interval (Pro) →
- Mortgage (P&I)
- −$1,442
- Tax from tax record
- −$274 /mo · $3,283/yr
- Insurance
- −$115
- HOA
- −$0
- Vacancy / Maint / Mgmt
- −$375
- Net cashflow
- $-418
Break-even live
UW: 25.0% down · 7.5% · 30yr · 1.5% tax · 5.0% vac · 8.0% maint · 8.0% mgmt
Financing live
Cash to close
- Down payment
- $68,750
- Closing costs
- $8,250
- Reserves months
- —
- Total cash needed
- —
Loan-product check · same deal, 3 products live
Conventional
25% down · 7.5% · 30yr
- Down + closing
- —
- Monthly P&I
- —
- Monthly cashflow
- —
- DSCR
- —
- Eligible?
- —
Personal DTI + credit; lowest rate.
DSCR
20% down · 8.5% · 30yr
- Down + closing
- —
- Monthly P&I
- —
- Monthly cashflow
- —
- DSCR
- —
- Eligible?
- —
No personal income docs; deal must DSCR.
Hard money
10% down · 12.0% · 12mo
- Down + closing
- —
- Monthly P&I
- —
- Monthly cashflow
- —
- DSCR
- —
- Eligible?
- —
Short-term bridge; refi at stabilization.
Rent comps 28 comps
| Address | Beds | Baths | Sqft | Rent | $/sqft | DOM | Units | Dist |
|---|---|---|---|---|---|---|---|---|
| 1936 18th Ave Unit A Vero Beach, FL | 2.0 | 1.0 | 1100 | $2,000 | $1.82 | 21d | 1 | 0.67mi |
| 1429 19th Pl #4 Vero Beach, FL | 2.0 | 1.0 | 873 | $1,800 | $2.06 | 21d | 1 | 0.84mi |
| 2145 30th Ave Vero Beach, FL | 2.0 | 2.0 | 1036 | $3,500 | $3.38 | 13d | 1 | 0.86mi |
| 1306 12th St Unit B Vero Beach, FL | 2.0 | 1.0 | 1000 | $1,600 | $1.60 | 21d | 1 | 0.87mi |
| 1505 40th Ave Vero Beach, FL | 2.0 | 1.0 | 770 | $1,650 | $2.14 | 21d | 2 | 0.97mi |
| 1748 23rd St Vero Beach, FL | 1.0 | 1.0 | 900 | $1,250 | $1.39 | 13d | 1 | 0.98mi |
| 1827 24th St Vero Beach, FL | 2.0 | 1.0 | 850 | $1,900 | $2.24 | 21d | 1 | 1.01mi |
| 1865 40th Ave #1 Vero Beach, FL | 2.0 | 1.0 | 940 | $1,500 | $1.60 | 21d | 1 | 1.06mi |
| 1885 40th Ave Unit 5 Vero Beach, FL | 2.0 | 1.0 | 700 | $1,700 | $2.43 | 21d | 1 | 1.07mi |
| 1885 40th Ave Vero Beach, FL | 2.0 | 1.0 | 700 | $1,700 | $2.43 | 21d | 1 | 1.07mi |
| 1895 40th Ave Unit 4 Vero Beach, FL | 1.0 | 1.0 | 600 | $1,450 | $2.42 | 13d | 1 | 1.08mi |
| 4141 16th St #109 Vero Beach, FL | 2.0 | 2.0 | 932 | $1,500 | $1.61 | 13d | 1 | 1.08mi |
| 1876 41st Ave Unit 1 Vero Beach, FL | 2.0 | 1.0 | 750 | $1,600 | $2.13 | 21d | 1 | 1.10mi |
| 1886 41st Ave Unit 1 Vero Beach, FL | 2.0 | 1.0 | 700 | $1,600 | $2.29 | 21d | 1 | 1.10mi |
| 1886 41st Ave Vero Beach, FL | 2.0 | 1.0 | 700 | $1,600 | $2.29 | 21d | 1 | 1.10mi |
| 4123 18th Pl Vero Beach, FL | 2.0 | 1.0 | 784 | $1,595 | $2.03 | 21d | 1 | 1.16mi |
| 4123 18th Pl #4123 Vero Beach, FL | 2.0 | 1.0 | 784 | $1,595 | $2.03 | 13d | 1 | 1.16mi |
| 1835 42nd Ave Unit B Vero Beach, FL | 1.0 | 1.0 | 640 | $1,500 | $2.34 | 21d | 1 | 1.19mi |
| 1835 42nd Ave Unit A Vero Beach, FL | 1.0 | 1.0 | 725 | $1,600 | $2.21 | 21d | 1 | 1.19mi |
| 1835 42nd Ave Unit A Vero Beach, FL | 1.0 | 1.0 | 725 | $1,600 | $2.21 | 13d | 1 | 1.19mi |
| 939 19th St Unit 961 Vero Beach, FL | 2.0 | 2.0 | 1000 | $1,850 | $1.85 | 21d | 1 | 1.21mi |
| 2222 Ponce De Leon Cir Unit B Vero Beach, FL | 2.0 | 1.0 | 970 | $1,650 | $1.70 | 13d | 1 | 1.23mi |
| 1100 Ponce de Leon Cir #305 Vero Beach, FL | 2.0 | 2.0 | 840 | $1,350 | $1.61 | 21d | 1 | 1.24mi |
| 974 14th Ln Vero Beach, FL | 1.0–3.0 | 1.0–3.0 | 1828 | $4,049 | $2.21 | 13d | 32 | 1.25mi |
| 2359 De Soto Ave Vero Beach, FL | 1.0 | 1.0 | 570 | $1,500 | $2.63 | 21d | 1 | 1.27mi |
| 923 22nd Pl #106 Vero Beach, FL | 2.0 | 2.0 | 860 | $1,600 | $1.86 | 21d | 1 | 1.40mi |
| 405 27th Ct Vero Beach, FL | 3.0 | 2.0 | 1100 | $1,850 | $1.68 | 13d | 1 | 1.45mi |
| 686 17th St Vero Beach, FL | 2.0 | 1.0 | 950 | $1,700 | $1.79 | 13d | 2 | 1.50mi |
Listing history 14 events
-
2026-05-15historical Active Under Contract
-
2026-04-21price $275,000
-
2026-03-10price $290,000
-
2026-01-08$299,000 Active
-
2026-01-06historical $299,000
-
2024-10-04price $299,000
-
2024-09-18price $315,000
-
2024-07-31$325,000 Active
-
2024-07-29historical
-
2024-06-03price $330,000
-
2024-03-27$335,000 Active
-
2022-05-19soldstatus $250,000
-
2005-05-21soldstatus $136,000
-
1996-09-12soldstatus $47,500
ⓘ Source: listings_history table (triggers on properties + properties_extension) + one-shot
backfill from property_details.listing_events for pre-trigger history.
Tax reassessment forecast FL · Resets to sale price
- Current annual tax
- $3,283 · $274/mo
- Projected year-2 tax
- $3,283 · $274/mo
- Expected delta
- $0/yr ($0/mo · 0.0%)
ⓘ Screening estimate from a state-policy table — verify with the county assessor before closing.
Climate risk First Street
- Flood 5/10 Major FEMA zone X (unshaded) · 67% chance over 30 yrs
- Wildfire 1/10 Low
- Heat 10/10 Extreme 7 d/yr ≥105°F today · 25 d/yr by 30 yrs out
- Wind 10/10 Extreme 99% chance of damaging wind over 30 yrs
- Air quality 1/10 Low 0 unhealthy d/yr today · 0 by 30 yrs out
Nearby sold comps map
Loading sold comps map…
Walkable amenities ~0.75 mi
Loading nearby amenities…
Taxation est. · year 1
- Rental income
- $21,452
- − Mortgage interest
- −$15,404
- − Property taxes
- −$3,283
- − Insurance
- −$1,375
- − Repairs & maintenance
- −$1,716
- − Management
- −$1,716
- − Depreciation
- −$8,000
- Taxable loss
- −$10,042
- Est. tax savings @ 24.0%
- +$2,410
- After-tax cash flow
- $-2,606/yr
For passive investors: Depreciation is non-cash, so a rental often shows a tax loss while cash-flowing — sheltering income. Rental losses are passive: they offset passive income freely, and up to $25,000/yr can offset ordinary (W-2) income if you actively participate and your MAGI is under $100k (phasing out to $0 by $150k); unused losses carry forward. On sale, claimed depreciation is recaptured at up to 25%, and gains may owe capital-gains tax (a 1031 exchange can defer both). Figures are a year-1 estimate at your 24.0% rate — not tax advice; consult a CPA.
Schools (NCES district)
- District
- Indian River
- NCES district ID
- 1200930
- Math proficiency
- 48% ▼ -9.00%
- Reading proficiency
- 52% ▼ -3.00%
- Median HH income
- $46,597
- Composite
- 42.45/100
- National rank
- #3218
- State rank
- #35 of 73 in FL
Livability — Vero Beach
- Score
- 80/100
- State rank
- #116
- US rank
- #1784
Category grades
Schools grade is shown separately in the Schools card above.
Census & demographics
- Census place
- Vero Beach, FL
- County
- Indian River County · 143,738 people
- City population
- 98,707
- Metro
- Sebastian-Vero Beach, FL
- Population (ZIP)
- 25,259
- Household income
- $54,682
- Rent vs Own
- Severe rent burden
- 1166.0
Population outlook (Indian River County) Hauer SSP2
- Today (2025)
- 165,104 people
- By 2030
- 172,869 · +4.7%
- By 2040
- 185,640 · +12.4%
- By 2050
- 194,465 · +17.8%
- By 2075
- 211,115 · +27.9%
- By 2100
- 211,781 · +28.3%
Race, ethnicity, and origin ACS 2023
- Neighborhood character
- Majority White (65%)
- Race & ethnicity
- White 65% Hispanic / Latino 16% Two or more races 12% Black 10% Asian 4% Native American 1%
- Hispanic origin (detail)
- Mexican 6% Puerto Rican 3% Cuban 2%
- Common ancestry
- Italian 4% Slovak 3% Romanian 3%
- Foreign-born
- 11% · Canada, Jamaica, Vietnam
- Languages at home
- 82% English-only · Spanish 13% French/Haitian/Cajun 2% Other Asian/Pacific 1%
Political lean MEDSL · Indian River
- 2024 margin
- Strong R (+27.4) · D 36.0% · R 63.4%
- 2008→2024 swing
- -12.5pp toward R · 2008: -14.8pp · 2024: -27.4pp
- All cycles
- 2024: R+27.4 2020: R+21.6 2016: R+24.5 2012: R+22.3 2008: R+14.8
Not yet ingested
- Civics
- —
Market trends
- HPI YoY
- ▼ -103.20%
- Current HPI
- 302.0029
- Rent YoY
- ▼ -1.66%
- Metro
- Sebastian-Vero Beach, FL
- State GDP YoY
- ▲ 3.28%
- F500 in state
- 36
Industry mix (Fortune 500 HQ in FL)
| Industry | F500 HQs | Revenue |
|---|---|---|
| Industrial Technology | 2 | $29B |
|
||
| Insurance | 2 | $17B |
|
||
| Retail | 1 | $60B |
|
||
| Technology Distribution | 1 | $58B |
|
||
| Homebuilding | 1 | $35B |
|
||
| Technology Manufacturing | 1 | $35B |
|
||
Price history
+478.9% since first listed14 events — show timeline
- 2026-05-15 Contingent — RAIRCMLS
- 2026-04-21 Price Changed $275,000 RAIRCMLS
- 2026-03-10 Price Changed $290,000 RAIRCMLS
- 2026-01-08 Listed $299,000 RAIRCMLS
- 2026-01-06 Coming Soon $299,000 RAIRCMLS
- 2024-10-04 Price Changed $299,000 RAIRCMLS
- 2024-09-18 Price Changed $315,000 RAIRCMLS
- 2024-07-31 Listed $325,000 RAIRCMLS
- 2024-07-29 Coming Soon — RAIRCMLS
- 2024-06-03 Price Changed $330,000 RAIRCMLS
- 2024-03-27 Listed $335,000 RAIRCMLS
- 2022-05-19 Sold (Public Records) $250,000 Public Records
- 2005-05-21 Sold (Public Records) $136,000 Public Records
- 1996-09-12 Sold (Public Records) $47,500 Public Records
Property tax history
+10.9%/yrLatest (2025): $3,283 · +12.3% YoY. Source: county tax records.
Cash-flow waterfall
monthlySold comps — $/sqft
last 12 mo · ≤1 miLoading sold comps…