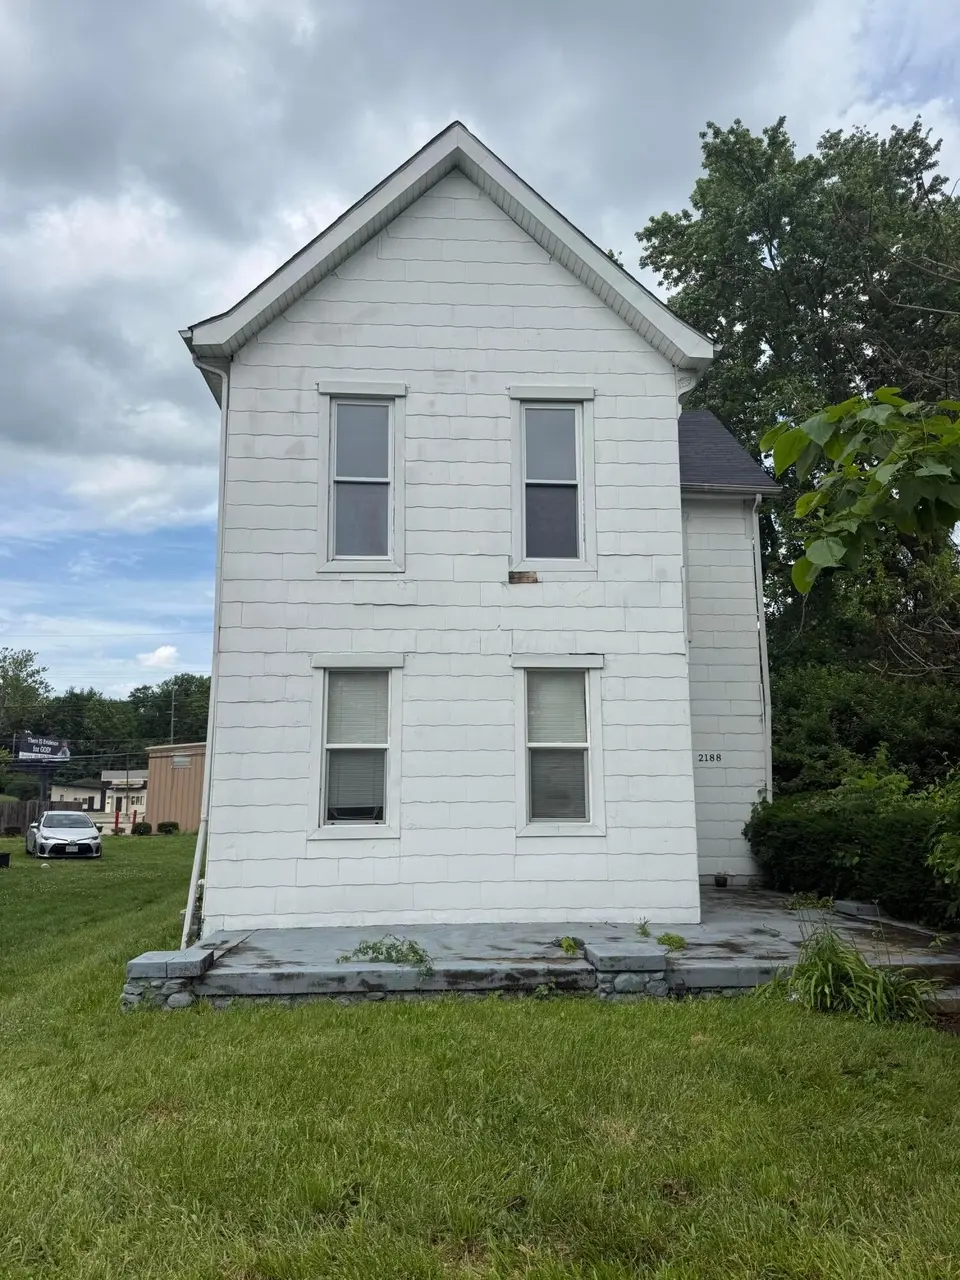
2188 Margaret Ave · Columbus, OH
Flood risk 3/10 · Minor
- FEMA flood zone
- X (unshaded)
- Chance of flooding over 30 yrs
- 0.2%
- Est. flood insurance / yr
- $473 – $860
Fire risk 1/10 · Minimal
- Est. fire insurance / yr
- $713 – $1,323
Heat risk 4/10 · Minor
- Hot days now (above 99°F)
- 7 days/yr
- Hot days in 30 yrs
- 18 days/yr
Wind risk 2/10 · Minimal
- Chance of severe wind over 30 yrs
- 1.0%
Air-quality risk 2/10 · Minimal
- Unhealthy air days now
- 1 days/yr
- Unhealthy air days in 30 yrs
- 3 days/yr
Risk factors via First Street. Map © Google.
Why this score? — see what drove the B grade
The composite is a weighted blend of 9 inputs, each scored 0–100. Each bar is that input's sub-score; the figure is the points it added to the 100-point composite (weight × sub-score).
- Cash flow +28.2/30.0
- ARV discount +15.0/15.0
- DSCR +10.0/10.0
- 1% rule +8.3/10.0
- Livability +4.0/5.0
- Condition / age +2.5/5.0
- Rent growth +2.3/5.0
- Schools +1.7/10.0
- Appreciation +0.0/10.0
$144,900
🖨 Deal sheet (PDF) 📄 Offer letter ✓ Due diligence
Listing remarks MLS
This is a Fannie Mae HomePath property Large two story single family located close proximity to downtown Columbus and public transportation. This home features 2 bedrooms 1 bath on a large lot. Home will require some repair but has great potential.
Key facts
- Near dining
- Great natural light
- Near shopping
Tags
Property features AI
Finance
- HOA & community: Bike/walk path; Sidewalks
Exterior
- Parking: Detached garage with garage door opener; On-street parking; 1 garage space
- Utilities: Public water; Public sewer
- Home design: Single family residence; Two levels; Built in 1880; No shared/common walls
- Construction: Block foundation
- Exterior features: Deck; Fenced yard; Shed(s)
Interior
- Bedrooms: One main-level bedroom
- Flooring: Wood flooring; Carpeted areas
- Bathrooms: One full bathroom
- Heating & cooling: Forced air heating; Central air conditioning
- Interior features: Decorative fireplace; Full basement; Insulated part of windows
Neighborhood map
What this means for you Summary
Snapshot
- This is a 3-bed/1.0-bath single-family listed at $145k.
Deal economics
- At list price, monthly cash flow is $461 ($6k/yr) — positive.
- The deal already cash-flows at list — no discount required.
- Meets the 1% rule at list price ($2k rent vs $145k).
- Cap rate 10.1% vs local median 3.8% in Columbus — top-decile yield for the area; either an underpriced asset or a hidden risk that comps aren't pricing in. Stress-test before assuming the spread holds.
Location & tenants
- Location reads 81/100 on livability (#97 in OH, #1,491 nationally) — a professional / high-income tenant draw. Strengths: commute A+, cost of living A+, housing A+; Watch: employment C-, crime F.
- Columbus City School District (urban): math 15% / reading 26% proficiency, ranked #626 of 656 in OH (top 95%) — low school quality limits family demand, transient renter base, plan for 1-2y turnover; 72% free/reduced lunch — lower-income household profile, screen leases tightly.
- Zoned schools: Indianola Informal K-8 School (math 43% / reading 58%, grade D+, #896 of 1,584 statewide, top 57%, 684 students, 0% FRL); Arts Impact Middle School (Aims) (math 17% / reading 25%, grade F, #608 of 654 statewide, top 93%, 532 students, 0% FRL); Columbus Alternative High School (math 27% / reading 74%, grade D+, #380 of 781 statewide, top 49%, 758 students, 0% FRL) — zoned schools average 0% FRL vs 72% district-wide (72 pts lower); this property's tenant base skews higher-income than the district average.
- Zoned-school proficiency averages 41% at this address vs 20% district-wide (+20 pts) — the actual schools serving this property are materially stronger than the Columbus City School District average implies; a family-tenant draw the district grade alone would hide.
- Market conditions: Rents soft (-0.8%/yr); 102 active listings in the ZIP; 15 comparable units currently listed for rent nearby; rentals at typical pace (median 25d on market — plan ~3-4 weeks tenant-placement turnaround); 8,139 units permitted in Franklin County in 2024 (5,940 in 5+ unit buildings).
- This rent runs 45% of the median local income ($52k/yr) — at the standard rent-burdened threshold; future hikes will face affordability resistance.
Forward outlook
- Local home prices are declining (-3.0%/yr); year-one equity from $1k of loan paydown is wiped out by about $4k of value loss. Plan a longer hold.
- Franklin County population projected at +34% by 2050 — long-run rental-demand tailwind backs the buy-and-hold thesis.
Negotiation context
- Only 9 days on market — expect competitive offers; lowballing is unlikely to land.
- 3 sale attempts since 12y ago with the ask held roughly flat each time — persistent listings suggest the price (not the market) is what's stuck; bring a comps-based counter.
- Current owner paid $50k; list at $145k implies a 190% gain — meaningful room to come down on a strong offer.
Risks & watch-outs
- Watch-outs: built in 1880 — expect roof / HVAC / electrical / plumbing capex.
Questions for the listing agent
- Built in 1880 — when were the roof, HVAC, electrical panel, plumbing, and water heater last replaced?
- Is there a deadline driving the sale (1031 exchange, divorce, estate, relocation)? That informs how much negotiation room exists.
- Crime grade is F in this area — have there been break-ins, vandalism, or insurance claims at this property in the last 3 years? What carrier currently insures it and at what premium?
- What's the average days-on-market for RENTAL listings here right now (not sales)? A rising rental-DOM trend means longer vacancies and softer asking-rent achievability than the comps imply.
- What's the recent tenant-quality profile in this submarket — average credit score on applications, eviction rate, late-payment / NSF rate, and stable-employment percentage? A property-management company in the area should have these aggregated.
- How much new for-sale + rental construction is in the pipeline within 1–3 miles? Heavy new supply typically softens prices + rents 12–24 months out; constrained supply supports both.
Investment metrics
- 1% rule
- 1.33% ✓
- Cap rate
- 10.11%
- Cash-on-cash
- 13.64%
- DSCR
- 1.61
- GRM
- 6.2
CMA / ARV
- ARV (on-the-fly)
- $232,864
- Comps found
- 12
Show comp detail 12 sales within ~0.75 mi
| Address | Dist | Beds/Ba | Sqft | Sold | Price | $/sf | Match |
|---|---|---|---|---|---|---|---|
| 2250 Willamont Ave | 0.12mi | 4/1.5 (+1) | 1,468 (-4%) | 2mo | $230,000 | $157 | 79 |
| 2070 Dartmouth Ave | 0.20mi | 3/1.5 | 1,392 (-9%) | 1mo | $146,000 | $105 | 73 |
| 921 N Nelson Rd | 0.30mi | 3/1.5 | 1,406 (-8%) | 1mo | $190,000 | $135 | 69 |
| 1091 Rosewood Ave | 0.39mi | 4/2.0 (+1) | 1,565 (+2%) | 8mo | $230,000 | $147 | 62 |
| 2380 Caroline Ave | 0.48mi | 3/3.0 | 1,533 (+0%) | 13mo | $610,000 | $398 | 59 |
| 2143 Leonard Ave | 0.26mi | 4/2.0 (+1) | 1,366 (-11%) | 4mo | $175,000 | $128 | 58 |
| 1961 Dartmouth Ave | 0.33mi | 3/1.5 | 1,312 (-14%) | 4mo | $199,000 | $152 | 56 |
| 525 Northview Dr | 0.62mi | 3/1.5 | 1,600 (+4%) | 8mo | $362,000 | $226 | 55 |
| 2117 Willamont Ave | 0.12mi | 3/2.0 | 1,316 (-14%) | 14mo | $205,000 | $156 | 55 |
| 1103 Wildwood Ave | 0.42mi | 3/2.0 | 1,381 (-10%) | 18mo | $187,000 | $135 | 45 |
| 1094 Meadowdale Ave | 0.41mi | 3/2.0 | 1,336 (-13%) | 17mo | $210,000 | $157 | 42 |
| 782 Northview Ave | 0.65mi | 3/1.0 | 1,303 (-15%) | 5mo | $170,000 | $130 | 41 |
Match score weights: distance 35% · size 25% · config 20% · recency 20%. Top-matched comps best support the ARV.
Projected returns pro-forma
-3.0% appreciation · 0.0% rent growth · sell at horizon
- IRR
- 0.2%
- Equity multiple
- 1.01×
- Total profit
- $298
- Equity at exit
- $21,605
- IRR
- 6.3%
- Equity multiple
- 1.41×
- Total profit
- $16,466
- Equity at exit
- $12,528
Cash invested: $40,572 (down + closing). Projections, not guarantees.
Landlord ↔ Tenant lean methodology
- Overall (STATE)
- 73 Landlord-Friendly
- State Ohio
- 73 Landlord-Friendly · R+6
- County
- — inherits STATE
- City
- — inherits STATE
ZIP-level market 43219
- Rents YoY
- -0.8%
- Active inventory
- 102
- Price-to-rent
- 6.2×
Monthly cashflow live
- Estimated rent
- $1,934 high interval (Pro) →
- Mortgage (P&I)
- −$760
- Tax from tax record
- −$246 /mo · $2,953/yr
- Insurance
- −$60
- HOA
- −$0
- Vacancy / Maint / Mgmt
- −$406
- Net cashflow
- $461
Break-even live
Sensitivity live
| Price | -10% $543 | -5% $502 | +0% $461 | +5% $420 | +10% $379 |
|---|---|---|---|---|---|
| Rent | -10% $308 | -5% $385 | +0% $461 | +5% $538 | +10% $614 |
| Rate | -1.0pp $534 | -0.5pp $498 | base $461 | +0.5pp $424 | +1.0pp $385 |
UW: 25.0% down · 7.5% · 30yr · 1.5% tax · 5.0% vac · 8.0% maint · 8.0% mgmt
Financing live
Cash to close
- Down payment
- $36,225
- Closing costs
- $4,347
- Reserves months
- —
- Total cash needed
- —
Loan-product check · same deal, 3 products live
Conventional
25% down · 7.5% · 30yr
- Down + closing
- —
- Monthly P&I
- —
- Monthly cashflow
- —
- DSCR
- —
- Eligible?
- —
Personal DTI + credit; lowest rate.
DSCR
20% down · 8.5% · 30yr
- Down + closing
- —
- Monthly P&I
- —
- Monthly cashflow
- —
- DSCR
- —
- Eligible?
- —
No personal income docs; deal must DSCR.
Hard money
10% down · 12.0% · 12mo
- Down + closing
- —
- Monthly P&I
- —
- Monthly cashflow
- —
- DSCR
- —
- Eligible?
- —
Short-term bridge; refi at stabilization.
Rent comps 15 comps
| Address | Beds | Baths | Sqft | Rent | $/sqft | DOM | Units | Dist |
|---|---|---|---|---|---|---|---|---|
| 747 Malvern Ave Columbus, OH | 3.0 | 2.5 | 2146 | $2,295 | $1.07 | 45d | 1 | 0.10mi |
| 1980 E 5th Ave Columbus, OH | 4.0 | 2.0 | 1700 | $2,206 | $1.30 | 45d | 1 | 0.31mi |
| 693 N Dawson Ave Columbus, OH | 3.0 | 1.0 | 1233 | $1,295 | $1.05 | 25d | 1 | 0.68mi |
| 2688 Bellwood Ave Columbus, OH | 3.0 | 2.5 | 1495 | $2,295 | $1.54 | 25d | 1 | 0.86mi |
| 2841 E 10th Ave Columbus, OH | 3.0 | 3.0 | 1200 | $1,650 | $1.38 | 45d | 1 | 0.96mi |
| 2864 E 10th Ave Columbus, OH | 3.0 | 1.0 | 1200 | $1,649 | $1.37 | 3d | 1 | 1.00mi |
| 1590 Vendome Dr S Columbus, OH | 3.0 | 1.5 | 1303 | $1,600 | $1.23 | 23d | 1 | 1.12mi |
| 1590 Vendome Dr S Columbus, OH | 3.0 | 1.5 | 1303 | $1,600 | $1.23 | 25d | 1 | 1.12mi |
| 286 Taylor Ave Unit 1496096P Columbus, OH | 3.0 | 2.5 | 1894 | $7,586 | $4.01 | 3d | 1 | 1.15mi |
| 2504 Vendome Dr Columbus, OH | 3.0 | 1.0 | 1072 | $1,600 | $1.49 | 16d | 1 | 1.25mi |
| 1740 E Broad St Columbus, OH | 2.0 | 1.0 | 1200 | $1,500 | $1.25 | 25d | 1 | 1.26mi |
| 1620 E Broad St Columbus, OH | 2.0 | 2.0 | 1214 | $2,025 | $1.67 | 5d | 2 | 1.36mi |
| 1620 E Broad St #408 Columbus, OH | 2.0 | 2.0 | 1247 | $2,150 | $1.72 | 25d | 1 | 1.37mi |
| 1308-1310 Mount Vernon Ave Unit 1308 Columbus, OH | 3.0 | 2.0 | 1400 | $1,695 | $1.21 | 45d | 1 | 1.39mi |
| 1216 Atcheson St Columbus, OH | 3.0 | 2.0 | 1092 | $1,550 | $1.42 | 5d | 1 | 1.46mi |
Listing history 7 events
-
2026-06-21days on market $144,900 Active 9 DOM
-
2026-06-18days on market $144,900 Active 6 DOM
-
2026-06-17days on market $144,900 Active 5 DOM
-
2026-06-16days on market $144,900 Active 4 DOM
-
2026-06-15days on market $144,900 Active 3 DOM
-
2026-06-13remarks 365-char remark
-
2026-06-13$144,900 Active 1 DOM
ⓘ Source: listings_history table (triggers on properties + properties_extension) + one-shot
backfill from property_details.listing_events for pre-trigger history.
Tax reassessment forecast OH · Partial reset (capped growth)
- Current annual tax
- $2,953 · $246/mo
- Projected year-2 tax
- $2,953 · $246/mo
- Expected delta
- $0/yr ($0/mo · 0.0%)
ⓘ Screening estimate from a state-policy table — verify with the county assessor before closing.
Climate risk First Street
- Flood 3/10 Moderate FEMA zone X (unshaded) · 20% chance over 30 yrs
- Wildfire 1/10 Low
- Heat 4/10 Moderate 7 d/yr ≥99°F today · 18 d/yr by 30 yrs out
- Wind 2/10 Low 100% chance of damaging wind over 30 yrs
- Air quality 2/10 Low 1 unhealthy d/yr today · 3 by 30 yrs out
Nearby sold comps map
Loading sold comps map…
Walkable amenities ~0.75 mi
Loading nearby amenities…
Taxation est. · year 1
- Rental income
- $23,203
- − Mortgage interest
- −$8,117
- − Property taxes
- −$2,953
- − Insurance
- −$724
- − Repairs & maintenance
- −$1,856
- − Management
- −$1,856
- − Depreciation
- −$4,215
- Taxable income
- $3,481
- Est. tax owed @ 24.0%
- −$836
- After-tax cash flow
- $4,699/yr
For passive investors: Depreciation is non-cash, so a rental often shows a tax loss while cash-flowing — sheltering income. Rental losses are passive: they offset passive income freely, and up to $25,000/yr can offset ordinary (W-2) income if you actively participate and your MAGI is under $100k (phasing out to $0 by $150k); unused losses carry forward. On sale, claimed depreciation is recaptured at up to 25%, and gains may owe capital-gains tax (a 1031 exchange can defer both). Figures are a year-1 estimate at your 24.0% rate — not tax advice; consult a CPA.
Schools (NCES district)
- District
- Columbus City School District
- NCES district ID
- 3904380
- Math proficiency
- 15% ▼ -17.00%
- Reading proficiency
- 26% ▼ -12.00%
- Median HH income
- $38,483
- Composite
- 17.19/100
- National rank
- #9105
- State rank
- #626 of 656 in OH
Livability — Columbus
- Score
- 81/100
- State rank
- #97
- US rank
- #1491
Category grades
Schools grade is shown separately in the Schools card above.
Census & demographics
- Census place
- Columbus, OH
- County
- Franklin County · 1,351,780 people
- City population
- 612,189
- Metro
- Columbus, OH
- Population (ZIP)
- 32,338
- Household income
- $52,094
- Rent vs Own
- Severe rent burden
- 2016.0
Population outlook (Franklin County) Hauer SSP2
- Today (2025)
- 1,456,139 people
- By 2030
- 1,556,890 · +6.9%
- By 2040
- 1,757,349 · +20.7%
- By 2050
- 1,950,539 · +34.0%
- By 2075
- 2,376,171 · +63.2%
- By 2100
- 2,636,796 · +81.1%
Race, ethnicity, and origin ACS 2023
- Neighborhood character
- Majority Black (65%)
- Race & ethnicity
- Black 65% White 17% Hispanic / Latino 10% Two or more races 7% Asian 4%
- Hispanic origin (detail)
- Mexican 6%
- Common ancestry
- Swedish 1% Lithuanian 1% Swiss 1%
- Foreign-born
- 20% · Canada, India, China
- Languages at home
- 76% English-only · Spanish 7% Other Indo-European 3% Chinese 1%
Political lean MEDSL · Franklin
- 2024 margin
- Strong D (+28.4) · D 63.7% · R 35.3% · Other 1.0%
- 2008→2024 swing
- +7.7pp toward D · 2008: 20.7pp · 2024: 28.4pp
- All cycles
- 2024: D+28.4 2020: D+31.4 2016: D+25.9 2012: D+21.7 2008: D+20.7
Not yet ingested
- Civics
- —
Market trends
- HPI YoY
- ▼ -137.02%
- Current HPI
- 172.3872
- Rent YoY
- ▼ -0.84%
- Metro
- Columbus, OH
- State GDP YoY
- ▲ 1.98%
- F500 in state
- 48
Industry mix (Fortune 500 HQ in OH)
| Industry | F500 HQs | Revenue |
|---|---|---|
| Insurance | 3 | $145B |
|
||
| Industrial Machinery | 3 | $49B |
|
||
| Financial Services | 3 | $24B |
|
||
| Consumer Goods | 2 | $93B |
|
||
| Aerospace / Defense | 2 | $47B |
|
||
| Utilities | 2 | $33B |
|
||
Price history
+1160.0% since first listed8 events — show timeline
- 2026-06-12 Listed $144,900 CBRMLS
- 2019-09-19 Sold (Public Records) $50,000 Public Records
- 2019-07-20 Listing Removed — CBRMLS
- 2019-07-06 Price Changed $70,000 CBRMLS
- 2019-06-04 Listed $75,000 CBRMLS
- 2014-12-15 Sold (MLS) $10,000 CBRMLS
- 2014-11-23 Listing Removed — CBRMLS
- 2014-09-11 Listed $11,500 CBRMLS
Property tax history
+15.9%/yrLatest (2024): $2,953 · +1.3% YoY. Source: county tax records.
Cash-flow waterfall
monthlySold comps — $/sqft
last 12 mo · ≤1 miLoading sold comps…