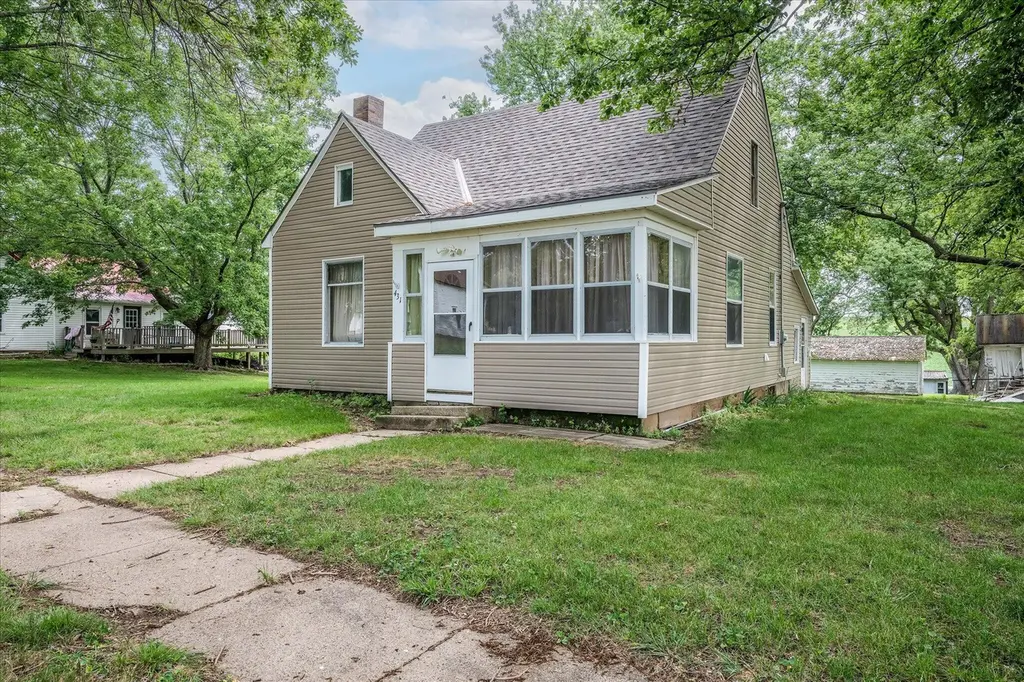
431 S Day Ave · Ute, IA
Flood risk 1/10 · Minimal
- FEMA flood zone
- X (unshaded)
- Chance of flooding over 30 yrs
- 0.0%
- Est. flood insurance / yr
- $473 – $860
Fire risk 1/10 · Minimal
- Est. fire insurance / yr
- $902 – $1,676
Heat risk 3/10 · Minor
- Hot days now (above 103°F)
- 7 days/yr
- Hot days in 30 yrs
- 15 days/yr
Wind risk 2/10 · Minimal
- Chance of severe wind over 30 yrs
- —
Air-quality risk 1/10 · Minimal
- Unhealthy air days now
- 0 days/yr
- Unhealthy air days in 30 yrs
- 0 days/yr
Risk factors via First Street. Map © Google.
Why this score? — see what drove the C- grade
The composite is a weighted blend of 9 inputs, each scored 0–100. Each bar is that input's sub-score; the figure is the points it added to the 100-point composite (weight × sub-score).
- Cash flow +15.7/30.0
- Appreciation +7.9/10.0
- ARV discount +7.5/15.0
- DSCR +4.8/10.0
- Schools +4.8/10.0
- 1% rule +3.3/10.0
- Livability +3.1/5.0
- Rent growth +2.5/5.0
- Condition / age +2.5/5.0
$132,900
🖨 Deal sheet (PDF) 📄 Offer letter ✓ Due diligence
Listing remarks MLS
This home is spacious and charming. It is full of potential for modernization and customization to make it your own! Built on a large corner lot, there is plenty of room for activities. New roof and siding, with gorgeous hardwood floors. Come fall in love today!
Key facts
- New siding
- Large corner lot
- New roof
Tags
Neighborhood map
What this means for you Summary
Snapshot
- This is a 3-bed/2.0-bath single-family listed at $133k.
Deal economics
- At list price, monthly cash flow is $59 ($707/yr) — positive.
- The deal already cash-flows at list — no discount required.
- To meet the 1% rule (rent ≥ 1% of price), the offer needs to be $110k (16.9% below list).
- Recommended offer: $110k (16.9% below list) — sets the bar for 1% rule.
Location & tenants
- Location reads 61/100 on livability (#797 in IA) — a middle-class / working-renter tenant base. Strengths: cost of living A+, housing A+; Watch: crime C-, employment D, health & safety D.
- Charter Oak-Ute Community School District (rural): math 55% / reading 55% proficiency, ranked #308 of 330 in IA (top 93%) — acceptable for families but not a draw, mixed tenant base, ~2y average lease.
- Zoned schools: Charter Oak-Ute Elementary School (math 57% / reading 57%, grade C+, #436 of 616 statewide, top 74%, 128 students, 51% FRL); Charter Oak-Ute Junior High School (math 57% / reading 62%, grade B, #185 of 246 statewide, top 78%, 57 students, 65% FRL) — zoned schools average 58% FRL vs 38% district-wide (20 pts higher); higher-poverty schools than district average — tighter screening recommended.
- Market conditions: 1 active listings in the ZIP; 9 units permitted in Monona County in 2024 (0 in 5+ unit buildings).
Forward outlook
- In year one you build about $9k of equity ($919 loan paydown + $8k appreciation (5.8% local appreciation)).
- Monona County population projected at -12% by 2050 — secular population decline; favor cash flow + early exit over multi-decade hold.
- At projected returns (5.8% appreciation + 3.0% rent growth), your $37k cash investment doubles in ~4 years — after that, you're playing with house money.
- By year 5, paydown + projected appreciation supports a ~$38k cash-out refi (75% LTV) — recoverable capital for the next deal without selling this one.
Negotiation context
- It's been on market 73 days — a 6% lower offer ($125k) is reasonable based on typical stale-listing flexibility.
- 9 sale attempts with the ask held roughly flat each time — persistent listings suggest the price (not the market) is what's stuck; bring a comps-based counter.
- Current owner paid $18k; list at $133k implies a 659% gain — meaningful room to come down on a strong offer.
Risks & watch-outs
- Watch-outs: built in 1920 — expect roof / HVAC / electrical / plumbing capex.
Questions for the listing agent
- It's been on market 73 days. Have you received any prior offers? Is the seller open to a 17% concession, seller financing, or rate buy-down credit?
- Built in 1920 — when were the roof, HVAC, electrical panel, plumbing, and water heater last replaced?
- Why hasn't it sold? Are there any deal-killer items the seller is aware of (foundation, flood, title, zoning, code violations)?
- Is there a deadline driving the sale (1031 exchange, divorce, estate, relocation)? That informs how much negotiation room exists.
- Schools are F-rated, which usually means shorter tenancies and higher turnover. Who's the typical renter profile here, and what's been the actual vacancy rate?
- What's the average days-on-market for RENTAL listings here right now (not sales)? A rising rental-DOM trend means longer vacancies and softer asking-rent achievability than the comps imply.
- What's the recent tenant-quality profile in this submarket — average credit score on applications, eviction rate, late-payment / NSF rate, and stable-employment percentage? A property-management company in the area should have these aggregated.
- How much new for-sale + rental construction is in the pipeline within 1–3 miles? Heavy new supply typically softens prices + rents 12–24 months out; constrained supply supports both.
Investment metrics
- 1% rule
- 0.83% ✗
- Cap rate
- 6.83%
- Cash-on-cash
- 1.90%
- DSCR
- 1.08
- GRM
- 10.0
CMA / ARV
- ARV (median comp)
- $61,221
- List price
- $132,900
- Delta
- 117.08%
- Verdict
- OVERPRICED
- Comps
- 4 within 1.0 mi
Projected returns pro-forma
5.84% appreciation · 3.0% rent growth · sell at horizon
- IRR
- 16.5%
- Equity multiple
- 2.10×
- Total profit
- $40,808
- Equity at exit
- $82,197
- IRR
- 16.5%
- Equity multiple
- 4.15×
- Total profit
- $117,346
- Equity at exit
- $147,909
Cash invested: $37,212 (down + closing). Projections, not guarantees.
Landlord ↔ Tenant lean methodology
- Overall (STATE)
- 83 Strongly Landlord-Friendly
- State Iowa
- 83 Strongly Landlord-Friendly · R+6
- County
- — inherits STATE
- City
- — inherits STATE
ZIP-level market 51060
- Home prices YoY
- 4.4%
- Active inventory
- 1
- Price-to-rent
- 10.0×
Monthly cashflow live
- Estimated rent
- $1,105 medium interval (Pro) →
- Mortgage (P&I)
- −$697
- Tax from tax record
- −$61 /mo · $736/yr
- Insurance
- −$55
- HOA
- −$0
- Vacancy / Maint / Mgmt
- −$232
- Net cashflow
- $59
Break-even live
Sensitivity live
| Price | -10% $134 | -5% $97 | +0% $59 | +5% $21 | +10% $-16 |
|---|---|---|---|---|---|
| Rent | -10% $-28 | -5% $15 | +0% $59 | +5% $103 | +10% $146 |
| Rate | -1.0pp $126 | -0.5pp $93 | base $59 | +0.5pp $24 | +1.0pp $-11 |
UW: 25.0% down · 7.5% · 30yr · 1.5% tax · 5.0% vac · 8.0% maint · 8.0% mgmt
Financing live
Cash to close
- Down payment
- $33,225
- Closing costs
- $3,987
- Reserves months
- —
- Total cash needed
- —
Loan-product check · same deal, 3 products live
Conventional
25% down · 7.5% · 30yr
- Down + closing
- —
- Monthly P&I
- —
- Monthly cashflow
- —
- DSCR
- —
- Eligible?
- —
Personal DTI + credit; lowest rate.
DSCR
20% down · 8.5% · 30yr
- Down + closing
- —
- Monthly P&I
- —
- Monthly cashflow
- —
- DSCR
- —
- Eligible?
- —
No personal income docs; deal must DSCR.
Hard money
10% down · 12.0% · 12mo
- Down + closing
- —
- Monthly P&I
- —
- Monthly cashflow
- —
- DSCR
- —
- Eligible?
- —
Short-term bridge; refi at stabilization.
Listing history 27 events
-
2026-06-16days on market $132,900 Active 73 DOM
-
2026-06-15days on market $132,900 Active 72 DOM
-
2026-06-13days on market $132,900 Active 70 DOM
-
2026-06-12days on market $132,900 Active 69 DOM
-
2026-06-09days on market $132,900 Active 66 DOM
-
2026-06-09days on market $132,900 Active 65 DOM
-
2026-06-08days on market $132,900 Active 75 DOM
-
2026-06-07days on market $132,900 Active 74 DOM
-
2026-06-05days on market $132,900 Active 72 DOM
-
2026-06-04days on market $132,900 Active 70 DOM
-
2026-06-02days on market $132,900 Active 69 DOM
-
2026-06-01days on market $132,900 Active 68 DOM
-
2026-05-31days on market $132,900 Active 67 DOM
-
2026-05-31days on market $132,900 Active 66 DOM
-
2026-03-25$132,900 Active 262-char remark
Show marketing remark (262 chars)
This home is spacious and charming. It is full of potential for modernization and customization to make it your own! Built on a large corner lot, there is plenty of room for activities. New roof and siding, with gorgeous hardwood floors. Come fall in love today!
-
2026-02-09status Active
-
2026-01-14price $134,999
-
2025-12-22status Active
-
2025-10-23$135,000 Active
-
2025-09-23price $135,000
-
2025-09-20$135,900 Active
-
2025-09-14$135,000 Active
-
2025-07-25price $142,900
-
2025-06-19$145,000 Active
-
2025-06-19$145,000 Active
-
2003-08-19soldstatus $17,500
ⓘ Source: listings_history table (triggers on properties + properties_extension) + one-shot
backfill from property_details.listing_events for pre-trigger history.
Tax reassessment forecast IA · Partial reset (capped growth)
- Current annual tax
- $736 · $61/mo
- Projected year-2 tax
- $1,411 · $118/mo
- Expected delta
- +$675/yr (+$56/mo · 91.7%)
ⓘ Screening estimate from a state-policy table — verify with the county assessor before closing.
Climate risk First Street
- Flood 1/10 Low FEMA zone X (unshaded) · 0% chance over 30 yrs
- Wildfire 1/10 Low
- Heat 3/10 Moderate 7 d/yr ≥103°F today · 15 d/yr by 30 yrs out
- Wind 2/10 Low
- Air quality 1/10 Low 0 unhealthy d/yr today · 0 by 30 yrs out
Nearby sold comps map
Loading sold comps map…
Walkable amenities ~0.75 mi
Loading nearby amenities…
Taxation est. · year 1
- Rental income
- $13,254
- − Mortgage interest
- −$7,444
- − Property taxes
- −$736
- − Insurance
- −$664
- − Repairs & maintenance
- −$1,060
- − Management
- −$1,060
- − Depreciation
- −$3,866
- Taxable loss
- −$1,577
- Est. tax savings @ 24.0%
- +$379
- After-tax cash flow
- $1,086/yr
For passive investors: Depreciation is non-cash, so a rental often shows a tax loss while cash-flowing — sheltering income. Rental losses are passive: they offset passive income freely, and up to $25,000/yr can offset ordinary (W-2) income if you actively participate and your MAGI is under $100k (phasing out to $0 by $150k); unused losses carry forward. On sale, claimed depreciation is recaptured at up to 25%, and gains may owe capital-gains tax (a 1031 exchange can defer both). Figures are a year-1 estimate at your 24.0% rate — not tax advice; consult a CPA.
Schools (NCES district)
- District
- Charter Oak-Ute Community School District
- NCES district ID
- 1907110
- Math proficiency
- 55% ▼ -15.00%
- Reading proficiency
- 55% ▼ -15.00%
- Median HH income
- $45,522
- Composite
- 48.32/100
- National rank
- #4690
- State rank
- #308 of 330 in IA
Livability — Ute
- Score
- 61/100
- State rank
- #797
- US rank
- #18126
Category grades
Schools grade is shown separately in the Schools card above.
Census & demographics
- Census place
- Ute, IA
- Population (ZIP)
- 529
Population outlook (Monona County) Hauer SSP2
- Today (2025)
- 8,622 people
- By 2030
- 8,419 · -2.4%
- By 2040
- 7,994 · -7.3%
- By 2050
- 7,586 · -12.0%
- By 2075
- 7,204 · -16.4%
- By 2100
- 6,612 · -23.3%
Race, ethnicity, and origin ACS 2023
- Neighborhood character
- Predominantly White (100%)
- Race & ethnicity
- White 100%
- Common ancestry
- Iranian 10% Portuguese 7% Romanian 2%
- Languages at home
- 99% English-only · Spanish 1% German/W. Germanic 1%
Political lean MEDSL · Monona
- 2024 margin
- Solid R (+45.4) · D 26.8% · R 72.2% · Other 1.1%
- 2008→2024 swing
- -43.0pp toward R · 2008: -2.4pp · 2024: -45.4pp
- All cycles
- 2024: R+45.4 2020: R+38.9 2016: R+41.4 2012: R+9.7 2008: R+2.4
Not yet ingested
- Civics
- —
Market trends
- HPI YoY
- ▲ 5.84%
- Current HPI
- 138.1945
- Rent YoY
- —
- Metro
- —
- State GDP YoY
- ▲ 2.48%
- F500 in state
- 4
Industry mix (Fortune 500 HQ in IA)
| Industry | F500 HQs | Revenue |
|---|---|---|
| Financial Services | 1 | $16B |
|
||
| Retail / Convenience | 1 | $15B |
|
||
Price history
+659.4% since first listed13 events — show timeline
- 2026-03-25 Listed $132,900 SWIAR
- 2026-03-25 Listed $132,900 IAR
- 2026-02-09 Relisted — SWIAR
- 2026-01-14 Price Changed $134,999 SWIAR
- 2025-12-22 Relisted — SWIAR
- 2025-10-23 Listed $135,000 SWIAR
- 2025-09-23 Price Changed $135,000 IAR
- 2025-09-20 Listed $135,900 IAR
- 2025-09-14 Listed $135,000 SWIAR
- 2025-07-25 Price Changed $142,900 IAR
- 2025-06-19 Listed $145,000 SWIAR
- 2025-06-19 Listed $145,000 IAR
- 2003-08-19 Sold (Public Records) $17,500 Public Records
Property tax history
+3.5%/yrLatest (2025): $736 · -43.7% YoY. Source: county tax records.
Cash-flow waterfall
monthlySold comps — $/sqft
last 12 mo · ≤1 miLoading sold comps…