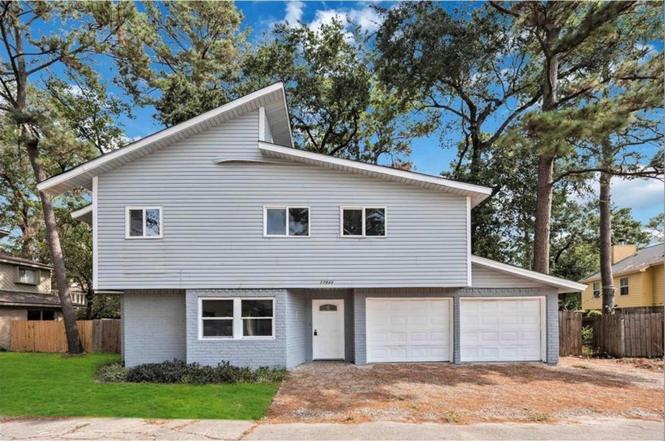
17843 S Cypress Villas Dr · Houston, TX
Flood risk 1/10 · Minimal
- FEMA flood zone
- X (unshaded)
- Chance of flooding over 30 yrs
- 0.0%
- Est. flood insurance / yr
- $507 – $1,088
Fire risk 1/10 · Minimal
- Est. fire insurance / yr
- $1,222 – $2,270
Heat risk 9/10 · Severe
- Hot days now (above 111°F)
- 7 days/yr
- Hot days in 30 yrs
- 23 days/yr
Wind risk 8/10 · Major
- Chance of severe wind over 30 yrs
- 99.0%
Air-quality risk 3/10 · Minor
- Unhealthy air days now
- 3 days/yr
- Unhealthy air days in 30 yrs
- 3 days/yr
Risk factors via First Street. Map © Google.
Why this score? — see what drove the D+ grade
The composite is a weighted blend of 9 inputs, each scored 0–100. Each bar is that input's sub-score; the figure is the points it added to the 100-point composite (weight × sub-score).
- ARV discount +15.0/15.0
- Cash flow +13.3/30.0
- 1% rule +4.8/10.0
- Schools +4.1/10.0
- DSCR +4.0/10.0
- Livability +3.7/5.0
- Condition / age +2.5/5.0
- Rent growth +2.0/5.0
- Appreciation +0.0/10.0
$239,000
🖨 Deal sheet (PDF) 📄 Offer letter ✓ Due diligence
Listing remarks MLS
Stunning 4-bedroom home on a cul-de-sac street. No through traffic, very quiet location. Spacious floor plan full of modern updates! Neutral paint color throughout the home. Brand new and fresh exterior paint job! Updated light fixtures throughout the house. Stainless steel appliances and custom tile backsplash in the kitchen. Spacious bedrooms with updated bathroom vanities. Master bathroom has been upgraded! Huge backyard! Conveniently located to shopping and local retail along with parks and recreation for your enjoyment! Close to major highways and schools!Low tax!!
Key facts
- 7,200 sq ft lot
- Built 1982
- Listed 6 days
Property features AI
Finance
- Other: Seller disclosure available
- HOA & community: Homestead HOA Mgmt; Annual association fee of $550
Exterior
- Utilities: Public water; Public sewer
- Home design: Residential property; Built in 1982; Single-family style (2,306 total living area)
- Construction: Aluminum siding; Composition roof; Slab foundation
- Exterior features: Subdivision lot
Interior
- Bedrooms: Primary bedroom on second level (approx. 16 x 18); Three additional bedrooms on second level (approx. 9 x 10, 9 x 10, 9 x 9)
- Bathrooms: 2 full bathrooms; 1 half bathroom
- Heating & cooling: Central heating (electric); Central air conditioning (electric)
- Interior features: One fireplace; 4 total rooms
Neighborhood map
What this means for you Summary
Snapshot
- This is a 4-bed/2.5-bath single-family listed at $239k.
Deal economics
- At list price, monthly cash flow is $2 ($20/yr) — positive.
- The deal already cash-flows at list — no discount required.
- To meet the 1% rule (rent ≥ 1% of price), the offer needs to be $234k (2.2% below list).
- Recommended offer: $234k (2.2% below list) — sets the bar for 1% rule.
- Cap rate 6.3% vs local median 3.1% in Houston — top-decile yield for the area; either an underpriced asset or a hidden risk that comps aren't pricing in. Stress-test before assuming the spread holds.
Location & tenants
- Location reads 74/100 on livability (#184 in TX, #4,771 nationally) — a middle-class / working-renter tenant base. Strengths: amenities A+, cost of living A+, housing A+; Watch: crime F.
- Klein ISD (suburban): math 41% / reading 48% proficiency, ranked #213 of 826 in TX (top 26%) — families likely to look elsewhere, expect single-tenant / working-renter base with shorter leases.
- Zoned schools: Benfer El (math 39% / reading 49%, grade F, #1,243 of 4,322 statewide, top 29%, 795 students, 66% FRL); Strack Int (math 37% / reading 45%, grade F, #613 of 1,662 statewide, top 38%, 1,196 students, 49% FRL); Klein H S (math 58% / reading 67%, grade B-, #234 of 1,632 statewide, top 14%, 3,352 students, 45% FRL) — zoned schools average 53% FRL vs 37% district-wide (16 pts higher); higher-poverty schools than district average — tighter screening recommended.
- Market conditions: Rents soft (-1.9%/yr); 634 active listings in the ZIP; 8 comparable units currently listed for rent nearby; rentals at typical pace (median 27d on market — plan ~3-4 weeks tenant-placement turnaround); solid renter incomes; 29,883 units permitted in Harris County in 2024 (8,621 in 5+ unit buildings).
Forward outlook
- Local home prices are declining (-3.0%/yr); year-one equity from $2k of loan paydown is wiped out by about $7k of value loss. Plan a longer hold.
- Harris County population projected at +47% by 2050 — long-run rental-demand tailwind backs the buy-and-hold thesis.
Negotiation context
- Only 6 days on market — expect competitive offers; lowballing is unlikely to land.
- 10 sale attempts since 18y ago with the ask held roughly flat each time — persistent listings suggest the price (not the market) is what's stuck; bring a comps-based counter.
Risks & watch-outs
- Climate carrying-cost: severe wind risk, 99% chance of damaging wind over 30y; extreme-heat days projected 7→23/yr by 2055 (HVAC capex compounding) — expect insurance premiums to compound above CPI over the hold.
Questions for the listing agent
- What does the HOA fee cover, when was the last increase, and are there any pending special assessments or reserve-fund shortfalls?
- Is there a deadline driving the sale (1031 exchange, divorce, estate, relocation)? That informs how much negotiation room exists.
- Schools are D-rated, which usually means shorter tenancies and higher turnover. Who's the typical renter profile here, and what's been the actual vacancy rate?
- Crime grade is F in this area — have there been break-ins, vandalism, or insurance claims at this property in the last 3 years? What carrier currently insures it and at what premium?
- The area grade is low — what's the realistic commute time and amenity access for the typical tenant pool here? Any planned neighborhood developments (good or bad) we should know about?
- What's the average days-on-market for RENTAL listings here right now (not sales)? A rising rental-DOM trend means longer vacancies and softer asking-rent achievability than the comps imply.
- What's the recent tenant-quality profile in this submarket — average credit score on applications, eviction rate, late-payment / NSF rate, and stable-employment percentage? A property-management company in the area should have these aggregated.
- How much new for-sale + rental construction is in the pipeline within 1–3 miles? Heavy new supply typically softens prices + rents 12–24 months out; constrained supply supports both.
Investment metrics
- 1% rule
- 0.98% ✗
- Cap rate
- 6.30%
- Cash-on-cash
- 0.03%
- DSCR
- 1.00
- GRM
- 8.5
CMA / ARV
- ARV (on-the-fly)
- $288,250
- Comps found
- 12
Show comp detail 12 sales within ~0.75 mi
| Address | Dist | Beds/Ba | Sqft | Sold | Price | $/sf | Match |
|---|---|---|---|---|---|---|---|
| 4460 W Cypress Villas Dr | 0.09mi | 4/2.5 | 2,405 (+4%) | 3mo | $194,900 | $81 | 86 |
| 17815 S Cypress Villas Dr | 0.05mi | 4/2.5 | 2,460 (+7%) | 2mo | $207,000 | $84 | 84 |
| 5203 Woodville Ln | 0.37mi | 4/2.5 | 2,384 (+3%) | 3mo | $335,000 | $141 | 75 |
| 5207 Woodville Ln | 0.38mi | 4/2.5 | 2,205 (-4%) | 3mo | $310,000 | $141 | 72 |
| 5306 Glenmere Ln | 0.45mi | 4/2.5 | 2,364 (+2%) | 3mo | $297,000 | $126 | 72 |
| 4023 Oxhill Rd | 0.72mi | 4/2.0 | 2,300 (-0%) | 2mo | $245,000 | $107 | 62 |
| 17807 Fireside Dr | 0.38mi | 4/2.5 | 2,048 (-11%) | 2mo | $255,000 | $125 | 61 |
| 17903 Fireside Dr | 0.42mi | 4/2.5 | 2,566 (+11%) | 1mo | $295,000 | $115 | 61 |
| 5511 Lacreek Ln | 0.62mi | 4/2.5 | 2,415 (+5%) | 3mo | $349,900 | $145 | 60 |
| 18018 Cypress Spring Dr | 0.71mi | 4/2.5 | 2,172 (-6%) | 2mo | $255,000 | $117 | 56 |
| 4310 Shady Pine Dr | 0.45mi | 3/3.0 (-1) | 2,106 (-9%) | 4mo | $275,000 | $131 | 54 |
| 18010 Cypress Spring Dr | 0.71mi | 4/2.0 | 2,140 (-7%) | 3mo | $265,000 | $124 | 51 |
Match score weights: distance 35% · size 25% · config 20% · recency 20%. Top-matched comps best support the ARV.
Projected returns pro-forma
-3.0% appreciation · 0.0% rent growth · sell at horizon
- IRR
- -20.0%
- Equity multiple
- 0.32×
- Total profit
- $-45,318
- Equity at exit
- $35,636
- IRR
- -22.6%
- Equity multiple
- 0.03×
- Total profit
- $-65,176
- Equity at exit
- $20,664
Cash invested: $66,920 (down + closing). Projections, not guarantees.
Landlord ↔ Tenant lean methodology
- Overall (STATE)
- 87 Strongly Landlord-Friendly
- State Texas
- 87 Strongly Landlord-Friendly · R+5
- County
- — inherits STATE
- City
- — inherits STATE
ZIP-level market 77379
- Home prices YoY
- -34.7%
- Rents YoY
- -1.9%
- Active inventory
- 634
- Price-to-rent
- 8.5×
Monthly cashflow live
- Estimated rent
- $2,338 high interval (Pro) →
- Mortgage (P&I)
- −$1,253
- Tax from tax record
- −$446 /mo · $5,357/yr
- Insurance
- −$100
- HOA
- −$46
- Vacancy / Maint / Mgmt
- −$491
- Net cashflow
- $2
Break-even live
Sensitivity live
| Price | -10% $137 | -5% $69 | +0% $2 | +5% $-66 | +10% $-134 |
|---|---|---|---|---|---|
| Rent | -10% $-183 | -5% $-91 | +0% $2 | +5% $94 | +10% $186 |
| Rate | -1.0pp $122 | -0.5pp $62 | base $2 | +0.5pp $-60 | +1.0pp $-123 |
UW: 25.0% down · 7.5% · 30yr · 1.5% tax · 5.0% vac · 8.0% maint · 8.0% mgmt
Financing live
Cash to close
- Down payment
- $59,750
- Closing costs
- $7,170
- Reserves months
- —
- Total cash needed
- —
Loan-product check · same deal, 3 products live
Conventional
25% down · 7.5% · 30yr
- Down + closing
- —
- Monthly P&I
- —
- Monthly cashflow
- —
- DSCR
- —
- Eligible?
- —
Personal DTI + credit; lowest rate.
DSCR
20% down · 8.5% · 30yr
- Down + closing
- —
- Monthly P&I
- —
- Monthly cashflow
- —
- DSCR
- —
- Eligible?
- —
No personal income docs; deal must DSCR.
Hard money
10% down · 12.0% · 12mo
- Down + closing
- —
- Monthly P&I
- —
- Monthly cashflow
- —
- DSCR
- —
- Eligible?
- —
Short-term bridge; refi at stabilization.
Rent comps 8 comps
| Address | Beds | Baths | Sqft | Rent | $/sqft | DOM | Units | Dist |
|---|---|---|---|---|---|---|---|---|
| 4822 Lost Oak Dr Spring, TX | 4.0 | 2.0 | 1712 | $2,200 | $1.29 | 45d | 1 | 0.40mi |
| 18011 Tall Cypress Dr Spring, TX | 4.0 | 2.5 | 2824 | $3,120 | $1.10 | 9d | 1 | 0.45mi |
| 4827 Cypressdale Dr Spring, TX | 5.0 | 2.0 | 2244 | $2,300 | $1.02 | 26d | 1 | 0.46mi |
| 17734 Moss Point Dr Spring, TX | 4.0 | 3.5 | 2734 | $2,470 | $0.90 | 17d | 1 | 0.75mi |
| 18620 Louetta Creek Dr Spring, TX | 3.0–4.0 | 2.5–3.0 | 1930 | $2,499 | $1.29 | 14d | 3 | 0.90mi |
| 3906 Postwood Dr Spring, TX | 4.0 | 2.5 | 2211 | $2,045 | $0.92 | 9d | 1 | 0.92mi |
| 3626 Blue Cypress Dr Spring, TX | 3.0 | 2.5 | 1813 | $1,390 | $0.77 | 26d | 1 | 1.12mi |
| 16415 Lapis River Dr Spring, TX | 4.0 | 2.5 | 2804 | $2,500 | $0.89 | 45d | 1 | 1.17mi |
HOA detail
- Monthly dues
- $46 · $552/yr
Listing history 5 events
-
2026-06-21days on market $239,000 Active 6 DOM
-
2026-06-18days on market $239,000 Active 3 DOM
-
2026-06-17days on market $239,000 Active 2 DOM
-
2026-06-15remarks 675-char remark
-
2026-06-15$239,000 Active 1 DOM
ⓘ Source: listings_history table (triggers on properties + properties_extension) + one-shot
backfill from property_details.listing_events for pre-trigger history.
Tax reassessment forecast TX · Resets to sale price
- Current annual tax
- $5,357 · $446/mo
- Projected year-2 tax
- $5,357 · $446/mo
- Expected delta
- $0/yr ($0/mo · 0.0%)
ⓘ Screening estimate from a state-policy table — verify with the county assessor before closing.
Climate risk First Street
- Flood 1/10 Low FEMA zone X (unshaded) · 0% chance over 30 yrs
- Wildfire 1/10 Low
- Heat 9/10 Extreme 7 d/yr ≥111°F today · 23 d/yr by 30 yrs out
- Wind 8/10 Severe 99% chance of damaging wind over 30 yrs
- Air quality 3/10 Moderate 3 unhealthy d/yr today · 3 by 30 yrs out
Nearby sold comps map
Loading sold comps map…
Walkable amenities ~0.75 mi
Loading nearby amenities…
Taxation est. · year 1
- Rental income
- $28,056
- − Mortgage interest
- −$13,388
- − Property taxes
- −$5,357
- − Insurance
- −$1,195
- − Repairs & maintenance
- −$2,244
- − Management
- −$2,244
- − HOA
- −$552
- − Depreciation
- −$6,953
- Taxable loss
- −$3,877
- Est. tax savings @ 24.0%
- +$931
- After-tax cash flow
- $951/yr
For passive investors: Depreciation is non-cash, so a rental often shows a tax loss while cash-flowing — sheltering income. Rental losses are passive: they offset passive income freely, and up to $25,000/yr can offset ordinary (W-2) income if you actively participate and your MAGI is under $100k (phasing out to $0 by $150k); unused losses carry forward. On sale, claimed depreciation is recaptured at up to 25%, and gains may owe capital-gains tax (a 1031 exchange can defer both). Figures are a year-1 estimate at your 24.0% rate — not tax advice; consult a CPA.
Schools (NCES district)
- District
- Klein ISD
- NCES district ID
- 4825740
- Math proficiency
- 41% ▼ -12.00%
- Reading proficiency
- 48% ▼ -3.00%
- Median HH income
- $78,288
- Composite
- 40.91/100
- National rank
- #3615
- State rank
- #213 of 826 in TX
Livability — Houston
- Score
- 74/100
- State rank
- #184
- US rank
- #4771
Category grades
Schools grade is shown separately in the Schools card above.
Census & demographics
- County
- Harris County · 4,702,590 people
- City population
- 3,226,434
- Metro
- Houston-The Woodlands-Sugar Land, TX
- Population (ZIP)
- 85,190
- Household income
- $107,486
- Rent vs Own
- Severe rent burden
- 2220.0
Population outlook (Harris County) Hauer SSP2
- Today (2025)
- 5,571,493 people
- By 2030
- 6,089,821 · +9.3%
- By 2040
- 7,142,806 · +28.2%
- By 2050
- 8,185,864 · +46.9%
- By 2075
- 10,574,329 · +89.8%
- By 2100
- 12,109,958 · +117.4%
Race, ethnicity, and origin ACS 2023
- Neighborhood character
- Diverse neighborhood (Simpson 0.68)
- Race & ethnicity
- White 49% Hispanic / Latino 24% Two or more races 15% Black 11% Asian 11%
- Hispanic origin (detail)
- Mexican 13% Puerto Rican 1% Cuban 1%
- Common ancestry
- Italian 2% Lithuanian 2% Slovak 2%
- Foreign-born
- 19% · Canada, Vietnam, China
- Languages at home
- 71% English-only · Spanish 16% Other Indo-European 5% Other Asian/Pacific 1%
Political lean MEDSL · Harris
- 2024 margin
- Lean D (+5.5) · D 52.0% · R 46.4% · Other 1.6%
- 2008→2024 swing
- +3.9pp toward D · 2008: 1.6pp · 2024: 5.5pp
- All cycles
- 2024: D+5.5 2020: D+13.3 2016: D+12.4 2012: D+0.1 2008: D+1.6
Not yet ingested
- Civics
- —
Market trends
- HPI YoY
- ▼ -116.58%
- Current HPI
- 218.9608
- Rent YoY
- ▼ -1.95%
- Metro
- Houston-The Woodlands-Sugar Land, TX
- State GDP YoY
- ▲ 3.95%
- F500 in state
- 110
Industry mix (Fortune 500 HQ in TX)
| Industry | F500 HQs | Revenue |
|---|---|---|
| Energy | 16 | $1,198B |
|
||
| Technology | 5 | $198B |
|
||
| Engineering / Construction | 4 | $72B |
|
||
| Energy Services | 3 | $60B |
|
||
| Utilities | 3 | $41B |
|
||
| Healthcare | 2 | $330B |
|
||
Price history
+255.7% since first listed29 events — show timeline
- 2026-06-15 Listed $239,000 HARMLS
- 2026-04-29 Listed for Rent $2,300 HARMLS
- 2026-04-13 Sold (Public Records) — Public Records
- 2026-03-14 Rental Removed $2,300 HARMLS
- 2026-01-21 Price Changed $2,300 HARMLS
- 2025-12-12 Listed for Rent $2,400 HARMLS
- 2025-01-07 Rental Removed $2,000 HARMLS
- 2024-12-22 Price Changed $2,000 HARMLS
- 2024-12-18 Listed for Rent $2,200 HARMLS
- 2024-12-16 Listing Removed — HARMLS
- 2024-09-23 Listed $275,000 HARMLS
- 2022-09-13 Sold (Public Records) — Public Records
- 2022-09-09 Sold (MLS) — HARMLS
- 2022-08-25 Pending — HARMLS
- 2022-08-17 Pending — HARMLS
- 2022-08-12 Listed $275,000 HARMLS
- 2022-06-30 Listing Removed — HARMLS
- 2022-05-13 Relisted — HARMLS
- 2022-05-06 Pending — HARMLS
- 2022-05-01 Pending — HARMLS
- 2022-04-20 Price Changed $279,900 HARMLS
- 2022-04-03 Relisted — HARMLS
- 2022-03-21 Pending — HARMLS
- 2022-03-07 Listed $289,900 HARMLS
- 2021-12-07 Sold (Public Records) — Public Records
- 2009-02-09 Sold (MLS) — HARMLS
- 2009-01-06 Listing Removed — HARMLS
- 2008-08-22 Listed $67,200 HARMLS
- 1991-11-20 Sold (Public Records) — Public Records
Property tax history
+4.0%/yrLatest (2025): $5,357 · -5.7% YoY. Source: county tax records.
Cash-flow waterfall
monthlySold comps — $/sqft
last 12 mo · ≤1 miLoading sold comps…