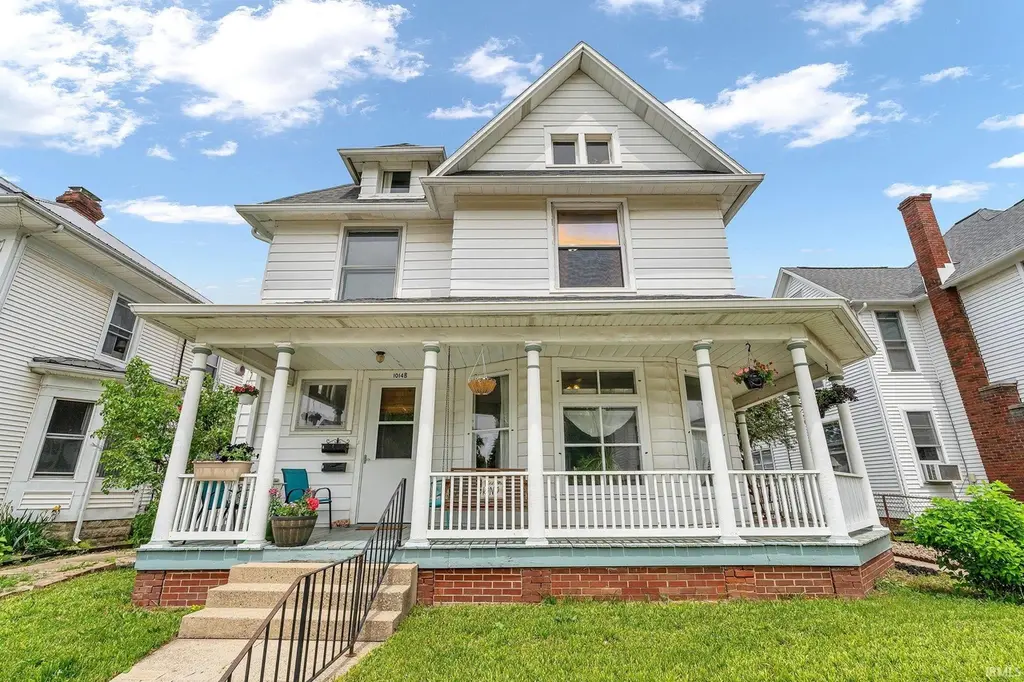
 Duplex
1014 Heath St · Lafayette, IN
Flood risk 1/10 · Minimal
- FEMA flood zone
- X (unshaded)
- Chance of flooding over 30 yrs
- 0.0%
- Est. flood insurance / yr
- $473 – $860
Fire risk 1/10 · Minimal
- Est. fire insurance / yr
- $717 – $1,331
Heat risk 3/10 · Minor
- Hot days now (above 102°F)
- 7 days/yr
- Hot days in 30 yrs
- 18 days/yr
Wind risk 2/10 · Minimal
- Chance of severe wind over 30 yrs
- —
Air-quality risk 2/10 · Minimal
- Unhealthy air days now
- 1 days/yr
- Unhealthy air days in 30 yrs
- 2 days/yr
Risk factors via First Street. Map © Google.
Why this score? — see what drove the D- grade
The composite is a weighted blend of 9 inputs, each scored 0–100. Each bar is that input's sub-score; the figure is the points it added to the 100-point composite (weight × sub-score).
- Cash flow +14.7/30.0
- DSCR +4.5/10.0
- Livability +3.7/5.0
- 1% rule +3.5/10.0
- Rent growth +3.2/5.0
- Schools +2.6/10.0
- Condition / age +2.5/5.0
- ARV discount +0.9/15.0
- Appreciation +0.0/10.0
$259,900
🖨 Deal sheet 📄 Offer letter ✓ Due diligence
Multi-family units
County records classify this as Multi-Family (2-4 Unit). Listing-text estimate: 2 units. confirmed
Listing remarks
Turnkey investment opportunity just minutes from Downtown Lafayette and Purdue University! This well-maintained historic duplex was cared for by an owner-occupant for a number of years. It features approximately 2,800 square feet across two spacious units, both 2 bedrooms and 1 bath each. Fully leased with renewed tenant agreements through July 2027, this property offers immediate, dependable income and a proven rental history. Over the years, the owner has completed numerous quality improvements, including a newer roof, separate utilities, updated kitchens and baths, refinished hardwood floors, multiple HVAC and water heater replacements, and finished third-floor living space. Long-term te
Key facts
- Separate utilities
- Updated baths
- Updated kitchens
Tags
Property features AI
Finance
- Other: Pets allowed; Green energy / efficiency features for HVAC, thermostat, windows and doors; Zoning: B1 (multi-family)
Exterior
- Parking: Garage with door opener; 1 off-street open parking space; On-street parking; Paved parking
- Utilities: Public water; Public sewer
- Home design: Residential income property (duplex); 3 stories
- Construction: Aluminum siding; Shingle roof; Brick/mortar foundation; Built with a full basement and crawl space
- Exterior features: Covered deck; Storm doors; Chain link fenced yard; Level lot
Interior
- Kitchen: Dishwasher; Garbage disposal; Microwave; Range; Refrigerator
- Flooring: Carpet; Concrete; Laminate; Tile; Vinyl
- Bathrooms: 2 full bathrooms
- Heating & cooling: Central air; Ceiling fans; Forced air heating
- Interior features: Walk-in closets; Eat-in kitchen; Entrance foyer; Pantry; Storm windows
- Laundry & utility: Washer hookup; Dryer included; Washer included
Neighborhood map
What this means for you Summary
Snapshot
- This is a 2 × 2-bed/1.0-bath units multifamily listed at $260k.
Deal economics
- At list price, monthly cash flow is $67 ($802/yr) — positive. Per door: $33/mo.
- The deal already cash-flows at list — no discount required.
- To meet the 1% rule (rent ≥ 1% of price), the offer needs to be $221k (15.1% below list).
- Recommended offer: $221k (15.1% below list) — sets the bar for 1% rule.
- Cap rate 6.6% vs local median 4.2% in Lafayette — top-decile yield for the area; either an underpriced asset or a hidden risk that comps aren't pricing in. Stress-test before assuming the spread holds.
Location & tenants
- Location reads 74/100 on livability (#68 in IN, #4,374 nationally) — a middle-class / working-renter tenant base. Strengths: cost of living A+, housing A+, health & safety A+; Watch: amenities D+, employment D+, crime F.
- Lafayette School Corporation (urban): math 29% / reading 34% proficiency, ranked #235 of 301 in IN (top 78%) — families likely to look elsewhere, expect single-tenant / working-renter base with shorter leases; 63% free/reduced lunch — lower-income household profile, screen leases tightly.
- Zoned schools: Thomas Miller Elementary School (math 27% / reading 22%, grade F, #762 of 994 statewide, top 78%, 343 students, 85% FRL); Jefferson High School (math 23% / reading 55%, grade F, #235 of 369 statewide, top 65%, 2,118 students, 69% FRL).
- Market conditions: Rents rising (+2.8%/yr); 73 active listings in the ZIP; 8 comparable units currently listed for rent nearby; rentals at typical pace (median 21d on market — plan ~3-4 weeks tenant-placement turnaround); 1,341 units permitted in Tippecanoe County in 2024 (869 in 5+ unit buildings).
- At $2,206/mo this rent would consume 51% of the median local household income ($52k/yr) (locally 563% of renters already pay >50% of income on rent) — very limited rent-growth headroom before tenants either downsize or default.
Forward outlook
- Local home prices are declining (-3.0%/yr); year-one equity from $2k of loan paydown is wiped out by about $8k of value loss. Plan a longer hold.
- Tippecanoe County population projected at +41% by 2050 — long-run rental-demand tailwind backs the buy-and-hold thesis.
Negotiation context
- Only 11 days on market — expect competitive offers; lowballing is unlikely to land.
Risks & watch-outs
- Watch-outs: built in 1901 — expect roof / HVAC / electrical / plumbing capex.
Questions for the listing agent
- Can we see the unit-by-unit rent roll, current vacancy, and any below-market leases? What's the average tenancy length?
- What capital expenditures (roof, boiler, parking lot, exteriors) have been made in the last 5 years, and what's planned in the next 2?
- Built in 1901 — when were the roof, HVAC, electrical panel, plumbing, and water heater last replaced?
- Is there a deadline driving the sale (1031 exchange, divorce, estate, relocation)? That informs how much negotiation room exists.
- Schools are D-rated, which usually means shorter tenancies and higher turnover. Who's the typical renter profile here, and what's been the actual vacancy rate?
- Crime grade is F in this area — have there been break-ins, vandalism, or insurance claims at this property in the last 3 years? What carrier currently insures it and at what premium?
- The area grade is low — what's the realistic commute time and amenity access for the typical tenant pool here? Any planned neighborhood developments (good or bad) we should know about?
- What's the average days-on-market for RENTAL listings here right now (not sales)? A rising rental-DOM trend means longer vacancies and softer asking-rent achievability than the comps imply.
- What's the recent tenant-quality profile in this submarket — average credit score on applications, eviction rate, late-payment / NSF rate, and stable-employment percentage? A property-management company in the area should have these aggregated.
- How much new apartment / multifamily construction is in the pipeline within 1–3 miles? Heavy new supply (>2% of stock underway) typically softens rents 12–24 months out; light construction supports rent growth.
Investment metrics
- 1% rule
- 0.85% ✗
- Cap rate
- 6.60%
- Cash-on-cash
- 1.10%
- DSCR
- 1.05
- GRM
- 9.8
CMA / ARV
- ARV (on-the-fly)
- $226,848
- Comps found
- 8
Show comp detail 8 sales within ~0.75 mi
| Address | Dist | Beds/Ba | Sqft | Sold | Price | $/sf | Match |
|---|---|---|---|---|---|---|---|
| 620-622 N 11th St | 0.40mi | 5/2.0 (+1) | 2,136 (-4%) | 5mo | $225,000 | $105 | 66 |
| 1826 Wilson St | 0.46mi | 5/2.0 (+1) | 2,108 (-5%) | 2mo | $90,000 | $43 | 63 |
| 910 N 9th St | 0.23mi | 4/3.0 | 1,944 (-13%) | 8mo | $210,000 | $108 | 58 |
| 1109 Elizabeth St | 0.39mi | 4/4.0 | 2,496 (+12%) | 4mo | $250,000 | $100 | 50 |
| 1316 Ferry St | 0.62mi | 4/2.0 | 2,326 (+5%) | 17mo | $245,000 | $105 | 49 |
| 1216 Cincinnati St | 0.43mi | 4/2.0 | 2,024 (-9%) | 24mo | $90,000 | $44 | 45 |
| 1003 Cincinnati St | 0.45mi | 5/3.0 (+1) | 2,458 (+10%) | 17mo | $250,000 | $102 | 38 |
| 425 Asher St Unit one | 0.67mi | 4/2.5 | 2,424 (+9%) | 22mo | $160,000 | $66 | 33 |
Match score weights: distance 35% · size 25% · config 20% · recency 20%. Top-matched comps best support the ARV.
Projected returns pro-forma
-3.0% appreciation · 2.8% rent growth · sell at horizon
- IRR
- -14.8%
- Equity multiple
- 0.47×
- Total profit
- $-38,342
- Equity at exit
- $38,752
- IRR
- -6.5%
- Equity multiple
- 0.59×
- Total profit
- $-29,881
- Equity at exit
- $22,471
Cash invested: $72,772 (down + closing). Projections, not guarantees.
Landlord ↔ Tenant lean methodology
- Overall (STATE)
- 90 Strongly Landlord-Friendly
- State Indiana
- 90 Strongly Landlord-Friendly · R+11
- County
- — inherits STATE
- City
- — inherits STATE
ZIP-level market 47904
- Rents YoY
- 2.8%
- Active inventory
- 73
- Price-to-rent
- 19.6×
Monthly cashflow live
- Estimated rent
- $2,206 high interval (Pro) →
- Mortgage (P&I)
- −$1,363
- Tax from tax record
- −$205 /mo · $2,456/yr
- Insurance
- −$108
- HOA
- −$0
- Vacancy / Maint / Mgmt
- −$463
- Net cashflow
- $67
Break-even live
2-unit breakdown (identical units grouped — click to expand)
| Units | Beds | Baths | Est. rent |
|---|---|---|---|
| 2× units | 2 | 1 | $2,206 |
| #1 | 2 | 1 | $1,103 |
| #2 | 2 | 1 | $1,103 |
| Total (2 units) | $2,206 | ||
UW: 25.0% down · 7.5% · 30yr · 1.5% tax · 5.0% vac · 8.0% maint · 8.0% mgmt
Financing live
Cash to close
- Down payment
- $64,975
- Closing costs
- $7,797
- Reserves months
- —
- Total cash needed
- —
Loan-product check · same deal, 3 products live
Conventional
25% down · 7.5% · 30yr
- Down + closing
- —
- Monthly P&I
- —
- Monthly cashflow
- —
- DSCR
- —
- Eligible?
- —
Personal DTI + credit; lowest rate.
DSCR
20% down · 8.5% · 30yr
- Down + closing
- —
- Monthly P&I
- —
- Monthly cashflow
- —
- DSCR
- —
- Eligible?
- —
No personal income docs; deal must DSCR.
Hard money
10% down · 12.0% · 12mo
- Down + closing
- —
- Monthly P&I
- —
- Monthly cashflow
- —
- DSCR
- —
- Eligible?
- —
Short-term bridge; refi at stabilization.
Rent comps 8 comps
| Address | Beds | Baths | Sqft | Rent | $/sqft | DOM | Units | Dist |
|---|---|---|---|---|---|---|---|---|
| 1038 Heath St Unit 1038 1/2 Lafayette, IN | 4.0 | 2.0 | 1650 | $1,850 | $1.12 | 21d | 1 | 0.03mi |
| 6 S 4th St Lafayette, IN | 1.0–3.0 | 1.0–3.0 | 1102 | $1,649 | $1.50 | 13d | 1 | 0.93mi |
| 270 Littleton St West Lafayette, IN | 4.0 | 1.0–2.5 | 972 | $1,115 | $1.15 | 21d | 1 | 0.97mi |
| 327 N 23rd St Lafayette, IN | 4.0 | 2.5 | 2002 | $1,995 | $1.00 | 13d | 1 | 0.98mi |
| 224 S 14th St Lafayette, IN | 4.0 | 2.0 | 1900 | $1,810 | $0.95 | 13d | 1 | 1.00mi |
| 932 Robinson St West Lafayette, IN | 3.0 | 1.5 | 1944 | $2,800 | $1.44 | 13d | 1 | 1.12mi |
| 2773 PROSPERITY WAY West Lafayette, IN | 3.0 | 2.0 | 1691 | $3,095 | $1.83 | 21d | 1 | 1.23mi |
| 2209 Monon Ave Lafayette, IN | 3.0 | 2.0 | 2200 | $1,650 | $0.75 | 43d | 1 | 1.27mi |
Listing history 10 events
-
2026-06-19days on market $259,900 Active 11 DOM
-
2026-06-18days on market $259,900 Active 10 DOM
-
2026-06-17days on market $259,900 Active 9 DOM
-
2026-06-16days on market $259,900 Active 8 DOM
-
2026-06-15days on market $259,900 Active 7 DOM
-
2026-06-14days on market $259,900 Active 5 DOM
-
2026-06-13days on market $259,900 Active 4 DOM
-
2026-06-10days on market $259,900 Active 2 DOM
-
2026-06-09remarks 699-char remark
-
2026-06-09$259,900 Active 1 DOM
ⓘ Source: listings_history table (triggers on properties + properties_extension) + one-shot
backfill from property_details.listing_events for pre-trigger history.
Tax reassessment forecast IN · Partial reset (capped growth)
- Current annual tax
- $2,456 · $205/mo
- Projected year-2 tax
- $2,456 · $205/mo
- Expected delta
- $0/yr ($0/mo · 0.0%)
ⓘ Screening estimate from a state-policy table — verify with the county assessor before closing.
Climate risk First Street
- Flood 1/10 Low FEMA zone X (unshaded) · 0% chance over 30 yrs
- Wildfire 1/10 Low
- Heat 3/10 Moderate 7 d/yr ≥102°F today · 18 d/yr by 30 yrs out
- Wind 2/10 Low
- Air quality 2/10 Low 1 unhealthy d/yr today · 2 by 30 yrs out
Nearby sold comps map
Loading sold comps map…
Walkable amenities ~0.75 mi
Loading nearby amenities…
Taxation est. · year 1
- Rental income
- $26,472
- − Mortgage interest
- −$14,558
- − Property taxes
- −$2,456
- − Insurance
- −$1,300
- − Repairs & maintenance
- −$2,118
- − Management
- −$2,118
- − Depreciation
- −$7,561
- Taxable loss
- −$3,638
- Est. tax savings @ 24.0%
- +$873
- After-tax cash flow
- $1,675/yr
For passive investors: Depreciation is non-cash, so a rental often shows a tax loss while cash-flowing — sheltering income. Rental losses are passive: they offset passive income freely, and up to $25,000/yr can offset ordinary (W-2) income if you actively participate and your MAGI is under $100k (phasing out to $0 by $150k); unused losses carry forward. On sale, claimed depreciation is recaptured at up to 25%, and gains may owe capital-gains tax (a 1031 exchange can defer both). Figures are a year-1 estimate at your 24.0% rate — not tax advice; consult a CPA.
Schools (NCES district)
- District
- Lafayette School Corporation
- NCES district ID
- 1805400
- Math proficiency
- 29% ▼ -9.00%
- Reading proficiency
- 34% ▼ -7.00%
- Median HH income
- $39,817
- Composite
- 26.46/100
- National rank
- #7217
- State rank
- #235 of 301 in IN
Livability — Lafayette
- Score
- 74/100
- State rank
- #68
- US rank
- #4374
Category grades
Schools grade is shown separately in the Schools card above.
Census & demographics
- Census place
- Lafayette, IN
- County
- Tippecanoe County · 181,820 people
- City population
- 106,622
- Metro
- Lafayette-West Lafayette, IN
- Population (ZIP)
- 16,257
- Household income
- $51,687
- Rent vs Own
- Severe rent burden
- 563.0
Population outlook (Tippecanoe County) Hauer SSP2
- Today (2025)
- 215,327 people
- By 2030
- 232,284 · +7.9%
- By 2040
- 266,517 · +23.8%
- By 2050
- 302,826 · +40.6%
- By 2075
- 394,445 · +83.2%
- By 2100
- 463,500 · +115.3%
Race, ethnicity, and origin ACS 2023
- Neighborhood character
- Predominantly White (73%)
- Race & ethnicity
- White 73% Hispanic / Latino 16% Two or more races 11% Black 5% Asian 1%
- Hispanic origin (detail)
- Mexican 14%
- Common ancestry
- Romanian 3% Lithuanian 1% Iranian 1%
- Foreign-born
- 9% · Canada, China
- Languages at home
- 88% English-only · Spanish 10% Other Asian/Pacific 1%
Political lean MEDSL · Tippecanoe
- 2024 margin
- Toss-up / Even · D 49.0% · R 49.1% · Other 1.9%
- 2008→2024 swing
- -11.8pp toward R · 2008: 11.6pp · 2024: -0.1pp
- All cycles
- 2024: R+0.1 2020: D+0.6 2016: R+5.7 2012: R+3.6 2008: D+11.6
Not yet ingested
- Civics
- —
Market trends
- HPI YoY
- ▼ -147.53%
- Current HPI
- 227.1555
- Rent YoY
- ▲ 2.80%
- Metro
- Lafayette-West Lafayette, IN
- State GDP YoY
- ▲ 2.90%
- F500 in state
- 18
Industry mix (Fortune 500 HQ in IN)
| Industry | F500 HQs | Revenue |
|---|---|---|
| Industrial Machinery | 2 | $37B |
|
||
| Healthcare | 1 | $177B |
|
||
| Pharmaceuticals | 1 | $45B |
|
||
| Metals / Steel | 1 | $18B |
|
||
| Agriculture | 1 | $17B |
|
||
| Packaging | 1 | $12B |
|
||
Price history
1 event — show timeline
- 2026-06-08 Listed $259,900 IRMLS
Property tax history
+7.8%/yrLatest (2024): $2,456 · +19.5% YoY. Source: county tax records.
Cash-flow waterfall
monthlySold comps — $/sqft
last 12 mo · ≤1 miLoading sold comps…