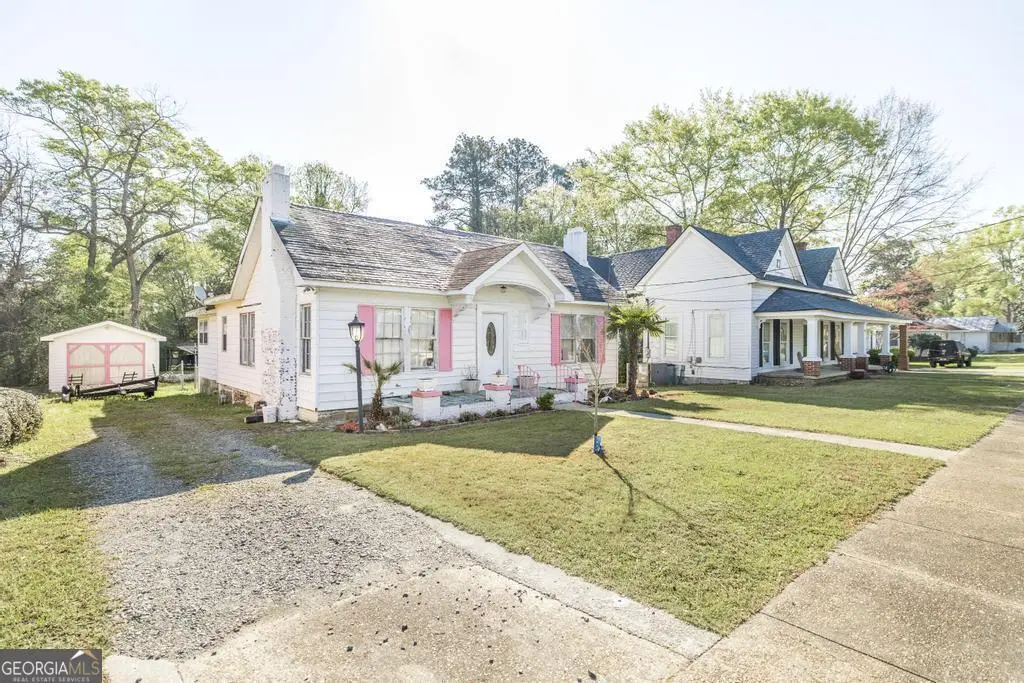
213 West Dr · Dublin, GA
Flood risk 1/10 · Minimal
- FEMA flood zone
- X (unshaded)
- Chance of flooding over 30 yrs
- 0.0%
- Est. flood insurance / yr
- $507 – $1,088
Fire risk 2/10 · Minimal
- Est. fire insurance / yr
- $963 – $1,789
Heat risk 7/10 · Major
- Hot days now (above 109°F)
- 7 days/yr
- Hot days in 30 yrs
- 18 days/yr
Wind risk 8/10 · Major
- Chance of severe wind over 30 yrs
- 80.0%
Air-quality risk 2/10 · Minimal
- Unhealthy air days now
- 1 days/yr
- Unhealthy air days in 30 yrs
- 1 days/yr
Risk factors via First Street. Map © Google.
Why this score? — see what drove the B grade
The composite is a weighted blend of 9 inputs, each scored 0–100. Each bar is that input's sub-score; the figure is the points it added to the 100-point composite (weight × sub-score).
- Cash flow +30.0/30.0
- ARV discount +11.9/15.0
- DSCR +10.0/10.0
- 1% rule +8.7/10.0
- Livability +3.1/5.0
- Rent growth +2.9/5.0
- Condition / age +2.5/5.0
- Schools +1.0/10.0
- Appreciation +0.0/10.0
$115,000
🖨 Deal sheet 📄 Offer letter ✓ Due diligence
Listing remarks MLS
Charming 3-bedroom, 2-bath home offering the perfect blend of comfort and functionality. Will not last long!
Key facts
- 0.25 acre lot
- Built 1940
- Listed 59 days
Neighborhood map
What this means for you Summary
Snapshot
- This is a 3-bed/2.0-bath single-family listed at $115k.
Deal economics
- At list price, monthly cash flow is $450 ($5k/yr) — positive.
- The deal already cash-flows at list — no discount required.
- Meets the 1% rule at list price ($2k rent vs $115k).
- Recommended offer: $112k (3.0% below list) — sets the bar for market timing.
- Cap rate 11.0% vs local median 4.2% in Dublin — top-decile yield for the area; either an underpriced asset or a hidden risk that comps aren't pricing in. Stress-test before assuming the spread holds.
Location & tenants
- Location reads 62/100 on livability (#322 in GA) — a middle-class / working-renter tenant base. Strengths: cost of living A+, housing A; Watch: crime D+, schools F, amenities F.
- Dublin City (town): math 10% / reading 16% proficiency, ranked #165 of 174 in GA (top 95%) — low school quality limits family demand, transient renter base, plan for 1-2y turnover; 78% free/reduced lunch — lower-income household profile, screen leases tightly.
- Market conditions: Rents rising (+1.4%/yr); 218 active listings in the ZIP; 2 comparable units currently listed for rent nearby; 55 units permitted in Laurens County in 2024 (24 in 5+ unit buildings).
- This rent runs 34% of the median local income ($56k/yr) — at the standard rent-burdened threshold; future hikes will face affordability resistance.
Forward outlook
- Local home prices are declining (-3.0%/yr); year-one equity from $795 of loan paydown is wiped out by about $3k of value loss. Plan a longer hold.
- Laurens County population projected at -21% by 2050 — secular population decline; favor cash flow + early exit over multi-decade hold.
- At projected returns (-3.0% appreciation + 1.4% rent growth), your $32k cash investment doubles in ~9 years — after that, you're playing with house money.
Negotiation context
- It's been on market 59 days — a 3% lower offer ($112k) is reasonable based on typical stale-listing flexibility.
Risks & watch-outs
- Watch-outs: built in 1940 — expect roof / HVAC / electrical / plumbing capex.
- Climate carrying-cost: severe wind risk, 80% chance of damaging wind over 30y; extreme-heat days projected 7→18/yr by 2055 (HVAC capex compounding) — expect insurance premiums to compound above CPI over the hold.
Questions for the listing agent
- It's been on market 59 days. Have you received any prior offers? Is the seller open to a 3% concession, seller financing, or rate buy-down credit?
- Built in 1940 — when were the roof, HVAC, electrical panel, plumbing, and water heater last replaced?
- Is there a deadline driving the sale (1031 exchange, divorce, estate, relocation)? That informs how much negotiation room exists.
- Schools are F-rated, which usually means shorter tenancies and higher turnover. Who's the typical renter profile here, and what's been the actual vacancy rate?
- Crime grade is D in this area — have there been break-ins, vandalism, or insurance claims at this property in the last 3 years? What carrier currently insures it and at what premium?
- What's the average days-on-market for RENTAL listings here right now (not sales)? A rising rental-DOM trend means longer vacancies and softer asking-rent achievability than the comps imply.
- What's the recent tenant-quality profile in this submarket — average credit score on applications, eviction rate, late-payment / NSF rate, and stable-employment percentage? A property-management company in the area should have these aggregated.
- How much new for-sale + rental construction is in the pipeline within 1–3 miles? Heavy new supply typically softens prices + rents 12–24 months out; constrained supply supports both.
Investment metrics
- 1% rule
- 1.37% ✓
- Cap rate
- 10.99%
- Cash-on-cash
- 16.76%
- DSCR
- 1.75
- GRM
- 6.1
CMA / ARV
- ARV (median comp)
- $127,397
- List price
- $115,000
- Delta
- -9.73%
- Verdict
- FAIR
- Comps
- 20 within 1.0 mi
Show comp detail 11 sales within ~0.75 mi
| Address | Dist | Beds/Ba | Sqft | Sold | Price | $/sf | Match |
|---|---|---|---|---|---|---|---|
| 809 Highland Ave | 0.19mi | 3/2.0 | 1,497 (-1%) | 18mo | $140,000 | $94 | 75 |
| 913 Druid St | 0.49mi | 3/2.0 | 1,490 (-1%) | 10mo | $120,000 | $81 | 66 |
| 810 Stonewall St | 0.35mi | 3/2.0 | 1,644 (+9%) | 9mo | $135,000 | $82 | 62 |
| 107 Lacross St | 0.47mi | 3/2.0 | 1,429 (-5%) | 11mo | $215,000 | $150 | 60 |
| 1405 Camellia Dr | 0.41mi | 3/3.0 | 1,350 (-10%) | 13mo | $42,000 | $31 | 49 |
| 214 Geneva St | 0.70mi | 3/2.0 | 1,489 (-1%) | 21mo | $184,900 | $124 | 48 |
| 1502 Stonewall St | 0.49mi | 3/1.0 | 1,284 (-15%) | 1mo | $165,000 | $129 | 48 |
| 314 Coney St | 0.45mi | 2/1.5 (-1) | 1,382 (-8%) | 14mo | $135,000 | $98 | 46 |
| 1602 Woodrow Ave | 0.57mi | 3/1.0 | 1,403 (-7%) | 15mo | $136,000 | $97 | 45 |
| 701 N Church St | 0.65mi | 3/2.0 | 1,320 (-12%) | 16mo | $174,900 | $133 | 36 |
| 131 Hillcrest Dr | 0.74mi | 3/1.0 | 1,350 (-10%) | 23mo | $39,000 | $29 | 25 |
Match score weights: distance 35% · size 25% · config 20% · recency 20%. Top-matched comps best support the ARV.
Projected returns pro-forma
-3.0% appreciation · 1.45% rent growth · sell at horizon
- IRR
- 6.2%
- Equity multiple
- 1.24×
- Total profit
- $7,618
- Equity at exit
- $17,147
- IRR
- 14.1%
- Equity multiple
- 2.06×
- Total profit
- $33,997
- Equity at exit
- $9,943
Cash invested: $32,200 (down + closing). Projections, not guarantees.
Landlord ↔ Tenant lean methodology
- Overall (STATE)
- 90 Strongly Landlord-Friendly
- State Georgia
- 90 Strongly Landlord-Friendly · R+3
- County
- — inherits STATE
- City
- — inherits STATE
ZIP-level market 31021
- Home prices YoY
- -18.7%
- Rents YoY
- 1.4%
- Active inventory
- 218
- Price-to-rent
- 6.1×
Monthly cashflow live
- Estimated rent
- $1,575 medium interval (Pro) →
- Mortgage (P&I)
- −$603
- Tax est. 1.5%
- −$144 /mo · $1,725/yr
- Insurance
- −$48
- HOA
- −$0
- Vacancy / Maint / Mgmt
- −$331
- Net cashflow
- $450
Break-even live
UW: 25.0% down · 7.5% · 30yr · 1.5% tax · 5.0% vac · 8.0% maint · 8.0% mgmt
Financing live
Cash to close
- Down payment
- $28,750
- Closing costs
- $3,450
- Reserves months
- —
- Total cash needed
- —
Loan-product check · same deal, 3 products live
Conventional
25% down · 7.5% · 30yr
- Down + closing
- —
- Monthly P&I
- —
- Monthly cashflow
- —
- DSCR
- —
- Eligible?
- —
Personal DTI + credit; lowest rate.
DSCR
20% down · 8.5% · 30yr
- Down + closing
- —
- Monthly P&I
- —
- Monthly cashflow
- —
- DSCR
- —
- Eligible?
- —
No personal income docs; deal must DSCR.
Hard money
10% down · 12.0% · 12mo
- Down + closing
- —
- Monthly P&I
- —
- Monthly cashflow
- —
- DSCR
- —
- Eligible?
- —
Short-term bridge; refi at stabilization.
Rent comps 2 comps
| Address | Beds | Baths | Sqft | Rent | $/sqft | DOM | Units | Dist |
|---|---|---|---|---|---|---|---|---|
| 113 Ramsey St Dublin, GA | 3.0 | 2.0 | 1500 | $1,500 | $1.00 | 43d | 1 | 0.28mi |
| 412 Roberson St Dublin, GA | 4.0 | 3.0 | 2152 | $2,500 | $1.16 | 43d | 1 | 0.72mi |
Listing history 4 events
-
2026-05-18status Under Contract 108-char remark
Show marketing remark (108 chars)
Charming 3-bedroom, 2-bath home offering the perfect blend of comfort and functionality. Will not last long!
-
2026-04-13price $115,000 108-char remark
Show marketing remark (108 chars)
Charming 3-bedroom, 2-bath home offering the perfect blend of comfort and functionality. Will not last long!
-
2026-03-20$125,000 New 108-char remark
Show marketing remark (108 chars)
Charming 3-bedroom, 2-bath home offering the perfect blend of comfort and functionality. Will not last long!
-
2026-03-17historical $125,000 108-char remark
Show marketing remark (108 chars)
Charming 3-bedroom, 2-bath home offering the perfect blend of comfort and functionality. Will not last long!
ⓘ Source: listings_history table (triggers on properties + properties_extension) + one-shot
backfill from property_details.listing_events for pre-trigger history.
Climate risk First Street
- Flood 1/10 Low FEMA zone X (unshaded) · 0% chance over 30 yrs
- Wildfire 2/10 Low
- Heat 7/10 Severe 7 d/yr ≥109°F today · 18 d/yr by 30 yrs out
- Wind 8/10 Severe 80% chance of damaging wind over 30 yrs
- Air quality 2/10 Low 1 unhealthy d/yr today · 1 by 30 yrs out
Nearby sold comps map
Loading sold comps map…
Walkable amenities ~0.75 mi
Loading nearby amenities…
Taxation est. · year 1
- Rental income
- $18,905
- − Mortgage interest
- −$6,442
- − Property taxes
- −$1,725
- − Insurance
- −$575
- − Repairs & maintenance
- −$1,512
- − Management
- −$1,512
- − Depreciation
- −$3,345
- Taxable income
- $3,793
- Est. tax owed @ 24.0%
- −$910
- After-tax cash flow
- $4,488/yr
For passive investors: Depreciation is non-cash, so a rental often shows a tax loss while cash-flowing — sheltering income. Rental losses are passive: they offset passive income freely, and up to $25,000/yr can offset ordinary (W-2) income if you actively participate and your MAGI is under $100k (phasing out to $0 by $150k); unused losses carry forward. On sale, claimed depreciation is recaptured at up to 25%, and gains may owe capital-gains tax (a 1031 exchange can defer both). Figures are a year-1 estimate at your 24.0% rate — not tax advice; consult a CPA.
Schools (NCES district)
- District
- Dublin City
- NCES district ID
- 1301870
- Math proficiency
- 10% ▼ -15.00%
- Reading proficiency
- 16% ▼ -6.00%
- Median HH income
- $29,841
- Composite
- 10.16/100
- National rank
- #9796
- State rank
- #165 of 174 in GA
Livability — Dublin
- Score
- 62/100
- State rank
- #322
- US rank
- #17202
Category grades
Schools grade is shown separately in the Schools card above.
Census & demographics
- Census place
- Dublin, GA
- County
- Laurens County · 28,190 people
- City population
- 28,190
- Metro
- Dublin, GA
- Population (ZIP)
- 28,190
- Household income
- $55,697
- Rent vs Own
- Severe rent burden
- 1279.0
Population outlook (Laurens County) Hauer SSP2
- Today (2025)
- 45,685 people
- By 2030
- 44,056 · -3.6%
- By 2040
- 40,270 · -11.9%
- By 2050
- 36,094 · -21.0%
- By 2075
- 26,275 · -42.5%
- By 2100
- 17,160 · -62.4%
Race, ethnicity, and origin ACS 2023
- Neighborhood character
- Majority White (51%)
- Race & ethnicity
- White 51% Black 45% Asian 1%
- Common ancestry
- Italian 1% Serbian 1%
- Foreign-born
- 2% · Canada
- Languages at home
- 98% English-only · Other Indo-European 1% Spanish 1%
Political lean MEDSL · Laurens
- 2024 margin
- Solid R (+32.7) · D 33.5% · R 66.2%
- 2008→2024 swing
- -11.2pp toward R · 2008: -21.5pp · 2024: -32.7pp
- All cycles
- 2024: R+32.7 2020: R+28.2 2016: R+29.1 2012: R+22.7 2008: R+21.5
Not yet ingested
- Civics
- —
Market trends
- HPI YoY
- ▼ -42.86%
- Current HPI
- 186.3422
- Rent YoY
- ▲ 1.45%
- Metro
- Dublin, GA
- State GDP YoY
- ▲ 2.66%
- F500 in state
- 28
Industry mix (Fortune 500 HQ in GA)
| Industry | F500 HQs | Revenue |
|---|---|---|
| Paper / Packaging | 2 | $29B |
|
||
| Retail | 1 | $160B |
|
||
| Transportation / Logistics | 1 | $91B |
|
||
| Airlines | 1 | $62B |
|
||
| Consumer Goods | 1 | $47B |
|
||
| Utilities | 1 | $25B |
|
||
Price history
-8.0% since first listed4 events — show timeline
- 2026-05-18 Pending — GAMLS
- 2026-04-13 Price Changed $115,000 GAMLS
- 2026-03-20 Listed $125,000 GAMLS
- 2026-03-17 Coming Soon $125,000 GAMLS
Property tax history
+3.7%/yrLatest (2025): $199 · -4.3% YoY. Source: county tax records.
Cash-flow waterfall
monthlySold comps — $/sqft
last 12 mo · ≤1 miLoading sold comps…