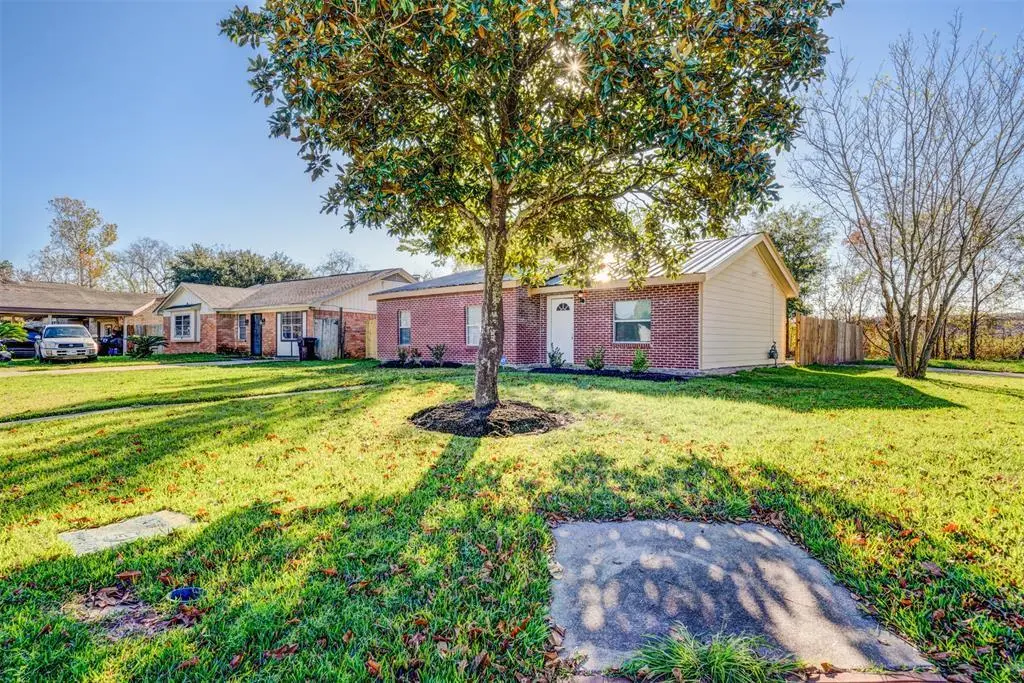
17202 Sunshine St · Sheldon, TX
Flood risk 4/10 · Minor
- FEMA flood zone
- X (unshaded)
- Chance of flooding over 30 yrs
- 0.22%
- Est. flood insurance / yr
- $507 – $1,088
Fire risk 5/10 · Moderate
- Est. fire insurance / yr
- $1,222 – $2,270
Heat risk 9/10 · Severe
- Hot days now (above 109°F)
- 7 days/yr
- Hot days in 30 yrs
- 25 days/yr
Wind risk 9/10 · Severe
- Chance of severe wind over 30 yrs
- 99.0%
Air-quality risk 2/10 · Minimal
- Unhealthy air days now
- 2 days/yr
- Unhealthy air days in 30 yrs
- 2 days/yr
Risk factors via First Street. Map © Google.
Why this score? — see what drove the B- grade
The composite is a weighted blend of 9 inputs, each scored 0–100. Each bar is that input's sub-score; the figure is the points it added to the 100-point composite (weight × sub-score).
- Cash flow +25.7/30.0
- ARV discount +15.0/15.0
- DSCR +8.6/10.0
- 1% rule +6.8/10.0
- Appreciation +4.4/10.0
- Livability +3.3/5.0
- Condition / age +2.5/5.0
- Schools +2.0/10.0
- Rent growth +1.7/5.0
$119,000
🖨 Deal sheet (PDF) 📄 Offer letter ✓ Due diligence
Listing remarks MLS
BEAUTIFUL STARTED HOME IN A QUIET NEIGHBORHOOD, GORGEOUS INTERIORS TOTALLY REMODELED, INCLUDING ALL NEW APPLIANCES, FLOORING, NEW AC UNIT. FRESH PAINTED, NEW CEILING FANS IN ALL ROOMS, NEW LITE FIXTURES, AND NEW CABINETS A TOTAL BEAUTY! NEVER FLOODED AND HAS A LARGE BACK YARD WITH MATURE TREES. NO BACK NEIGHBORS. CLOSED TO SHOPPING CENTERS, MOVIES, EXCELLENT LOCATION.
Key facts
- 6,782 sq ft lot
- Built 2019
- Listed 115 days
Neighborhood map
What this means for you Summary
Snapshot
- This is a 2-bed/1.0-bath single-family listed at $119k.
Deal economics
- At list price, monthly cash flow is $286 ($3k/yr) — positive.
- The deal already cash-flows at list — no discount required.
- Meets the 1% rule at list price ($1k rent vs $119k).
- Recommended offer: $108k (9.0% below list) — sets the bar for market timing.
- Cap rate 9.2% vs local median 4.2% in Sheldon — top-decile yield for the area; either an underpriced asset or a hidden risk that comps aren't pricing in. Stress-test before assuming the spread holds.
Location & tenants
- Location reads 66/100 on livability (#605 in TX) — a middle-class / working-renter tenant base. Strengths: cost of living A+, housing A+, crime B+; Watch: schools F, amenities F, commute F.
- Sheldon ISD (suburban): math 19% / reading 25% proficiency, ranked #746 of 826 in TX (top 90%) — low school quality limits family demand, transient renter base, plan for 1-2y turnover; 72% free/reduced lunch — lower-income household profile, screen leases tightly.
- Market conditions: Rents falling (-3.3%/yr); 159 active listings in the ZIP; 29,883 units permitted in Harris County in 2024 (8,621 in 5+ unit buildings).
Forward outlook
- Local home prices are declining (-1.2%/yr); year-one equity from $823 of loan paydown is wiped out by about $1k of value loss. Plan a longer hold.
- Harris County population projected at +47% by 2050 — long-run rental-demand tailwind backs the buy-and-hold thesis.
Negotiation context
- It's been on market 116 days — a 9% lower offer ($108k) is reasonable based on typical stale-listing flexibility.
- 3 sale attempts since 5y ago; this cycle's ask has dropped $31k (21%) from the opening price — seller is motivated, your offer sets the floor, not the list.
- Current owner paid $30k; list at $119k implies a 303% gain — meaningful room to come down on a strong offer.
Risks & watch-outs
- Climate carrying-cost: severe wind risk, 99% chance of damaging wind over 30y; moderate wildfire risk; extreme-heat days projected 7→25/yr by 2055 (HVAC capex compounding) — expect insurance premiums to compound above CPI over the hold.
Questions for the listing agent
- It's been on market 116 days. Have you received any prior offers? Is the seller open to a 9% concession, seller financing, or rate buy-down credit?
- Why hasn't it sold? Are there any deal-killer items the seller is aware of (foundation, flood, title, zoning, code violations)?
- Is there a deadline driving the sale (1031 exchange, divorce, estate, relocation)? That informs how much negotiation room exists.
- Schools are F-rated, which usually means shorter tenancies and higher turnover. Who's the typical renter profile here, and what's been the actual vacancy rate?
- What's the average days-on-market for RENTAL listings here right now (not sales)? A rising rental-DOM trend means longer vacancies and softer asking-rent achievability than the comps imply.
- What's the recent tenant-quality profile in this submarket — average credit score on applications, eviction rate, late-payment / NSF rate, and stable-employment percentage? A property-management company in the area should have these aggregated.
- How much new for-sale + rental construction is in the pipeline within 1–3 miles? Heavy new supply typically softens prices + rents 12–24 months out; constrained supply supports both.
Investment metrics
- 1% rule
- 1.18% ✓
- Cap rate
- 9.18%
- Cash-on-cash
- 10.31%
- DSCR
- 1.46
- GRM
- 7.1
CMA / ARV
- ARV (median comp)
- $174,835
- List price
- $119,000
- Delta
- -31.94%
- Verdict
- UNDERPRICED
- Comps
- 20 within 1.0 mi
Show comp detail 6 sales within ~0.75 mi
| Address | Dist | Beds/Ba | Sqft | Sold | Price | $/sf | Match |
|---|---|---|---|---|---|---|---|
| 17018 Blairwood Dr | 0.15mi | 2/1.5 | 1,136 (+6%) | 4mo | $160,000 | $141 | 79 |
| 17111 Folsom Dr | 0.16mi | 3/1.5 (+1) | 1,200 (+11%) | 11mo | $195,000 | $163 | 57 |
| 17114 Sunshine St | 0.08mi | 3/1.5 (+1) | 1,238 (+15%) | 10mo | $189,823 | $153 | 56 |
| 16923 Sunshine St | 0.20mi | 3/1.5 (+1) | 1,238 (+15%) | 14mo | $204,987 | $166 | 47 |
| 16907 Argyle Rd | 0.43mi | 3/1.0 (+1) | 1,206 (+12%) | 16mo | $123,000 | $102 | 42 |
| 16919 Faring Rd | 0.32mi | 3/1.5 (+1) | 1,198 (+11%) | 21mo | $149,999 | $125 | 42 |
Match score weights: distance 35% · size 25% · config 20% · recency 20%. Top-matched comps best support the ARV.
Projected returns pro-forma
-1.2% appreciation · 0.0% rent growth · sell at horizon
- IRR
- 2.9%
- Equity multiple
- 1.12×
- Total profit
- $4,090
- Equity at exit
- $27,563
- IRR
- 7.0%
- Equity multiple
- 1.59×
- Total profit
- $19,810
- Equity at exit
- $27,965
Cash invested: $33,320 (down + closing). Projections, not guarantees.
Landlord ↔ Tenant lean methodology
- Overall (STATE)
- 87 Strongly Landlord-Friendly
- State Texas
- 87 Strongly Landlord-Friendly · R+5
- County
- — inherits STATE
- City
- — inherits STATE
ZIP-level market 77049
- Home prices YoY
- -0.5%
- Rents YoY
- -3.3%
- Active inventory
- 159
- Price-to-rent
- 7.1×
Monthly cashflow live
- Estimated rent
- $1,403 medium interval (Pro) →
- Mortgage (P&I)
- −$624
- Tax est. 1.5%
- −$149 /mo · $1,785/yr
- Insurance
- −$50
- HOA
- −$0
- Vacancy / Maint / Mgmt
- −$295
- Net cashflow
- $286
Break-even live
Sensitivity live
| Price | -10% $369 | -5% $327 | +0% $286 | +5% $245 | +10% $204 |
|---|---|---|---|---|---|
| Rent | -10% $175 | -5% $231 | +0% $286 | +5% $342 | +10% $397 |
| Rate | -1.0pp $346 | -0.5pp $317 | base $286 | +0.5pp $255 | +1.0pp $224 |
UW: 25.0% down · 7.5% · 30yr · 1.5% tax · 5.0% vac · 8.0% maint · 8.0% mgmt
Financing live
Cash to close
- Down payment
- $29,750
- Closing costs
- $3,570
- Reserves months
- —
- Total cash needed
- —
Loan-product check · same deal, 3 products live
Conventional
25% down · 7.5% · 30yr
- Down + closing
- —
- Monthly P&I
- —
- Monthly cashflow
- —
- DSCR
- —
- Eligible?
- —
Personal DTI + credit; lowest rate.
DSCR
20% down · 8.5% · 30yr
- Down + closing
- —
- Monthly P&I
- —
- Monthly cashflow
- —
- DSCR
- —
- Eligible?
- —
No personal income docs; deal must DSCR.
Hard money
10% down · 12.0% · 12mo
- Down + closing
- —
- Monthly P&I
- —
- Monthly cashflow
- —
- DSCR
- —
- Eligible?
- —
Short-term bridge; refi at stabilization.
Listing history 35 events
-
2026-06-21days on market $119,000 Active 116 DOM
-
2026-06-18days on market $119,000 Active 113 DOM
-
2026-06-17days on market $119,000 Active 112 DOM
-
2026-06-16days on market $119,000 Active 111 DOM
-
2026-06-15days on market $119,000 Active 110 DOM
-
2026-06-13days on market $119,000 Active 108 DOM
-
2026-06-09days on market $119,000 Active 104 DOM
-
2026-06-08days on market $119,000 Active 103 DOM
-
2026-06-07days on market $119,000 Active 102 DOM
-
2026-06-04days on market $119,000 Active 99 DOM
-
2026-06-03days on market $119,000 Active 98 DOM
-
2026-06-02days on market $119,000 Active 97 DOM
-
2026-06-02price $119,000 Active 96 DOM
-
2026-06-01days on market $130,000 Active 96 DOM
-
2026-05-31days on market $130,000 Active 95 DOM
-
2026-05-14historical
-
2026-04-22price $130,000
-
2026-02-19$149,900 Active
-
2022-08-22soldstatus
-
2022-08-19soldstatus Sold 370-char remark
Show marketing remark (370 chars)
BEAUTIFUL STARTED HOME IN A QUIET NEIGHBORHOOD, GORGEOUS INTERIORS TOTALLY REMODELED, INCLUDING ALL NEW APPLIANCES, FLOORING, NEW AC UNIT. FRESH PAINTED, NEW CEILING FANS IN ALL ROOMS, NEW LITE FIXTURES, AND NEW CABINETS A TOTAL BEAUTY! NEVER FLOODED AND HAS A LARGE BACK YARD WITH MATURE TREES. NO BACK NEIGHBORS. CLOSED TO SHOPPING CENTERS, MOVIES, EXCELLENT LOCATION.
-
2022-07-24status Pending 370-char remark
Show marketing remark (370 chars)
BEAUTIFUL STARTED HOME IN A QUIET NEIGHBORHOOD, GORGEOUS INTERIORS TOTALLY REMODELED, INCLUDING ALL NEW APPLIANCES, FLOORING, NEW AC UNIT. FRESH PAINTED, NEW CEILING FANS IN ALL ROOMS, NEW LITE FIXTURES, AND NEW CABINETS A TOTAL BEAUTY! NEVER FLOODED AND HAS A LARGE BACK YARD WITH MATURE TREES. NO BACK NEIGHBORS. CLOSED TO SHOPPING CENTERS, MOVIES, EXCELLENT LOCATION.
-
2022-07-18status Option Pending 370-char remark
Show marketing remark (370 chars)
BEAUTIFUL STARTED HOME IN A QUIET NEIGHBORHOOD, GORGEOUS INTERIORS TOTALLY REMODELED, INCLUDING ALL NEW APPLIANCES, FLOORING, NEW AC UNIT. FRESH PAINTED, NEW CEILING FANS IN ALL ROOMS, NEW LITE FIXTURES, AND NEW CABINETS A TOTAL BEAUTY! NEVER FLOODED AND HAS A LARGE BACK YARD WITH MATURE TREES. NO BACK NEIGHBORS. CLOSED TO SHOPPING CENTERS, MOVIES, EXCELLENT LOCATION.
-
2022-04-25status Pending 370-char remark
Show marketing remark (370 chars)
BEAUTIFUL STARTED HOME IN A QUIET NEIGHBORHOOD, GORGEOUS INTERIORS TOTALLY REMODELED, INCLUDING ALL NEW APPLIANCES, FLOORING, NEW AC UNIT. FRESH PAINTED, NEW CEILING FANS IN ALL ROOMS, NEW LITE FIXTURES, AND NEW CABINETS A TOTAL BEAUTY! NEVER FLOODED AND HAS A LARGE BACK YARD WITH MATURE TREES. NO BACK NEIGHBORS. CLOSED TO SHOPPING CENTERS, MOVIES, EXCELLENT LOCATION.
-
2022-03-10status Pending, Continue to Show 370-char remark
Show marketing remark (370 chars)
BEAUTIFUL STARTED HOME IN A QUIET NEIGHBORHOOD, GORGEOUS INTERIORS TOTALLY REMODELED, INCLUDING ALL NEW APPLIANCES, FLOORING, NEW AC UNIT. FRESH PAINTED, NEW CEILING FANS IN ALL ROOMS, NEW LITE FIXTURES, AND NEW CABINETS A TOTAL BEAUTY! NEVER FLOODED AND HAS A LARGE BACK YARD WITH MATURE TREES. NO BACK NEIGHBORS. CLOSED TO SHOPPING CENTERS, MOVIES, EXCELLENT LOCATION.
-
2022-01-08$165,900 Active 370-char remark
Show marketing remark (370 chars)
BEAUTIFUL STARTED HOME IN A QUIET NEIGHBORHOOD, GORGEOUS INTERIORS TOTALLY REMODELED, INCLUDING ALL NEW APPLIANCES, FLOORING, NEW AC UNIT. FRESH PAINTED, NEW CEILING FANS IN ALL ROOMS, NEW LITE FIXTURES, AND NEW CABINETS A TOTAL BEAUTY! NEVER FLOODED AND HAS A LARGE BACK YARD WITH MATURE TREES. NO BACK NEIGHBORS. CLOSED TO SHOPPING CENTERS, MOVIES, EXCELLENT LOCATION.
-
2021-09-22soldstatus
-
2021-09-21soldstatus Sold
-
2021-09-08status Pending
-
2021-08-29price $100,000
-
2021-08-22price $117,500
-
2021-08-10$137,500 Active
-
2019-07-05soldstatus
-
2019-07-05soldstatus
-
1993-02-02soldstatus
-
1988-09-01soldstatus $29,500
ⓘ Source: listings_history table (triggers on properties + properties_extension) + one-shot
backfill from property_details.listing_events for pre-trigger history.
Climate risk First Street
- Flood 4/10 Moderate FEMA zone X (unshaded) · 22% chance over 30 yrs
- Wildfire 5/10 Major
- Heat 9/10 Extreme 7 d/yr ≥109°F today · 25 d/yr by 30 yrs out
- Wind 9/10 Extreme 99% chance of damaging wind over 30 yrs
- Air quality 2/10 Low 2 unhealthy d/yr today · 2 by 30 yrs out
Nearby sold comps map
Loading sold comps map…
Walkable amenities ~0.75 mi
Loading nearby amenities…
Taxation est. · year 1
- Rental income
- $16,841
- − Mortgage interest
- −$6,666
- − Property taxes
- −$1,785
- − Insurance
- −$595
- − Repairs & maintenance
- −$1,347
- − Management
- −$1,347
- − Depreciation
- −$3,462
- Taxable income
- $1,638
- Est. tax owed @ 24.0%
- −$393
- After-tax cash flow
- $3,042/yr
For passive investors: Depreciation is non-cash, so a rental often shows a tax loss while cash-flowing — sheltering income. Rental losses are passive: they offset passive income freely, and up to $25,000/yr can offset ordinary (W-2) income if you actively participate and your MAGI is under $100k (phasing out to $0 by $150k); unused losses carry forward. On sale, claimed depreciation is recaptured at up to 25%, and gains may owe capital-gains tax (a 1031 exchange can defer both). Figures are a year-1 estimate at your 24.0% rate — not tax advice; consult a CPA.
Schools (NCES district)
- District
- Sheldon ISD
- NCES district ID
- 4839990
- Math proficiency
- 19% ▼ -18.00%
- Reading proficiency
- 25% ▼ -10.00%
- Median HH income
- $49,443
- Composite
- 19.5/100
- National rank
- #8772
- State rank
- #746 of 826 in TX
Livability — Sheldon
- Score
- 66/100
- State rank
- #605
- US rank
- #11469
Category grades
Schools grade is shown separately in the Schools card above.
Census & demographics
- Census place
- Sheldon, TX
- County
- Harris County · 4,702,590 people
- Metro
- Houston-The Woodlands-Sugar Land, TX
- Population (ZIP)
- 40,418
- Household income
- $62,971
- Rent vs Own
- Severe rent burden
- 993.0
Population outlook (Harris County) Hauer SSP2
- Today (2025)
- 5,571,493 people
- By 2030
- 6,089,821 · +9.3%
- By 2040
- 7,142,806 · +28.2%
- By 2050
- 8,185,864 · +46.9%
- By 2075
- 10,574,329 · +89.8%
- By 2100
- 12,109,958 · +117.4%
Race, ethnicity, and origin ACS 2023
- Neighborhood character
- Predominantly Hispanic (66%)
- Race & ethnicity
- Hispanic / Latino 66% Two or more races 32% Black 19% White 10% Asian 3%
- Hispanic origin (detail)
- Mexican 55%
- Common ancestry
- Lithuanian 1%
- Foreign-born
- 26% · Canada, China, Vietnam
- Languages at home
- 43% English-only · Spanish 54% Other Asian/Pacific 1% Chinese 1%
Political lean MEDSL · Harris
- 2024 margin
- Lean D (+5.5) · D 52.0% · R 46.4% · Other 1.6%
- 2008→2024 swing
- +3.9pp toward D · 2008: 1.6pp · 2024: 5.5pp
- All cycles
- 2024: D+5.5 2020: D+13.3 2016: D+12.4 2012: D+0.1 2008: D+1.6
Not yet ingested
- Civics
- —
Market trends
- HPI YoY
- ▼ -1.20%
- Current HPI
- 248.1111
- Rent YoY
- ▼ -3.31%
- Metro
- Houston-The Woodlands-Sugar Land, TX
- State GDP YoY
- ▲ 3.95%
- F500 in state
- 110
Industry mix (Fortune 500 HQ in TX)
| Industry | F500 HQs | Revenue |
|---|---|---|
| Energy | 16 | $1,198B |
|
||
| Technology | 5 | $198B |
|
||
| Engineering / Construction | 4 | $72B |
|
||
| Energy Services | 3 | $60B |
|
||
| Utilities | 3 | $41B |
|
||
| Healthcare | 2 | $330B |
|
||
Price history
+340.7% since first listed20 events — show timeline
- 2026-05-14 Listing Removed — HARMLS
- 2026-04-22 Price Changed $130,000 HARMLS
- 2026-02-19 Listed $149,900 HARMLS
- 2022-08-22 Sold (Public Records) — Public Records
- 2022-08-19 Sold (MLS) — HARMLS
- 2022-07-24 Pending — HARMLS
- 2022-07-18 Pending — HARMLS
- 2022-04-25 Pending — HARMLS
- 2022-03-10 Pending — HARMLS
- 2022-01-08 Listed $165,900 HARMLS
- 2021-09-22 Sold (Public Records) — Public Records
- 2021-09-21 Sold (MLS) — HARMLS
- 2021-09-08 Pending — HARMLS
- 2021-08-29 Price Changed $100,000 HARMLS
- 2021-08-22 Price Changed $117,500 HARMLS
- 2021-08-10 Listed $137,500 HARMLS
- 2019-07-05 Sold (Public Records) — Public Records
- 2019-07-05 Sold (Public Records) — Public Records
- 1993-02-02 Sold (Public Records) — Public Records
- 1988-09-01 Sold (Public Records) $29,500 Public Records
Property tax history
+11.3%/yrLatest (2025): $8,492 · +8.0% YoY. Source: county tax records.
Cash-flow waterfall
monthlySold comps — $/sqft
last 12 mo · ≤1 miLoading sold comps…