 Duplex
1608 Lucile Ave · Wichita Falls, TX
Flood risk 1/10 · Minimal
- FEMA flood zone
- X (unshaded)
- Chance of flooding over 30 yrs
- 0.0%
- Est. flood insurance / yr
- $507 – $1,088
Fire risk 3/10 · Minor
- Est. fire insurance / yr
- $1,222 – $2,270
Heat risk 7/10 · Major
- Hot days now (above 109°F)
- 7 days/yr
- Hot days in 30 yrs
- 20 days/yr
Wind risk 3/10 · Minor
- Chance of severe wind over 30 yrs
- 7.0%
Air-quality risk 1/10 · Minimal
- Unhealthy air days now
- 0 days/yr
- Unhealthy air days in 30 yrs
- 0 days/yr
Risk factors via First Street. Map © Google.
Why this score? — see what drove the C- grade
The composite is a weighted blend of 9 inputs, each scored 0–100. Each bar is that input's sub-score; the figure is the points it added to the 100-point composite (weight × sub-score).
- Cash flow +20.0/30.0
- ARV discount +7.5/15.0
- DSCR +6.3/10.0
- 1% rule +4.3/10.0
- Rent growth +3.8/5.0
- Livability +3.5/5.0
- Schools +2.7/10.0
- Condition / age +2.5/5.0
- Appreciation +0.0/10.0
$210,000
🖨 Deal sheet 📄 Offer letter ✓ Due diligence
Multi-family units
County records classify this as Multi-Family (2-4 Unit). Listing-text estimate: 2 units. confirmed
Listing remarks MLS
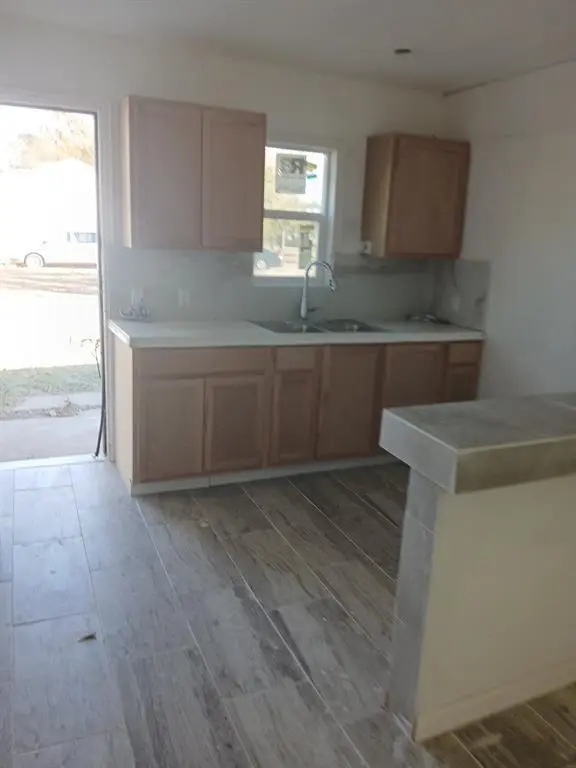
Recent renovation to include roof shingles, flooring, windows, and paint.
Key facts
- Brand-new flooring
- Upgraded finishes
- Full renovation
Tags
Neighborhood map
What this means for you Summary
Snapshot
- This is a 2 × 2-bed/1.0-bath units multifamily listed at $210k.
Deal economics
- At list price, monthly cash flow is $256 ($3k/yr) — positive. Per door: $128/mo.
- The deal already cash-flows at list — no discount required.
- To meet the 1% rule (rent ≥ 1% of price), the offer needs to be $195k (7.0% below list).
- Recommended offer: $185k (12.0% below list) — sets the bar for market timing.
- Cap rate 7.8% vs local median 4.7% in Wichita Falls — top-decile yield for the area; either an underpriced asset or a hidden risk that comps aren't pricing in. Stress-test before assuming the spread holds.
Location & tenants
- Location reads 69/100 on livability (#437 in TX) — a middle-class / working-renter tenant base. Strengths: cost of living A+, housing A+; Watch: health & safety C-, employment D+, schools D.
- Wichita Falls ISD (urban): math 31% / reading 33% proficiency, ranked #585 of 826 in TX (top 71%) — families likely to look elsewhere, expect single-tenant / working-renter base with shorter leases.
- Market conditions: Rents rising fast (+5.3%/yr); 133 active listings in the ZIP; 3 comparable units currently listed for rent nearby; rentals lingering (median 44d on market — plan ~5-8 weeks vacancy on turnover, expect pricing pressure); 100% of comp listings sitting > 30 days — soft ceiling on asking rent; lower-income renter base — watch delinquency; 231 units permitted in Wichita County in 2024 (10 in 5+ unit buildings).
- At $1,954/mo this rent would consume 56% of the median local household income ($42k/yr) (locally 577% of renters already pay >50% of income on rent) — very limited rent-growth headroom before tenants either downsize or default.
Forward outlook
- Local home prices are declining (-3.0%/yr); year-one equity from $1k of loan paydown is wiped out by about $6k of value loss. Plan a longer hold.
- Wichita County population projected to shrink 7% by 2050 — rents likely to lag national; underwrite the cash flow, not the appreciation.
Negotiation context
- It's been on market 200 days — a 12% lower offer ($185k) is reasonable based on typical stale-listing flexibility.
- 3 sale attempts since 3y ago; this cycle's ask is 93% above the opening price — seller raised mid-cycle; expect resistance to lowballs.
Risks & watch-outs
- Watch-outs: built in 1914 — expect roof / HVAC / electrical / plumbing capex.
- Climate carrying-cost: extreme-heat days projected 7→20/yr by 2055 (HVAC capex compounding) — expect insurance premiums to compound above CPI over the hold.
Questions for the listing agent
- It's been on market 200 days. Have you received any prior offers? Is the seller open to a 12% concession, seller financing, or rate buy-down credit?
- Can we see the unit-by-unit rent roll, current vacancy, and any below-market leases? What's the average tenancy length?
- What capital expenditures (roof, boiler, parking lot, exteriors) have been made in the last 5 years, and what's planned in the next 2?
- Built in 1914 — when were the roof, HVAC, electrical panel, plumbing, and water heater last replaced?
- Why hasn't it sold? Are there any deal-killer items the seller is aware of (foundation, flood, title, zoning, code violations)?
- Is there a deadline driving the sale (1031 exchange, divorce, estate, relocation)? That informs how much negotiation room exists.
- Schools are D-rated, which usually means shorter tenancies and higher turnover. Who's the typical renter profile here, and what's been the actual vacancy rate?
- Crime grade is D in this area — have there been break-ins, vandalism, or insurance claims at this property in the last 3 years? What carrier currently insures it and at what premium?
- What's the average days-on-market for RENTAL listings here right now (not sales)? A rising rental-DOM trend means longer vacancies and softer asking-rent achievability than the comps imply.
- What's the recent tenant-quality profile in this submarket — average credit score on applications, eviction rate, late-payment / NSF rate, and stable-employment percentage? A property-management company in the area should have these aggregated.
- How much new apartment / multifamily construction is in the pipeline within 1–3 miles? Heavy new supply (>2% of stock underway) typically softens rents 12–24 months out; light construction supports rent growth.
Investment metrics
- 1% rule
- 0.93% ✗
- Cap rate
- 7.76%
- Cash-on-cash
- 5.23%
- DSCR
- 1.23
- GRM
- 9.0
CMA / ARV
- ARV (median comp)
- $91,387
- List price
- $210,000
- Delta
- 129.79%
- Verdict
- OVERPRICED
- Comps
- 2 within 1.0 mi
Projected returns pro-forma
-3.0% appreciation · 5.27% rent growth · sell at horizon
- IRR
- -5.9%
- Equity multiple
- 0.78×
- Total profit
- $-13,227
- Equity at exit
- $31,312
- IRR
- 6.0%
- Equity multiple
- 1.49×
- Total profit
- $28,813
- Equity at exit
- $18,157
Cash invested: $58,800 (down + closing). Projections, not guarantees.
Landlord ↔ Tenant lean methodology
- Overall (STATE)
- 87 Strongly Landlord-Friendly
- State Texas
- 87 Strongly Landlord-Friendly · R+5
- County
- — inherits STATE
- City
- — inherits STATE
ZIP-level market 76301
- Home prices YoY
- -34.1%
- Rents YoY
- 5.3%
- Active inventory
- 133
- Price-to-rent
- 17.9×
Monthly cashflow live
- Estimated rent
- $1,954 high interval (Pro) →
- Mortgage (P&I)
- −$1,101
- Tax from tax record
- −$99 /mo · $1,186/yr
- Insurance
- −$88
- HOA
- −$0
- Vacancy / Maint / Mgmt
- −$410
- Net cashflow
- $256
Break-even live
2-unit breakdown (identical units grouped — click to expand)
| Units | Beds | Baths | Est. rent |
|---|---|---|---|
| 2× units | 2 | 1 | $1,954 |
| #1 | 2 | 1 | $977 |
| #2 | 2 | 1 | $977 |
| Total (2 units) | $1,954 | ||
UW: 25.0% down · 7.5% · 30yr · 1.5% tax · 5.0% vac · 8.0% maint · 8.0% mgmt
Financing live
Cash to close
- Down payment
- $52,500
- Closing costs
- $6,300
- Reserves months
- —
- Total cash needed
- —
Loan-product check · same deal, 3 products live
Conventional
25% down · 7.5% · 30yr
- Down + closing
- —
- Monthly P&I
- —
- Monthly cashflow
- —
- DSCR
- —
- Eligible?
- —
Personal DTI + credit; lowest rate.
DSCR
20% down · 8.5% · 30yr
- Down + closing
- —
- Monthly P&I
- —
- Monthly cashflow
- —
- DSCR
- —
- Eligible?
- —
No personal income docs; deal must DSCR.
Hard money
10% down · 12.0% · 12mo
- Down + closing
- —
- Monthly P&I
- —
- Monthly cashflow
- —
- DSCR
- —
- Eligible?
- —
Short-term bridge; refi at stabilization.
Rent comps 3 comps
| Address | Beds | Baths | Sqft | Rent | $/sqft | DOM | Units | Dist |
|---|---|---|---|---|---|---|---|---|
| 1714 7th St Wichita Falls, TX | 3.0 | 1.0 | 1452 | $850 | $0.59 | 43d | 1 | 0.73mi |
| 1916 7th St Wichita Falls, TX | 2.0 | 1.0 | 1226 | $1,050 | $0.86 | 43d | 1 | 0.91mi |
| 1507 Polk St Wichita Falls, TX | 3.0 | 1.0 | 1316 | $1,050 | $0.80 | 43d | 1 | 1.16mi |
Listing history 23 events
-
2026-06-19days on market $210,000 Active 200 DOM
-
2026-06-18days on market $210,000 Active 199 DOM
-
2026-06-17days on market $210,000 Active 198 DOM
-
2026-06-16days on market $210,000 Active 197 DOM
-
2026-06-15days on market $210,000 Active 196 DOM
-
2026-06-14days on market $210,000 Active 194 DOM
-
2026-06-13days on market $210,000 Active 193 DOM
-
2026-06-10days on market $210,000 Active 191 DOM
-
2026-06-09days on market $210,000 Active 190 DOM
-
2026-06-08days on market $210,000 Active 189 DOM
-
2026-06-07days on market $210,000 Active 188 DOM
-
2026-06-05days on market $210,000 Active 185 DOM
-
2026-06-02days on market $210,000 Active 183 DOM
-
2026-06-01days on market $210,000 Active 182 DOM
-
2026-05-31days on market $210,000 Active 181 DOM
-
2026-05-30days on market $210,000 Active 180 DOM
-
2026-05-14$109,000 Active 73-char remark
Show marketing remark (73 chars)
Recent renovation to include roof shingles, flooring, windows, and paint.
-
2025-12-01$210,000 Active 934-char remark
Show marketing remark (934 chars)
Discover a beautifully refreshed duplex that’s been thoughtfully reimagined from top to bottom. This property has undergone a full renovation, offering a clean, modern feel throughout both units. From the moment you step inside, you’ll notice the brand-new flooring, fresh interior paint, updated cabinetry, sleek countertops, and upgraded finishes that create a warm and move-in-ready space. Whether you’re searching for a reliable investment property, planning to live in one unit while renting the other, or seeking a turn-key rental opportunity, this duplex checks all the boxes. Each unit delivers comfortable functionality, updated style, and the flexibility today’s buyers and tenants appreciate. Bonus Opportunity: Seller is motivated and open to negotiating a split sale of the duplex. This property is ready for its next chapter — and the opportunity is yours. Let’s make it happen!
-
2023-03-15soldstatus
-
2023-03-10soldstatus
-
2023-02-07$53,000
-
2019-07-12soldstatus
-
2005-12-09soldstatus
ⓘ Source: listings_history table (triggers on properties + properties_extension) + one-shot
backfill from property_details.listing_events for pre-trigger history.
Tax reassessment forecast TX · Resets to sale price
- Current annual tax
- $1,186 · $99/mo
- Projected year-2 tax
- $3,843 · $320/mo
- Expected delta
- +$2,657/yr (+$221/mo · 224.0%)
ⓘ Screening estimate from a state-policy table — verify with the county assessor before closing.
Climate risk First Street
- Flood 1/10 Low FEMA zone X (unshaded) · 0% chance over 30 yrs
- Wildfire 3/10 Moderate
- Heat 7/10 Severe 7 d/yr ≥109°F today · 20 d/yr by 30 yrs out
- Wind 3/10 Moderate 7% chance of damaging wind over 30 yrs
- Air quality 1/10 Low 0 unhealthy d/yr today · 0 by 30 yrs out
Nearby sold comps map
Loading sold comps map…
Walkable amenities ~0.75 mi
Loading nearby amenities…
Taxation est. · year 1
- Rental income
- $23,448
- − Mortgage interest
- −$11,763
- − Property taxes
- −$1,186
- − Insurance
- −$1,050
- − Repairs & maintenance
- −$1,876
- − Management
- −$1,876
- − Depreciation
- −$6,109
- Taxable loss
- −$412
- Est. tax savings @ 24.0%
- +$99
- After-tax cash flow
- $3,172/yr
For passive investors: Depreciation is non-cash, so a rental often shows a tax loss while cash-flowing — sheltering income. Rental losses are passive: they offset passive income freely, and up to $25,000/yr can offset ordinary (W-2) income if you actively participate and your MAGI is under $100k (phasing out to $0 by $150k); unused losses carry forward. On sale, claimed depreciation is recaptured at up to 25%, and gains may owe capital-gains tax (a 1031 exchange can defer both). Figures are a year-1 estimate at your 24.0% rate — not tax advice; consult a CPA.
Schools (NCES district)
- District
- Wichita Falls ISD
- NCES district ID
- 4845780
- Math proficiency
- 31% ▼ -10.00%
- Reading proficiency
- 33% ▼ -7.00%
- Median HH income
- $41,604
- Composite
- 27.06/100
- National rank
- #7051
- State rank
- #585 of 826 in TX
Livability — Wichita Falls
- Score
- 69/100
- State rank
- #437
- US rank
- #8940
Category grades
Schools grade is shown separately in the Schools card above.
Census & demographics
- Census place
- Wichita Falls, TX
- County
- Wichita County · 95,694 people
- City population
- 95,694
- Metro
- Wichita Falls, TX
- Population (ZIP)
- 15,479
- Household income
- $41,947
- Rent vs Own
- Severe rent burden
- 577.0
Population outlook (Wichita County) Hauer SSP2
- Today (2025)
- 129,638 people
- By 2030
- 128,366 · -1.0%
- By 2040
- 124,466 · -4.0%
- By 2050
- 120,499 · -7.0%
- By 2075
- 113,884 · -12.2%
- By 2100
- 101,818 · -21.5%
Race, ethnicity, and origin ACS 2023
- Neighborhood character
- Diverse neighborhood (Simpson 0.67)
- Race & ethnicity
- White 40% Hispanic / Latino 38% Black 18% Two or more races 15% Asian 1%
- Hispanic origin (detail)
- Mexican 36%
- Common ancestry
- Slovak 3% Lithuanian 2% Italian 1%
- Foreign-born
- 11% · Canada, Vietnam
- Languages at home
- 76% English-only · Spanish 22%
Political lean MEDSL · Wichita
- 2024 margin
- Solid R (+44.0) · D 27.5% · R 71.5%
- 2008→2024 swing
- -5.2pp toward R · 2008: -38.9pp · 2024: -44.0pp
- All cycles
- 2024: R+44.0 2020: R+41.1 2016: R+49.7 2012: R+47.1 2008: R+38.9
Not yet ingested
- Civics
- —
Market trends
- HPI YoY
- ▼ -69.89%
- Current HPI
- 135.1511
- Rent YoY
- ▲ 5.27%
- Metro
- Wichita Falls, TX
- State GDP YoY
- ▲ 3.95%
- F500 in state
- 110
Industry mix (Fortune 500 HQ in TX)
| Industry | F500 HQs | Revenue |
|---|---|---|
| Energy | 16 | $1,198B |
|
||
| Technology | 5 | $198B |
|
||
| Engineering / Construction | 4 | $72B |
|
||
| Energy Services | 3 | $60B |
|
||
| Utilities | 3 | $41B |
|
||
| Healthcare | 2 | $330B |
|
||
Price history
+105.7% since first listed7 events — show timeline
- 2026-05-14 Listed $109,000 WFAOR
- 2025-12-01 Listed $210,000 NTREIS
- 2023-03-15 Sold (Public Records) — Public Records
- 2023-03-10 Sold (MLS) — WFAOR
- 2023-02-07 Listed $53,000 WFAOR
- 2019-07-12 Sold (Public Records) — Public Records
- 2005-12-09 Sold (Public Records) — Public Records
Property tax history
-0.8%/yrLatest (2025): $1,186 · -3.3% YoY. Source: county tax records.
Cash-flow waterfall
monthlySold comps — $/sqft
last 12 mo · ≤1 miLoading sold comps…