5926 Dunmire Ave · Jacksonville, FL
Flood risk 1/10 · Minimal
- FEMA flood zone
- X (unshaded)
- Chance of flooding over 30 yrs
- 0.0%
- Est. flood insurance / yr
- $507 – $1,088
Fire risk 4/10 · Minor
- Est. fire insurance / yr
- $947 – $1,759
Heat risk 8/10 · Major
- Hot days now (above 107°F)
- 7 days/yr
- Hot days in 30 yrs
- 19 days/yr
Wind risk 9/10 · Severe
- Chance of severe wind over 30 yrs
- 99.0%
Air-quality risk 4/10 · Minor
- Unhealthy air days now
- 6 days/yr
- Unhealthy air days in 30 yrs
- 6 days/yr
Risk factors via First Street. Map © Google.
Why this score? — see what drove the C+ grade
The composite is a weighted blend of 9 inputs, each scored 0–100. Each bar is that input's sub-score; the figure is the points it added to the 100-point composite (weight × sub-score).
- Cash flow +30.0/30.0
- 1% rule +10.0/10.0
- DSCR +10.0/10.0
- Livability +4.2/5.0
- Schools +3.9/10.0
- Condition / age +2.5/5.0
- Rent growth +2.4/5.0
- ARV discount +0.0/15.0
- Appreciation +0.0/10.0
$87,999
🖨 Deal sheet (PDF) 📄 Offer letter ✓ Due diligence
Listing remarks MLS
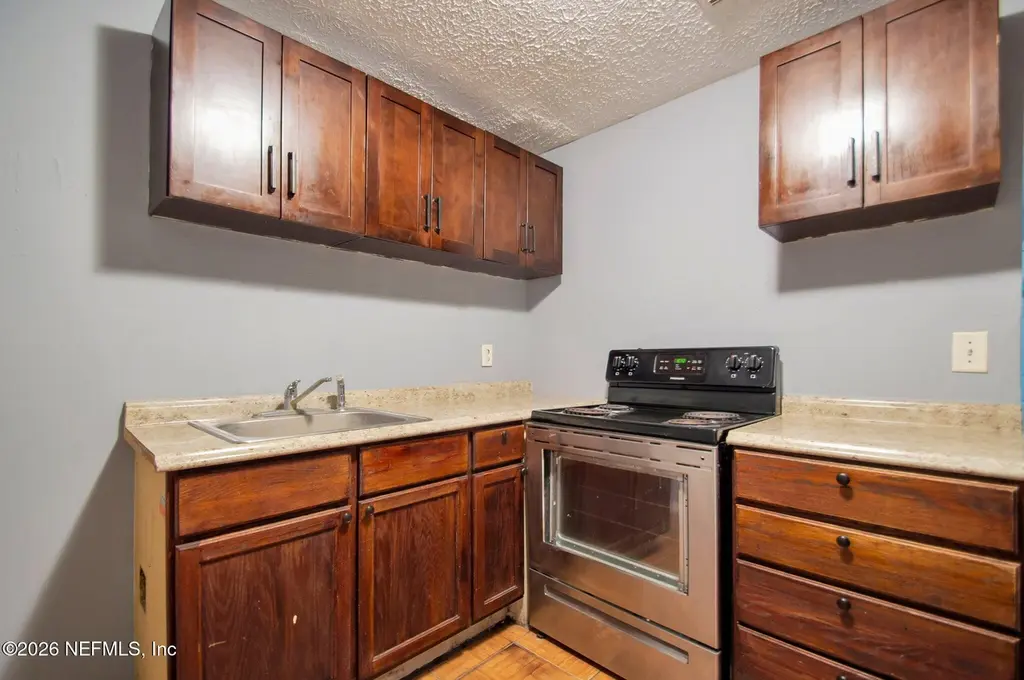
Value-add opportunity! This 3-bedroom, 1-bath home offers strong upside potential with approximately $26K in repairs, making it an excellent option for investors seeking an estimated annual return of 10-12%. The property features a functional layout, a utility room with washer/dryer hookups, additional storage space, and a spacious driveway accommodating up to three vehicles. Major updates include a new A/C (2024) and water heater (2022). Located in a quiet neighborhood with easy access to schools and major roads, with an estimated rental potential of approximately $1,100 per month. Investors welcome. Vacant and easy to show! Bring your offer today!
Key facts
- Utility room
- Cosmetic updates
- New roof
Tags
Property features AI
Finance
- HOA & community: Not a senior community
Exterior
- Parking: Assigned parking
- Utilities: Septic tank; Electricity available; Water available; Asphalt road access
- Home design: Single family residence; One story; Entry level: 1; North-facing
- Construction: Shingle roof
- Exterior features: Front porch; Rear porch; Porch
Interior
- Kitchen: Electric range; Microwave; Refrigerator
- Bedrooms: 3 bedrooms
- Flooring: Tile; Vinyl
- Bathrooms: 1 full bathroom
- Heating & cooling: Central heating; Central air conditioning
- Interior features: In-unit laundry
- Laundry & utility: Washer/Dryer in unit
Neighborhood map
What this means for you Summary
Snapshot
- This is a 3-bed/1.0-bath single-family listed at $88k.
Deal economics
- At list price, monthly cash flow is $566 ($7k/yr) — positive.
- The deal already cash-flows at list — no discount required.
- Meets the 1% rule at list price ($2k rent vs $88k).
- Recommended offer: $87k (1.5% below list) — sets the bar for market timing.
- Cap rate 14.0% vs local median 3.9% in Jacksonville — top-decile yield for the area; either an underpriced asset or a hidden risk that comps aren't pricing in. Stress-test before assuming the spread holds.
Location & tenants
- Location reads 83/100 on livability (#50 in FL, #911 nationally) — a professional / high-income tenant draw. Strengths: amenities A+, commute A+, housing A+.
- Duval (urban): math 46% / reading 45% proficiency, ranked #48 of 73 in FL (top 66%) — families likely to look elsewhere, expect single-tenant / working-renter base with shorter leases.
- Zoned schools: Grasp Academy (math 18% / reading 14%, grade F, #2,130 of 2,144 statewide, top 99%, 271 students, 52% FRL); Jean Ribault Middle School (math 28% / reading 24%, grade F, #506 of 571 statewide, top 89%, 679 students, 78% FRL); Jean Ribault High School (math 22% / reading 25%, grade F, #533 of 667 statewide, top 80%, 1,385 students, 71% FRL) — zoned schools average 67% FRL vs 49% district-wide (17 pts higher); higher-poverty schools than district average — tighter screening recommended.
- Zoned-school proficiency averages 22% at this address vs 46% district-wide (-24 pts) — the specific schools serving this property underperform the Duval average; the district grade overstates school quality for this exact location.
- Market conditions: Rents soft (-0.2%/yr); 549 active listings in the ZIP; 13 comparable units currently listed for rent nearby; rentals at typical pace (median 19d on market — plan ~3-4 weeks tenant-placement turnaround); 6,503 units permitted in Duval County in 2024 (1,131 in 5+ unit buildings).
Forward outlook
- Local home prices are declining (-3.0%/yr); year-one equity from $608 of loan paydown is wiped out by about $3k of value loss. Plan a longer hold.
- Duval County population projected at +19% by 2050 — long-run rental-demand tailwind backs the buy-and-hold thesis.
- At projected returns (-3.0% appreciation + 0.0% rent growth), your $25k cash investment doubles in ~6 years — after that, you're playing with house money.
Negotiation context
- It's been on market 19 days — a 2% lower offer ($87k) is reasonable based on typical stale-listing flexibility.
- 17 sale attempts since 20y ago with the ask held roughly flat each time — persistent listings suggest the price (not the market) is what's stuck; bring a comps-based counter.
Risks & watch-outs
- Climate carrying-cost: severe wind risk, 99% chance of damaging wind over 30y; extreme-heat days projected 7→19/yr by 2055 (HVAC capex compounding) — expect insurance premiums to compound above CPI over the hold.
Questions for the listing agent
- Built in 1967 — when were the roof, HVAC, electrical panel, plumbing, and water heater last replaced?
- Is there a deadline driving the sale (1031 exchange, divorce, estate, relocation)? That informs how much negotiation room exists.
- Schools are B-rated — typically a magnet for longer-tenancy family renters. What's the average tenant stay here, and is there a school-zone premium baked into asking?
- What's the average days-on-market for RENTAL listings here right now (not sales)? A rising rental-DOM trend means longer vacancies and softer asking-rent achievability than the comps imply.
- What's the recent tenant-quality profile in this submarket — average credit score on applications, eviction rate, late-payment / NSF rate, and stable-employment percentage? A property-management company in the area should have these aggregated.
- How much new for-sale + rental construction is in the pipeline within 1–3 miles? Heavy new supply typically softens prices + rents 12–24 months out; constrained supply supports both.
Investment metrics
- 1% rule
- 1.79% ✓
- Cap rate
- 14.02%
- Cash-on-cash
- 27.59%
- DSCR
- 2.23
- GRM
- 4.7
CMA / ARV
- ARV (on-the-fly)
- $63,360
- Comps found
- 1
Show comp detail 1 sale within ~0.75 mi
| Address | Dist | Beds/Ba | Sqft | Sold | Price | $/sf | Match |
|---|---|---|---|---|---|---|---|
| 8139 Pipit Ave | 0.54mi | 2/1.0 (-1) | 858 (+8%) | 1mo | $69,000 | $80 | 56 |
Match score weights: distance 35% · size 25% · config 20% · recency 20%. Top-matched comps best support the ARV.
Projected returns pro-forma
-3.0% appreciation · 0.0% rent growth · sell at horizon
- IRR
- 18.0%
- Equity multiple
- 1.70×
- Total profit
- $17,274
- Equity at exit
- $13,121
- IRR
- 24.1%
- Equity multiple
- 2.78×
- Total profit
- $43,955
- Equity at exit
- $7,609
Cash invested: $24,640 (down + closing). Projections, not guarantees.
Landlord ↔ Tenant lean methodology
- Overall (STATE)
- 87 Strongly Landlord-Friendly
- State Florida
- 87 Strongly Landlord-Friendly · R+3
- County
- — inherits STATE
- City
- — inherits STATE
ZIP-level market 32219
- Home prices YoY
- -22.3%
- Rents YoY
- -0.2%
- Active inventory
- 549
- Price-to-rent
- 4.7×
Monthly cashflow live
- Estimated rent
- $1,572 high interval (Pro) →
- Mortgage (P&I)
- −$461
- Tax from tax record
- −$177 /mo · $2,129/yr
- Insurance
- −$37
- HOA
- −$0
- Vacancy / Maint / Mgmt
- −$330
- Net cashflow
- $566
Break-even live
Sensitivity live
| Price | -10% $616 | -5% $591 | +0% $566 | +5% $542 | +10% $517 |
|---|---|---|---|---|---|
| Rent | -10% $442 | -5% $504 | +0% $566 | +5% $629 | +10% $691 |
| Rate | -1.0pp $611 | -0.5pp $589 | base $566 | +0.5pp $544 | +1.0pp $520 |
UW: 25.0% down · 7.5% · 30yr · 1.5% tax · 5.0% vac · 8.0% maint · 8.0% mgmt
Financing live
Cash to close
- Down payment
- $22,000
- Closing costs
- $2,640
- Reserves months
- —
- Total cash needed
- —
Loan-product check · same deal, 3 products live
Conventional
25% down · 7.5% · 30yr
- Down + closing
- —
- Monthly P&I
- —
- Monthly cashflow
- —
- DSCR
- —
- Eligible?
- —
Personal DTI + credit; lowest rate.
DSCR
20% down · 8.5% · 30yr
- Down + closing
- —
- Monthly P&I
- —
- Monthly cashflow
- —
- DSCR
- —
- Eligible?
- —
No personal income docs; deal must DSCR.
Hard money
10% down · 12.0% · 12mo
- Down + closing
- —
- Monthly P&I
- —
- Monthly cashflow
- —
- DSCR
- —
- Eligible?
- —
Short-term bridge; refi at stabilization.
Rent comps 13 comps
| Address | Beds | Baths | Sqft | Rent | $/sqft | DOM | Units | Dist |
|---|---|---|---|---|---|---|---|---|
| 7623 John F Kennedy Dr E Jacksonville, FL | 3.0 | 1.5 | 1008 | $1,501 | $1.49 | 25d | 1 | 0.16mi |
| 8119 Siskin Ave Jacksonville, FL | 2.0 | 2.0 | 1102 | $1,650 | $1.50 | 25d | 1 | 0.46mi |
| 8119 Siskin Ave Jacksonville, FL | 2.0 | 2.0 | 1102 | $1,650 | $1.50 | 19d | 1 | 0.46mi |
| 7860 Rondo Ave Jacksonville, FL | 3.0 | 2.0 | 1064 | $1,410 | $1.33 | 9d | 1 | 0.62mi |
| 9206 Greenleaf Rd Jacksonville, FL | 3.0 | 1.5 | 888 | $1,400 | $1.58 | 19d | 1 | 0.91mi |
| 6718 Gaspar Cir W Jacksonville, FL | 3.0 | 2.0 | 1068 | $1,305 | $1.22 | 25d | 1 | 1.00mi |
| 6705 Gaspar Cir E Jacksonville, FL | 3.0 | 1.5 | 1116 | $1,254 | $1.12 | 19d | 1 | 1.01mi |
| 4935 Portsmouth Ave Jacksonville, FL | 3.0 | 1.0 | 894 | $1,163 | $1.30 | 12d | 1 | 1.21mi |
| 4655 Ken Knight Dr N Jacksonville, FL | 2.0 | 1.0 | 646 | $600 | $0.93 | 25d | 1 | 1.30mi |
| 9436 Gisborne Dr Jacksonville, FL | 3.0 | 1.5 | 950 | $1,440 | $1.52 | 22d | 1 | 1.31mi |
| 4543 Moncrief Rd W Jacksonville, FL | 2.0 | 1.0 | 950 | $1,075 | $1.13 | 9d | 1 | 1.33mi |
| 4440 Ken Knight Dr N Jacksonville, FL | 2.0 | 1.0 | 716 | $650 | $0.91 | 16d | 1 | 1.45mi |
| 9348 Culpeper Ave Jacksonville, FL | 3.0 | 1.0 | 882 | $1,195 | $1.35 | 25d | 1 | 1.50mi |
Listing history 13 events
-
2026-06-21days on market $87,999 Active 19 DOM
-
2026-06-18days on market $87,999 Active 16 DOM
-
2026-06-17days on market $87,999 Active 15 DOM
-
2026-06-16days on market $87,999 Active 14 DOM
-
2026-06-15days on market $87,999 Active 13 DOM
-
2026-06-13days on market $87,999 Active 11 DOM
-
2026-06-13days on market $87,999 Active 10 DOM
-
2026-06-10days on market $87,999 Active 7 DOM
-
2026-06-08days on market $87,999 Active 6 DOM
-
2026-06-07days on market $87,999 Active 5 DOM
-
2026-06-05days on market $87,999 Active 2 DOM
-
2026-06-02remarks 699-char remark
-
2026-06-02$87,999 Active 1 DOM
ⓘ Source: listings_history table (triggers on properties + properties_extension) + one-shot
backfill from property_details.listing_events for pre-trigger history.
Tax reassessment forecast FL · Resets to sale price
- Current annual tax
- $2,129 · $177/mo
- Projected year-2 tax
- $2,129 · $177/mo
- Expected delta
- $0/yr ($0/mo · 0.0%)
ⓘ Screening estimate from a state-policy table — verify with the county assessor before closing.
Climate risk First Street
- Flood 1/10 Low FEMA zone X (unshaded) · 0% chance over 30 yrs
- Wildfire 4/10 Moderate
- Heat 8/10 Severe 7 d/yr ≥107°F today · 19 d/yr by 30 yrs out
- Wind 9/10 Extreme 99% chance of damaging wind over 30 yrs
- Air quality 4/10 Moderate 6 unhealthy d/yr today · 6 by 30 yrs out
Nearby sold comps map
Loading sold comps map…
Walkable amenities ~0.75 mi
Loading nearby amenities…
Taxation est. · year 1
- Rental income
- $18,866
- − Mortgage interest
- −$4,929
- − Property taxes
- −$2,129
- − Insurance
- −$440
- − Repairs & maintenance
- −$1,509
- − Management
- −$1,509
- − Depreciation
- −$2,560
- Taxable income
- $5,789
- Est. tax owed @ 24.0%
- −$1,389
- After-tax cash flow
- $5,408/yr
For passive investors: Depreciation is non-cash, so a rental often shows a tax loss while cash-flowing — sheltering income. Rental losses are passive: they offset passive income freely, and up to $25,000/yr can offset ordinary (W-2) income if you actively participate and your MAGI is under $100k (phasing out to $0 by $150k); unused losses carry forward. On sale, claimed depreciation is recaptured at up to 25%, and gains may owe capital-gains tax (a 1031 exchange can defer both). Figures are a year-1 estimate at your 24.0% rate — not tax advice; consult a CPA.
Schools (NCES district)
- District
- Duval
- NCES district ID
- 1200480
- Math proficiency
- 46% ▼ -11.00%
- Reading proficiency
- 45% ▼ -4.00%
- Median HH income
- $48,987
- Composite
- 38.97/100
- National rank
- #4076
- State rank
- #48 of 73 in FL
Livability — Jacksonville
- Score
- 83/100
- State rank
- #50
- US rank
- #911
Category grades
Schools grade is shown separately in the Schools card above.
Census & demographics
- Census place
- Jacksonville, FL
- County
- Duval County · 1,015,274 people
- City population
- 979,034
- Metro
- Jacksonville, FL
- Population (ZIP)
- 14,302
- Household income
- $72,184
- Rent vs Own
- Severe rent burden
- 173.0
Population outlook (Duval County) Hauer SSP2
- Today (2025)
- 1,013,010 people
- By 2030
- 1,059,228 · +4.6%
- By 2040
- 1,141,439 · +12.7%
- By 2050
- 1,205,258 · +19.0%
- By 2075
- 1,324,282 · +30.7%
- By 2100
- 1,319,620 · +30.3%
Race, ethnicity, and origin ACS 2023
- Neighborhood character
- Majority Black (55%)
- Race & ethnicity
- Black 55% White 39% Hispanic / Latino 4% Two or more races 3%
- Common ancestry
- Italian 2% Romanian 1% Hispanic 1%
- Foreign-born
- 4% · Canada, Jamaica
- Languages at home
- 95% English-only · Spanish 3% French/Haitian/Cajun 0%
Political lean MEDSL · Duval
- 2024 margin
- Toss-up / Even · D 48.7% · R 50.1% · Other 1.2%
- 2008→2024 swing
- +0.4pp no change · 2008: -1.9pp · 2024: -1.5pp
- All cycles
- 2024: R+1.5 2020: D+3.8 2016: R+1.5 2012: R+3.6 2008: R+1.9
Not yet ingested
- Civics
- —
Market trends
- HPI YoY
- ▼ -75.90%
- Current HPI
- 263.8901
- Rent YoY
- ▼ -0.25%
- Metro
- Jacksonville, FL
- State GDP YoY
- ▲ 3.28%
- F500 in state
- 36
Industry mix (Fortune 500 HQ in FL)
| Industry | F500 HQs | Revenue |
|---|---|---|
| Industrial Technology | 2 | $29B |
|
||
| Insurance | 2 | $17B |
|
||
| Retail | 1 | $60B |
|
||
| Technology Distribution | 1 | $58B |
|
||
| Homebuilding | 1 | $35B |
|
||
| Technology Manufacturing | 1 | $35B |
|
||
Price history
+1000.0% since first listed49 events — show timeline
- 2026-06-01 Listed $87,999 realMLS
- 2026-03-25 Relisted — realMLS
- 2026-03-05 Pending — realMLS
- 2026-03-05 Listing Removed — realMLS
- 2026-02-23 Relisted — realMLS
- 2026-01-19 Pending — realMLS
- 2026-01-19 Relisted — realMLS
- 2026-01-16 Pending — realMLS
- 2025-11-28 Price Changed $90,000 realMLS
- 2025-10-13 Relisted — realMLS
- 2025-10-04 Listing Removed — realMLS
- 2025-07-25 Price Changed $95,000 realMLS
- 2025-06-30 Listed $110,000 realMLS
- 2025-06-24 Listing Removed — realMLS
- 2025-05-23 Price Changed $110,000 realMLS
- 2025-05-23 Relisted — realMLS
- 2025-05-16 Listing Removed — realMLS
- 2025-04-28 Relisted — realMLS
- 2025-04-24 Listing Removed — realMLS
- 2025-04-14 Price Changed $115,000 realMLS
- 2025-02-14 Price Changed $118,000 realMLS
- 2024-10-24 Listed $127,000 realMLS
- 2024-06-22 Rental Removed $1,200 BUILDIUM
- 2024-06-12 Price Changed $1,200 BUILDIUM
- 2024-05-14 Listed for Rent $1,250 BUILDIUM
- 2021-05-03 Sold (Public Records) $94,000 Public Records
- 2021-04-16 Sold (MLS) $94,000 realMLS
- 2021-03-25 Pending — realMLS
- 2021-03-15 Relisted — realMLS
- 2021-03-05 Listing Removed — realMLS
- 2021-03-01 Listed $102,000 realMLS
- 2021-01-28 Sold (MLS) $62,000 realMLS
- 2021-01-27 Sold (Public Records) $62,000 Public Records
- 2020-12-31 Pending — realMLS
- 2020-12-09 Price Changed $75,000 realMLS
- 2020-11-12 Relisted — realMLS
- 2020-10-30 Pending — realMLS
- 2020-10-28 Price Changed $79,500 realMLS
- 2020-10-04 Listed $85,000 realMLS
- 2017-03-22 Sold (MLS) $26,000 realMLS
- 2017-03-08 Pending — realMLS
- 2017-03-07 Contingent — realMLS
- 2017-02-21 Listed $29,000 realMLS
- 2011-06-10 Sold (MLS) $8,500 realMLS
- 2010-08-02 Listed $9,900 realMLS
- 2006-07-25 Listing Removed — realMLS
- 2006-07-19 Sold (MLS) $26,500 realMLS
- 2006-06-09 Listed $29,900 realMLS
- 1982-01-01 Sold (Public Records) $8,000 Public Records
Property tax history
+10.8%/yrLatest (2025): $2,129 · +11.3% YoY. Source: county tax records.
Cash-flow waterfall
monthlySold comps — $/sqft
last 12 mo · ≤1 miLoading sold comps…