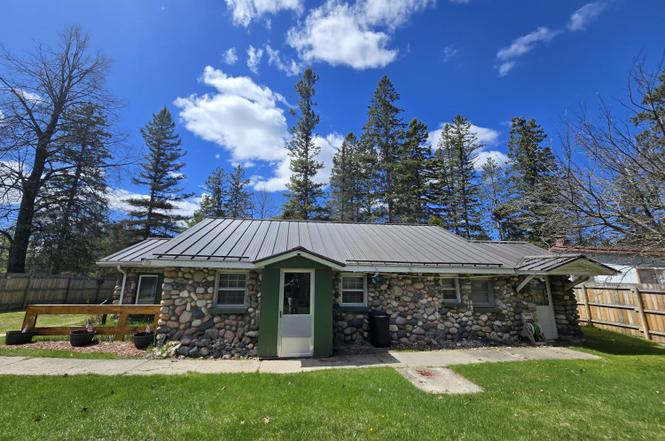
9141 M 33 · Avery, MI
Flood risk 1/10 · Minimal
- FEMA flood zone
- —
- Chance of flooding over 30 yrs
- 0.0%
- Est. flood insurance / yr
- —
Fire risk 3/10 · Minor
- Est. fire insurance / yr
- $784 – $1,456
Heat risk 1/10 · Minimal
- Hot days now (above 95°F)
- 7 days/yr
- Hot days in 30 yrs
- 13 days/yr
Wind risk 1/10 · Minimal
- Chance of severe wind over 30 yrs
- —
Air-quality risk 1/10 · Minimal
- Unhealthy air days now
- 0 days/yr
- Unhealthy air days in 30 yrs
- 0 days/yr
Risk factors via First Street. Map © Google.
Why this score? — see what drove the B grade
The composite is a weighted blend of 9 inputs, each scored 0–100. Each bar is that input's sub-score; the figure is the points it added to the 100-point composite (weight × sub-score).
- Cash flow +25.3/30.0
- ARV discount +14.6/15.0
- Appreciation +10.0/10.0
- DSCR +8.3/10.0
- 1% rule +5.3/10.0
- Schools +2.8/10.0
- Rent growth +2.5/5.0
- Livability +2.5/5.0
- Condition / age +2.5/5.0
$132,900
🖨 Deal sheet 📄 Offer letter ✓ Due diligence
Listing remarks
Atlanta Area. .. Neat and clean ''Up North'' getaway or year-round home. This 2-bedroom, 1-bath cut-stone home/cottage features a knotty pine interior, vaulted ceiling, skylights, and newer appliances, which are included. Recent upgrades include a standing-seam metal roof, 200-amp service, and a gas fireplace. The property also features a artesian well, and a detached finished garage with kitchenette and sleeping quarters; additionally, a future toilet and/or bathroom is already ''stubbed'' . The fenced parcel includes fruit trees and is conveniently located on State Highway M33, just south of M32, near the Thunder Bay River. * * * All information herein is deemed accurate but is not warr
Key facts
- Knotty pine interior
- Vaulted ceiling
- Gas fireplace
Tags
Property features AI
Exterior
- Parking: Detached heated garage; Approximately 1.5 garage spaces
- Utilities: Well water; Septic tank; Cable available
- Home design: Single-family residence; Residential property
- Construction: Slab foundation
- Exterior features: Guest house; Paved road access; Lot approximately 0.41 acres (85 x 213)
Interior
- Kitchen: Oven; Range; Refrigerator
- Bathrooms: 1 full bathroom
- Heating & cooling: Electric heating; Propane heating; Space heater
- Interior features: Vaulted ceilings; Fireplace
- Laundry & utility: Washer; Dryer; Main-level laundry
Neighborhood map
What this means for you Summary
Snapshot
- This is a 2-bed/1.0-bath single-family listed at $133k.
Deal economics
- At list price, monthly cash flow is $303 ($4k/yr) — positive.
- The deal already cash-flows at list — no discount required.
- Meets the 1% rule at list price ($1k rent vs $133k).
- Recommended offer: $129k (3.0% below list) — sets the bar for market timing.
Location & tenants
- Location reads: area grade B — affects rentability + tenant quality, not the cash-flow math above.
- Atlanta Community Schools (rural): math 25% / reading 35% proficiency, ranked #546 of 760 in MI (top 72%) — families likely to look elsewhere, expect single-tenant / working-renter base with shorter leases.
- Market conditions: 56 active listings in the ZIP.
Forward outlook
- In year one you build about $14k of equity ($919 loan paydown + $13k appreciation (10.0% local appreciation)).
- Montmorency County population projected at -38% by 2050 — secular population decline; favor cash flow + early exit over multi-decade hold.
- At projected returns (10.0% appreciation + 3.0% rent growth), your $37k cash investment doubles in ~2 years — after that, you're playing with house money.
- By year 3, paydown + projected appreciation supports a ~$36k cash-out refi (75% LTV) — recoverable capital for the next deal without selling this one.
Negotiation context
- It's been on market 45 days — a 3% lower offer ($129k) is reasonable based on typical stale-listing flexibility.
- 6 sale attempts since 2y ago with the ask held roughly flat each time — persistent listings suggest the price (not the market) is what's stuck; bring a comps-based counter.
- Current owner paid $60k; list at $133k implies a 122% gain — meaningful room to come down on a strong offer.
Questions for the listing agent
- It's been on market 45 days. Have you received any prior offers? Is the seller open to a 3% concession, seller financing, or rate buy-down credit?
- Is there a deadline driving the sale (1031 exchange, divorce, estate, relocation)? That informs how much negotiation room exists.
- What's the average days-on-market for RENTAL listings here right now (not sales)? A rising rental-DOM trend means longer vacancies and softer asking-rent achievability than the comps imply.
- What's the recent tenant-quality profile in this submarket — average credit score on applications, eviction rate, late-payment / NSF rate, and stable-employment percentage? A property-management company in the area should have these aggregated.
- How much new for-sale + rental construction is in the pipeline within 1–3 miles? Heavy new supply typically softens prices + rents 12–24 months out; constrained supply supports both.
Investment metrics
- 1% rule
- 1.03% ✓
- Cap rate
- 9.03%
- Cash-on-cash
- 9.77%
- DSCR
- 1.43
- GRM
- 8.1
CMA / ARV
- ARV (median comp)
- $157,955
- List price
- $132,900
- Delta
- -15.86%
- Verdict
- UNDERPRICED
- Comps
- 6 within 2.0 mi
Projected returns pro-forma
10.0% appreciation · 3.0% rent growth · sell at horizon
- IRR
- 31.4%
- Equity multiple
- 3.46×
- Total profit
- $91,604
- Equity at exit
- $119,727
- IRR
- 27.1%
- Equity multiple
- 7.84×
- Total profit
- $254,455
- Equity at exit
- $258,195
Cash invested: $37,212 (down + closing). Projections, not guarantees.
Landlord ↔ Tenant lean methodology
- Overall (STATE)
- 62 Landlord-Friendly
- State Michigan
- 62 Landlord-Friendly · EVEN
- County
- — inherits STATE
- City
- — inherits STATE
ZIP-level market 49709
- Home prices YoY
- 13.5%
- Active inventory
- 56
- Price-to-rent
- 8.1×
Monthly cashflow live
- Estimated rent
- $1,364 medium interval (Pro) →
- Mortgage (P&I)
- −$697
- Tax from tax record
- −$23 /mo · $273/yr
- Insurance
- −$55
- HOA
- −$0
- Vacancy / Maint / Mgmt
- −$287
- Net cashflow
- $303
Break-even live
UW: 25.0% down · 7.5% · 30yr · 1.5% tax · 5.0% vac · 8.0% maint · 8.0% mgmt
Financing live
Cash to close
- Down payment
- $33,225
- Closing costs
- $3,987
- Reserves months
- —
- Total cash needed
- —
Loan-product check · same deal, 3 products live
Conventional
25% down · 7.5% · 30yr
- Down + closing
- —
- Monthly P&I
- —
- Monthly cashflow
- —
- DSCR
- —
- Eligible?
- —
Personal DTI + credit; lowest rate.
DSCR
20% down · 8.5% · 30yr
- Down + closing
- —
- Monthly P&I
- —
- Monthly cashflow
- —
- DSCR
- —
- Eligible?
- —
No personal income docs; deal must DSCR.
Hard money
10% down · 12.0% · 12mo
- Down + closing
- —
- Monthly P&I
- —
- Monthly cashflow
- —
- DSCR
- —
- Eligible?
- —
Short-term bridge; refi at stabilization.
Listing history 36 events
-
2026-06-18days on market $132,900 Active 45 DOM
-
2026-06-17days on market $132,900 Active 44 DOM
-
2026-06-16days on market $132,900 Active 43 DOM
-
2026-06-15days on market $132,900 Active 42 DOM
-
2026-06-13days on market $132,900 Active 40 DOM
-
2026-06-12days on market $132,900 Active 39 DOM
-
2026-06-09days on market $132,900 Active 36 DOM
-
2026-06-08days on market $132,900 Active 35 DOM
-
2026-06-07days on market $132,900 Active 34 DOM
-
2026-06-07days on market $132,900 Active 33 DOM
-
2026-06-04days on market $132,900 Active 30 DOM
-
2026-06-02days on market $132,900 Active 29 DOM
-
2026-06-01days on market $132,900 Active 28 DOM
-
2026-05-31days on market $132,900 Active 27 DOM
-
2026-05-31days on market $132,900 Active 26 DOM
-
2026-05-13status Active 741-char remark
-
2026-05-10historical Active Under Contract 741-char remark
-
2026-05-02$132,900 Active 741-char remark
-
2025-05-31price $136,900
-
2025-05-28status Active
-
2025-05-25historical Active Under Contract
-
2025-05-25status Active
-
2025-05-19historical Active Under Contract
-
2025-04-30price $139,900
-
2025-04-16price $142,000
-
2025-03-24price $149,900
-
2025-03-17$159,900 Active
-
2024-10-07price $109,900
-
2024-09-30price $112,900
-
2024-09-07price $114,900
-
2024-09-03price $117,900
-
2024-08-29price $119,900
-
2024-08-16price $123,000
-
2024-07-31$129,000 Active
-
2024-04-30soldstatus $60,000
-
1997-09-19soldstatus $27,500
ⓘ Source: listings_history table (triggers on properties + properties_extension) + one-shot
backfill from property_details.listing_events for pre-trigger history.
Tax reassessment forecast MI · Partial reset (capped growth)
- Current annual tax
- $273 · $23/mo
- Projected year-2 tax
- $1,160 · $97/mo
- Expected delta
- +$887/yr (+$74/mo · 324.9%)
ⓘ Screening estimate from a state-policy table — verify with the county assessor before closing.
Climate risk First Street
- Flood 1/10 Low 0% chance over 30 yrs
- Wildfire 3/10 Moderate
- Heat 1/10 Low 7 d/yr ≥95°F today · 13 d/yr by 30 yrs out
- Wind 1/10 Low
- Air quality 1/10 Low 0 unhealthy d/yr today · 0 by 30 yrs out
Nearby sold comps map
Loading sold comps map…
Walkable amenities ~0.75 mi
Loading nearby amenities…
Taxation est. · year 1
- Rental income
- $16,374
- − Mortgage interest
- −$7,444
- − Property taxes
- −$273
- − Insurance
- −$664
- − Repairs & maintenance
- −$1,310
- − Management
- −$1,310
- − Depreciation
- −$3,866
- Taxable income
- $1,506
- Est. tax owed @ 24.0%
- −$361
- After-tax cash flow
- $3,273/yr
For passive investors: Depreciation is non-cash, so a rental often shows a tax loss while cash-flowing — sheltering income. Rental losses are passive: they offset passive income freely, and up to $25,000/yr can offset ordinary (W-2) income if you actively participate and your MAGI is under $100k (phasing out to $0 by $150k); unused losses carry forward. On sale, claimed depreciation is recaptured at up to 25%, and gains may owe capital-gains tax (a 1031 exchange can defer both). Figures are a year-1 estimate at your 24.0% rate — not tax advice; consult a CPA.
Schools (NCES district)
- District
- Atlanta Community Schools
- NCES district ID
- 2603570
- Math proficiency
- 25% ▲ 5.00%
- Reading proficiency
- 35% ▲ 10.00%
- Median HH income
- $35,004
- Composite
- 27.59/100
- National rank
- #12347
- State rank
- #546 of 760 in MI
Livability — Avery
No livability data for this city. (Only ~50 U.S. cities are tracked.)
Census & demographics
- Population (ZIP)
- 3,524
Population outlook (Montmorency County) Hauer SSP2
- Today (2025)
- 8,233 people
- By 2030
- 7,575 · -8.0%
- By 2040
- 6,202 · -24.7%
- By 2050
- 5,081 · -38.3%
- By 2075
- 3,119 · -62.1%
- By 2100
- 1,923 · -76.6%
Race, ethnicity, and origin ACS 2023
- Neighborhood character
- Predominantly White (94%)
- Race & ethnicity
- White 94% Two or more races 4% Hispanic / Latino 2%
- Common ancestry
- Romanian 11% Lithuanian 7% Slovak 6%
- Foreign-born
- 1% · Canada
- Languages at home
- 98% English-only · Other Asian/Pacific 1% Spanish 1%
Political lean MEDSL · Montmorency
- 2024 margin
- Solid R (+45.3) · D 26.6% · R 72.0% · Other 1.4%
- 2008→2024 swing
- -37.2pp toward R · 2008: -8.2pp · 2024: -45.3pp
- All cycles
- 2024: R+45.3 2020: R+43.4 2016: R+44.2 2012: R+17.4 2008: R+8.2
Not yet ingested
- Civics
- —
Market trends
- HPI YoY
- ▲ 42.88%
- Current HPI
- 361.3052
- Rent YoY
- —
- Metro
- —
- State GDP YoY
- ▲ 1.37%
- F500 in state
- 28
Industry mix (Fortune 500 HQ in MI)
| Industry | F500 HQs | Revenue |
|---|---|---|
| Automotive Parts | 3 | $48B |
|
||
| Automotive | 2 | $372B |
|
||
| Chemicals | 1 | $45B |
|
||
| Automotive Retail | 1 | $29B |
|
||
| Healthcare / Medical Devices | 1 | $23B |
|
||
| Automotive Technology | 1 | $20B |
|
||
Price history
+383.3% since first listed21 events — show timeline
- 2026-05-13 Relisted — WWMLS
- 2026-05-10 Contingent — WWMLS
- 2026-05-02 Listed $132,900 WWMLS
- 2025-05-31 Price Changed $136,900 WWMLS
- 2025-05-28 Relisted — WWMLS
- 2025-05-25 Contingent — WWMLS
- 2025-05-25 Relisted — WWMLS
- 2025-05-19 Contingent — WWMLS
- 2025-04-30 Price Changed $139,900 WWMLS
- 2025-04-16 Price Changed $142,000 WWMLS
- 2025-03-24 Price Changed $149,900 WWMLS
- 2025-03-17 Listed $159,900 WWMLS
- 2024-10-07 Price Changed $109,900 WWMLS
- 2024-09-30 Price Changed $112,900 WWMLS
- 2024-09-07 Price Changed $114,900 WWMLS
- 2024-09-03 Price Changed $117,900 WWMLS
- 2024-08-29 Price Changed $119,900 WWMLS
- 2024-08-16 Price Changed $123,000 WWMLS
- 2024-07-31 Listed $129,000 WWMLS
- 2024-04-30 Sold (Public Records) $60,000 Public Records
- 1997-09-19 Sold (Public Records) $27,500 Public Records
Property tax history
+2.8%/yrLatest (2024): $273 · -45.2% YoY. Source: county tax records.
Cash-flow waterfall
monthlySold comps — $/sqft
last 12 mo · ≤1 miLoading sold comps…