 Duplex
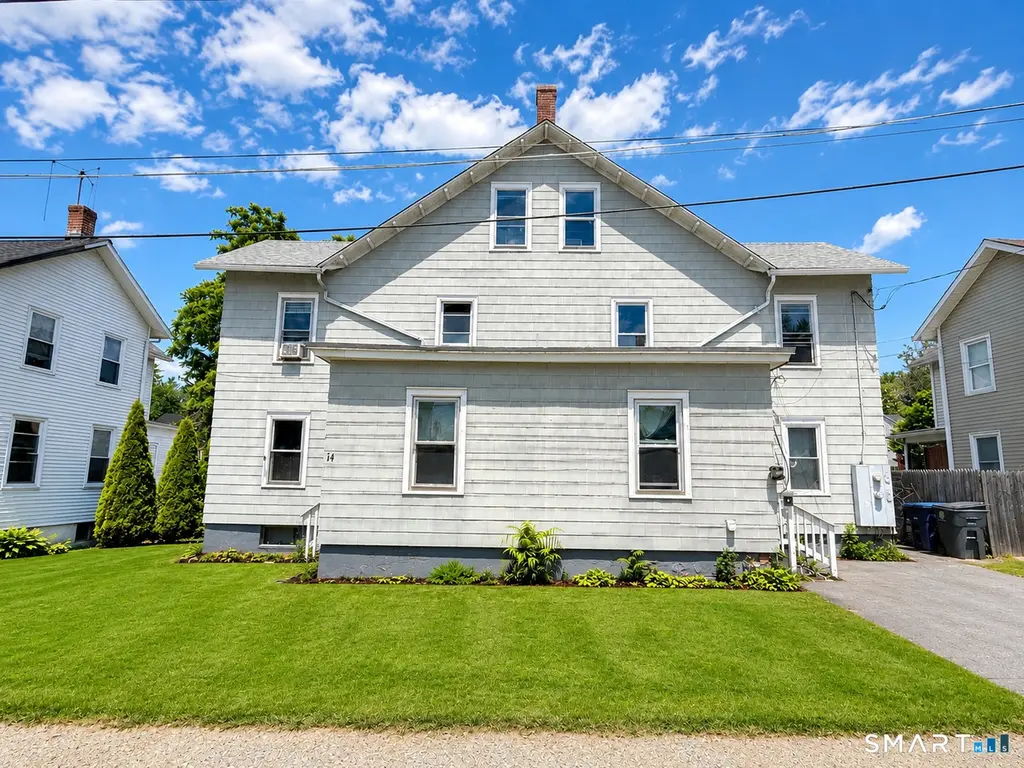
14 Asnuntuck St · Thompsonville, CT
Flood risk 1/10 · Minimal
- FEMA flood zone
- X (unshaded)
- Chance of flooding over 30 yrs
- 0.0%
- Est. flood insurance / yr
- $473 – $860
Fire risk 3/10 · Minor
- Est. fire insurance / yr
- $829 – $1,539
Heat risk 5/10 · Moderate
- Hot days now (above 99°F)
- 7 days/yr
- Hot days in 30 yrs
- 16 days/yr
Wind risk 6/10 · Moderate
- Chance of severe wind over 30 yrs
- 27.0%
Air-quality risk 3/10 · Minor
- Unhealthy air days now
- 2 days/yr
- Unhealthy air days in 30 yrs
- 3 days/yr
Risk factors via First Street. Map © Google.
Why this score? — see what drove the B+ grade
The composite is a weighted blend of 9 inputs, each scored 0–100. Each bar is that input's sub-score; the figure is the points it added to the 100-point composite (weight × sub-score).
- Cash flow +30.0/30.0
- ARV discount +13.9/15.0
- DSCR +10.0/10.0
- 1% rule +9.8/10.0
- Rent growth +3.5/5.0
- Livability +3.5/5.0
- Schools +3.0/10.0
- Condition / age +2.5/5.0
- Appreciation +0.0/10.0
$333,777
🖨 Deal sheet (PDF) 📄 Offer letter ✓ Due diligence
Multi-family units
County records classify this as Multi-Family (2-4 Unit). Listing-text estimate: 2 units. confirmed
Listing remarks MLS
There is much opportunity present in this 2 unit property. The units are side-by-side, and each unit has 4 bedrooms. The property is move in ready for you or your tenants. Brand-new high efficiency Navien natural gas boilers in each unit. Lots of updates including new flooring, paint and vinyl windows throughout. Separate utilities. Schedule your showing today! ** The seller is in receipt of multiple offers and has asked that anyone with an interest in making an offer do so by 8pm, August 16th **
Key facts
- Spacious layouts
- Easy access
- Appliances included
Tags
Property features AI
Exterior
- Utilities: Public water connected; Public sewer connected; Natural gas service
- Home design: Multi-family (2-family) property
- Construction: Frame construction; Asbestos siding; Block and brick foundation; Asphalt shingle roof; Gray exterior color
- Exterior features: Front porch; Level lot
Interior
- Bedrooms: 8 total bedrooms
- Bathrooms: 2 full bathrooms
- Heating & cooling: Hot water heat; Natural gas heat and domestic hot water
- Interior features: 12 total rooms; Full basement; Walk-up attic
- Laundry & utility: Laundry hookups in Unit 2; Basement laundry in Unit 16
Neighborhood map
What this means for you Summary
Snapshot
- This is a 2 × 4-bed/1.0-bath units multifamily listed at $334k.
Deal economics
- At list price, monthly cash flow is $2k ($19k/yr) — positive. Per door: $802/mo.
- The deal already cash-flows at list — no discount required.
- Meets the 1% rule at list price ($5k rent vs $334k).
- Cap rate 12.1% vs local median 5.2% in Thompsonville — top-decile yield for the area; either an underpriced asset or a hidden risk that comps aren't pricing in. Stress-test before assuming the spread holds.
Location & tenants
- Location reads 69/100 on livability (#103 in CT) — a middle-class / working-renter tenant base. Strengths: health & safety A+, housing A, crime B+; Watch: amenities F, commute F, employment D-.
- Enfield School District (suburban): math 25% / reading 41% proficiency, ranked #114 of 153 in CT (top 74%) — families likely to look elsewhere, expect single-tenant / working-renter base with shorter leases.
- Zoned schools: Eli Whitney School (math 28% / reading 39%, grade F, #353 of 553 statewide, top 64%, 339 students, 48% FRL); John F. Kennedy Middle School (math 22% / reading 39%, grade F, #138 of 175 statewide, top 79%, 1,096 students, 46% FRL); Enfield High School (math 29% / reading 54%, grade F, #102 of 194 statewide, top 53%, 1,490 students, 40% FRL) — zoned schools average 45% FRL vs 29% district-wide (16 pts higher); higher-poverty schools than district average — tighter screening recommended.
- Market conditions: Rents rising (+3.9%/yr); 189 active listings in the ZIP; solid renter incomes; 1,867 units permitted in Capitol Planning Region in 2024 (1,399 in 5+ unit buildings).
- At $4,924/mo this rent would consume 65% of the median local household income ($90k/yr) (locally 954% of renters already pay >50% of income on rent) — very limited rent-growth headroom before tenants either downsize or default.
Forward outlook
- Local home prices are declining (-3.0%/yr); year-one equity from $2k of loan paydown is wiped out by about $10k of value loss. Plan a longer hold.
- At projected returns (-3.0% appreciation + 3.9% rent growth), your $93k cash investment doubles in ~6 years — after that, you're playing with house money.
Negotiation context
- Only 3 days on market — expect competitive offers; lowballing is unlikely to land.
- 5 sale attempts since 26y ago; this cycle's ask is 40% above the opening price — seller raised mid-cycle; expect resistance to lowballs.
- Current owner paid $250k; 34% above their basis — modest negotiation headroom, anchor on the comps not their cost.
Risks & watch-outs
- Watch-outs: built in 1900 — expect roof / HVAC / electrical / plumbing capex.
- Climate carrying-cost: major wind risk, 27% chance of damaging wind over 30y; extreme-heat days projected 7→16/yr by 2055 (HVAC capex compounding) — expect insurance premiums to compound above CPI over the hold.
Questions for the listing agent
- Can we see the unit-by-unit rent roll, current vacancy, and any below-market leases? What's the average tenancy length?
- What capital expenditures (roof, boiler, parking lot, exteriors) have been made in the last 5 years, and what's planned in the next 2?
- Built in 1900 — when were the roof, HVAC, electrical panel, plumbing, and water heater last replaced?
- Is there a deadline driving the sale (1031 exchange, divorce, estate, relocation)? That informs how much negotiation room exists.
- What's the average days-on-market for RENTAL listings here right now (not sales)? A rising rental-DOM trend means longer vacancies and softer asking-rent achievability than the comps imply.
- What's the recent tenant-quality profile in this submarket — average credit score on applications, eviction rate, late-payment / NSF rate, and stable-employment percentage? A property-management company in the area should have these aggregated.
- How much new apartment / multifamily construction is in the pipeline within 1–3 miles? Heavy new supply (>2% of stock underway) typically softens rents 12–24 months out; light construction supports rent growth.
Investment metrics
- 1% rule
- 1.48% ✓
- Cap rate
- 12.06%
- Cash-on-cash
- 20.60%
- DSCR
- 1.92
- GRM
- 5.6
CMA / ARV
- ARV (on-the-fly)
- $389,486
- Comps found
- 2
Show comp detail 2 sales within ~0.75 mi
| Address | Dist | Beds/Ba | Sqft | Sold | Price | $/sf | Match |
|---|---|---|---|---|---|---|---|
| 90 West St | 0.47mi | 8/4.0 | 2,800 (+7%) | 16mo | $365,000 | $130 | 45 |
| 81 West St | 0.42mi | 8/4.0 | 2,912 (+11%) | 21mo | $435,000 | $149 | 36 |
Match score weights: distance 35% · size 25% · config 20% · recency 20%. Top-matched comps best support the ARV.
Projected returns pro-forma
-3.0% appreciation · 3.9% rent growth · sell at horizon
- IRR
- 13.9%
- Equity multiple
- 1.56×
- Total profit
- $52,646
- Equity at exit
- $49,767
- IRR
- 23.4%
- Equity multiple
- 3.10×
- Total profit
- $196,457
- Equity at exit
- $28,859
Cash invested: $93,458 (down + closing). Projections, not guarantees.
Landlord ↔ Tenant lean methodology
- Overall (STATE)
- 27 Tenant-Leaning
- State Connecticut
- 27 Tenant-Leaning · D+7
- County
- — inherits STATE
- City
- — inherits STATE
ZIP-level market 06082
- Rents YoY
- 3.9%
- Active inventory
- 189
- Price-to-rent
- 11.3×
Monthly cashflow live
- Estimated rent
- $4,924 high interval (Pro) →
- Mortgage (P&I)
- −$1,750
- Tax from tax record
- −$396 /mo · $4,756/yr
- Insurance
- −$139
- HOA
- −$0
- Lot rent
- −$0
- Vacancy / Maint / Mgmt
- −$1,034
- Net cashflow
- $1,604
Break-even live
Sensitivity live
| Price | -10% $1,793 | -5% $1,699 | +0% $1,604 | +5% $1,510 | +10% $1,415 |
|---|---|---|---|---|---|
| Rent | -10% $1,215 | -5% $1,410 | +0% $1,604 | +5% $1,799 | +10% $1,993 |
| Rate | -1.0pp $1,772 | -0.5pp $1,689 | base $1,604 | +0.5pp $1,518 | +1.0pp $1,430 |
2-unit breakdown (identical units grouped — click to expand)
| Units | Beds | Baths | Est. rent |
|---|---|---|---|
| 2× units | 4 | 1 | $4,924 |
| #1 | 4 | 1 | $2,462 |
| #2 | 4 | 1 | $2,462 |
| Total (2 units) | $4,924 | ||
UW: 25.0% down · 7.5% · 30yr · 1.5% tax · 5.0% vac · 8.0% maint · 8.0% mgmt
Financing live
Cash to close
- Down payment
- $83,444
- Closing costs
- $10,013
- Reserves months
- —
- Total cash needed
- —
Loan-product check · same deal, 3 products live
Conventional
25% down · 7.5% · 30yr
- Down + closing
- —
- Monthly P&I
- —
- Monthly cashflow
- —
- DSCR
- —
- Eligible?
- —
Personal DTI + credit; lowest rate.
DSCR
20% down · 8.5% · 30yr
- Down + closing
- —
- Monthly P&I
- —
- Monthly cashflow
- —
- DSCR
- —
- Eligible?
- —
No personal income docs; deal must DSCR.
Hard money
10% down · 12.0% · 12mo
- Down + closing
- —
- Monthly P&I
- —
- Monthly cashflow
- —
- DSCR
- —
- Eligible?
- —
Short-term bridge; refi at stabilization.
Listing history 4 events
-
2026-06-22days on market $333,777 Active 3 DOM
-
2026-06-22statusdays on market $333,777 Active 2 DOM
-
2026-06-18remarks 699-char remark
-
2026-06-18$333,777 Coming Soon 1 DOM
ⓘ Source: listings_history table (triggers on properties + properties_extension) + one-shot
backfill from property_details.listing_events for pre-trigger history.
Tax reassessment forecast CT · Partial reset (capped growth)
- Current annual tax
- $4,756 · $396/mo
- Projected year-2 tax
- $5,949 · $496/mo
- Expected delta
- +$1,193/yr (+$99/mo · 25.1%)
ⓘ Screening estimate from a state-policy table — verify with the county assessor before closing.
Climate risk First Street
- Flood 1/10 Low FEMA zone X (unshaded) · 0% chance over 30 yrs
- Wildfire 3/10 Moderate
- Heat 5/10 Major 7 d/yr ≥99°F today · 16 d/yr by 30 yrs out
- Wind 6/10 Major 27% chance of damaging wind over 30 yrs
- Air quality 3/10 Moderate 2 unhealthy d/yr today · 3 by 30 yrs out
Nearby sold comps map
Loading sold comps map…
Walkable amenities ~0.75 mi
Loading nearby amenities…
Taxation est. · year 1
- Rental income
- $59,088
- − Mortgage interest
- −$18,697
- − Property taxes
- −$4,756
- − Insurance
- −$1,669
- − Repairs & maintenance
- −$4,727
- − Management
- −$4,727
- − Depreciation
- −$9,710
- Taxable income
- $14,802
- Est. tax owed @ 24.0%
- −$3,553
- After-tax cash flow
- $15,698/yr
For passive investors: Depreciation is non-cash, so a rental often shows a tax loss while cash-flowing — sheltering income. Rental losses are passive: they offset passive income freely, and up to $25,000/yr can offset ordinary (W-2) income if you actively participate and your MAGI is under $100k (phasing out to $0 by $150k); unused losses carry forward. On sale, claimed depreciation is recaptured at up to 25%, and gains may owe capital-gains tax (a 1031 exchange can defer both). Figures are a year-1 estimate at your 24.0% rate — not tax advice; consult a CPA.
Schools (NCES district)
- District
- Enfield School District
- NCES district ID
- 0901470
- Math proficiency
- 25% ▼ -14.00%
- Reading proficiency
- 41% ▼ -10.00%
- Median HH income
- $68,750
- Composite
- 30.42/100
- National rank
- #6238
- State rank
- #114 of 153 in CT
Livability — Thompsonville
- Score
- 69/100
- State rank
- #103
- US rank
- #8941
Category grades
Schools grade is shown separately in the Schools card above.
Census & demographics
- Census place
- Thompsonville, CT
- County
- Hartford County · 754,208 people
- Metro
- Hartford-East Hartford-Middletown, CT
- Population (ZIP)
- 41,090
- Household income
- $90,404
- Rent vs Own
- Severe rent burden
- 954.0
Population outlook (Capitol County) Hauer SSP2
- By 2040
- 1,063,519
Race, ethnicity, and origin ACS 2023
- Neighborhood character
- Predominantly White (76%)
- Race & ethnicity
- White 76% Hispanic / Latino 11% Two or more races 9% Black 5% Asian 2%
- Hispanic origin (detail)
- Mexican 1% Puerto Rican 7%
- Common ancestry
- Romanian 10% Lithuanian 9% Slovak 2%
- Foreign-born
- 6% · Canada, Jamaica
- Languages at home
- 89% English-only · Spanish 5% Other Indo-European 2% Russian/Polish/Slavic 1%
Political lean MEDSL · Capitol
- 2024 margin
- Strong D (+21.9) · D 60.1% · R 38.2% · Other 1.7%
- All cycles
- 2024: D+21.9
Not yet ingested
- Civics
- —
Market trends
- HPI YoY
- ▼ -494.72%
- Current HPI
- 192.4011
- Rent YoY
- ▲ 3.90%
- Metro
- Hartford-East Hartford-Middletown, CT
- State GDP YoY
- ▲ 1.06%
- F500 in state
- 38
Industry mix (Fortune 500 HQ in CT)
| Industry | F500 HQs | Revenue |
|---|---|---|
| Industrial Machinery | 4 | $38B |
|
||
| Insurance | 3 | $71B |
|
||
| Financial Services | 2 | $25B |
|
||
| Transportation / Logistics | 2 | $18B |
|
||
| Healthcare | 1 | $247B |
|
||
| Telecommunications | 1 | $55B |
|
||
Price history
+595.4% since first listed18 events — show timeline
- 2026-06-18 Coming Soon $333,777 Smart MLS
- 2022-09-28 Sold (Public Records) $250,000 Public Records
- 2022-09-27 Sold (MLS) $250,000 Smart MLS
- 2022-08-17 Pending — Smart MLS
- 2022-08-12 Relisted — Smart MLS
- 2022-05-27 Listed $239,000 Smart MLS
- 2022-05-26 Coming Soon $239,000 Smart MLS
- 2021-01-15 Sold (Public Records) $98,000 Public Records
- 2021-01-08 Sold (MLS) $98,000 Smart MLS
- 2020-09-16 Contingent — Smart MLS
- 2020-05-11 Listed $99,000 Smart MLS
- 2003-08-28 Sold (Public Records) $120,000 Public Records
- 2003-08-27 Sold (MLS) $120,000 Smart MLS
- 2003-06-05 Listed $124,900 Smart MLS
- 2000-11-17 Sold (Public Records) $65,000 Public Records
- 2000-11-15 Sold (MLS) $65,000 Smart MLS
- 2000-09-25 Listed $69,900 Smart MLS
- 1983-06-29 Sold (Public Records) $48,000 Public Records
Property tax history
+1.8%/yrLatest (2025): $4,756 · +2.8% YoY. Source: county tax records.
Cash-flow waterfall
monthlySold comps — $/sqft
last 12 mo · ≤1 miLoading sold comps…