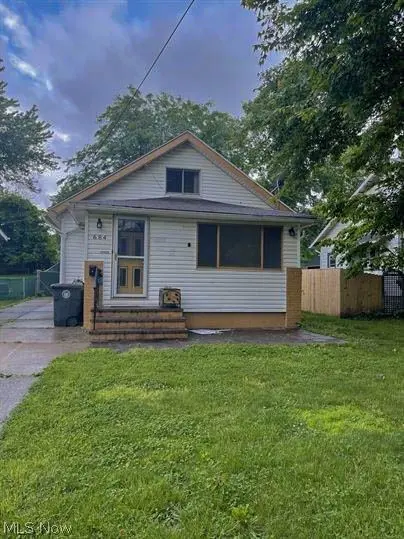
684 Evans Ave · Akron, OH
Flood risk 6/10 · Moderate
- FEMA flood zone
- X (unshaded)
- Chance of flooding over 30 yrs
- 0.75%
- Est. flood insurance / yr
- $473 – $860
Fire risk 1/10 · Minimal
- Est. fire insurance / yr
- $713 – $1,323
Heat risk 3/10 · Minor
- Hot days now (above 97°F)
- 7 days/yr
- Hot days in 30 yrs
- 16 days/yr
Wind risk 1/10 · Minimal
- Chance of severe wind over 30 yrs
- —
Air-quality risk 3/10 · Minor
- Unhealthy air days now
- 2 days/yr
- Unhealthy air days in 30 yrs
- 4 days/yr
Risk factors via First Street. Map © Google.
Why this score? — see what drove the C grade
The composite is a weighted blend of 9 inputs, each scored 0–100. Each bar is that input's sub-score; the figure is the points it added to the 100-point composite (weight × sub-score).
- Cash flow +19.0/30.0
- ARV discount +12.6/15.0
- DSCR +6.0/10.0
- 1% rule +5.1/10.0
- Livability +4.0/5.0
- Rent growth +3.7/5.0
- Condition / age +2.5/5.0
- Schools +2.1/10.0
- Appreciation +0.0/10.0
$112,900
🖨 Deal sheet (PDF) 📄 Offer letter ✓ Due diligence
Listing remarks MLS
Welcome to 684 Evans * Much more spacious than it looks from the street * First floor bedroom * New carpet in living room, dining room, porch and bonus room * French doors from 3 season room to living room * One bedroom on the first floor and two bedrooms on the second floor * Bonus room could be an office, playroom, den or possibly enclosed for a 2nd first floor bedroom. The possibilities are endless * "Other" is the area off of kitchen with extra top and bottom cabinets, perfect for a coffee bar or just for storing extras * HE Furnace * Blown in insulation 2015 * Deck and fenced in backyard *
Key facts
- 3 season room
- Insulation added
- Bonus room
Tags
Property features AI
Finance
- HOA & community: Public transportation access
Exterior
- Parking: Concrete driveway; On-site paved outdoor parking (no garage)
- Utilities: Public water; Public sewer
- Home design: Brick and wood siding exterior; Asphalt fiberglass roof; Block foundation
- Construction: Brick and wood siding construction; Asphalt/fiberglass roof; Block foundation
- Exterior features: Deck; Porch; Chain-link fencing; Shed(s); Back yard and front yard; City lot with gentle slope and few trees
Interior
- Kitchen: Dishwasher; Range
- Bedrooms: One main-level bedroom
- Bathrooms: One full bathroom (main level)
- Heating & cooling: Forced-air gas heating; Central air conditioning
- Interior features: Wood window frames; Full unfinished basement with concrete floor and storage space
- Laundry & utility: Washer hookup; Gas dryer hookup; Laundry located in basement
Neighborhood map
What this means for you Summary
Snapshot
- This is a 3-bed/1.0-bath single-family listed at $113k.
Deal economics
- At list price, monthly cash flow is $118 ($1k/yr) — positive.
- The deal already cash-flows at list — no discount required.
- Meets the 1% rule at list price ($1k rent vs $113k).
Location & tenants
- Location reads 81/100 on livability (#104 in OH, #1,591 nationally) — a professional / high-income tenant draw. Strengths: amenities A+, commute A+, cost of living A+; Watch: crime F, employment F.
- Akron City (urban): math 22% / reading 30% proficiency, ranked #602 of 656 in OH (top 92%) — low school quality limits family demand, transient renter base, plan for 1-2y turnover; 66% free/reduced lunch — lower-income household profile, screen leases tightly.
- Market conditions: Rents rising fast (+4.8%/yr); 86 active listings in the ZIP; 21 comparable units currently listed for rent nearby; rentals lingering (median 45d on market — plan ~5-8 weeks vacancy on turnover, expect pricing pressure); 52% of comp listings sitting > 30 days — soft ceiling on asking rent; lower-income renter base — watch delinquency; 1,114 units permitted in Summit County in 2024 (397 in 5+ unit buildings).
- This rent runs 33% of the median local income ($41k/yr) — at the standard rent-burdened threshold; future hikes will face affordability resistance.
Forward outlook
- Local home prices are declining (-3.0%/yr); year-one equity from $781 of loan paydown is wiped out by about $3k of value loss. Plan a longer hold.
- Summit County population projected to shrink 6% by 2050 — rents likely to lag national; underwrite the cash flow, not the appreciation.
Negotiation context
- Only 10 days on market — expect competitive offers; lowballing is unlikely to land.
- 6 sale attempts since 35y ago with the ask held roughly flat each time — persistent listings suggest the price (not the market) is what's stuck; bring a comps-based counter.
- Current owner paid $90k; 25% above their basis — modest negotiation headroom, anchor on the comps not their cost.
Risks & watch-outs
- Watch-outs: built in 1928 — expect roof / HVAC / electrical / plumbing capex.
- Climate carrying-cost: major flood risk — expect insurance premiums to compound above CPI over the hold.
Questions for the listing agent
- Built in 1928 — when were the roof, HVAC, electrical panel, plumbing, and water heater last replaced?
- Is there a deadline driving the sale (1031 exchange, divorce, estate, relocation)? That informs how much negotiation room exists.
- Crime grade is F in this area — have there been break-ins, vandalism, or insurance claims at this property in the last 3 years? What carrier currently insures it and at what premium?
- What's the average days-on-market for RENTAL listings here right now (not sales)? A rising rental-DOM trend means longer vacancies and softer asking-rent achievability than the comps imply.
- What's the recent tenant-quality profile in this submarket — average credit score on applications, eviction rate, late-payment / NSF rate, and stable-employment percentage? A property-management company in the area should have these aggregated.
- How much new for-sale + rental construction is in the pipeline within 1–3 miles? Heavy new supply typically softens prices + rents 12–24 months out; constrained supply supports both.
Investment metrics
- 1% rule
- 1.01% ✓
- Cap rate
- 7.54%
- Cash-on-cash
- 4.47%
- DSCR
- 1.20
- GRM
- 8.2
CMA / ARV
- ARV (on-the-fly)
- $127,455
- Comps found
- 8
Show comp detail 8 sales within ~0.75 mi
| Address | Dist | Beds/Ba | Sqft | Sold | Price | $/sf | Match |
|---|---|---|---|---|---|---|---|
| 639 Ranney St | 0.26mi | 2/1.0 (-1) | 909 (+3%) | 1mo | $131,000 | $144 | 77 |
| 904 Davis St | 0.31mi | 2/1.0 (-1) | 864 (-2%) | 4mo | $125,000 | $145 | 74 |
| 691 Gardendale Ave | 0.17mi | 3/1.0 | 960 (+9%) | 9mo | $95,000 | $99 | 69 |
| 643 Villa Ave | 0.14mi | 2/2.0 (-1) | 912 (+4%) | 16mo | $165,000 | $181 | 65 |
| 973 Nevin St | 0.38mi | 2/1.0 (-1) | 952 (+8%) | 3mo | $39,000 | $41 | 61 |
| 614 Parkview Ave | 0.50mi | 3/1.0 | 972 (+11%) | 3mo | $163,000 | $168 | 57 |
| 354 Zeller Ave | 0.68mi | 2/1.0 (-1) | 832 (-5%) | 8mo | $125,810 | $151 | 48 |
| 1353 Vane Ave | 0.72mi | 2/1.0 (-1) | 886 (+1%) | 17mo | $95,000 | $107 | 46 |
Match score weights: distance 35% · size 25% · config 20% · recency 20%. Top-matched comps best support the ARV.
Projected returns pro-forma
-3.0% appreciation · 4.82% rent growth · sell at horizon
- IRR
- -7.3%
- Equity multiple
- 0.73×
- Total profit
- $-8,655
- Equity at exit
- $16,834
- IRR
- 4.5%
- Equity multiple
- 1.36×
- Total profit
- $11,252
- Equity at exit
- $9,762
Cash invested: $31,612 (down + closing). Projections, not guarantees.
Landlord ↔ Tenant lean methodology
- Overall (STATE)
- 73 Landlord-Friendly
- State Ohio
- 73 Landlord-Friendly · R+6
- County
- — inherits STATE
- City
- — inherits STATE
ZIP-level market 44310
- Rents YoY
- 4.8%
- Active inventory
- 86
- Price-to-rent
- 8.2×
Monthly cashflow live
- Estimated rent
- $1,141 high interval (Pro) →
- Mortgage (P&I)
- −$592
- Tax from tax record
- −$145 /mo · $1,737/yr
- Insurance
- −$47
- HOA
- −$0
- Vacancy / Maint / Mgmt
- −$240
- Net cashflow
- $118
Break-even live
Sensitivity live
| Price | -10% $182 | -5% $150 | +0% $118 | +5% $86 | +10% $54 |
|---|---|---|---|---|---|
| Rent | -10% $27 | -5% $73 | +0% $118 | +5% $163 | +10% $208 |
| Rate | -1.0pp $174 | -0.5pp $146 | base $118 | +0.5pp $88 | +1.0pp $59 |
UW: 25.0% down · 7.5% · 30yr · 1.5% tax · 5.0% vac · 8.0% maint · 8.0% mgmt
Financing live
Cash to close
- Down payment
- $28,225
- Closing costs
- $3,387
- Reserves months
- —
- Total cash needed
- —
Loan-product check · same deal, 3 products live
Conventional
25% down · 7.5% · 30yr
- Down + closing
- —
- Monthly P&I
- —
- Monthly cashflow
- —
- DSCR
- —
- Eligible?
- —
Personal DTI + credit; lowest rate.
DSCR
20% down · 8.5% · 30yr
- Down + closing
- —
- Monthly P&I
- —
- Monthly cashflow
- —
- DSCR
- —
- Eligible?
- —
No personal income docs; deal must DSCR.
Hard money
10% down · 12.0% · 12mo
- Down + closing
- —
- Monthly P&I
- —
- Monthly cashflow
- —
- DSCR
- —
- Eligible?
- —
Short-term bridge; refi at stabilization.
Rent comps 21 comps
| Address | Beds | Baths | Sqft | Rent | $/sqft | DOM | Units | Dist |
|---|---|---|---|---|---|---|---|---|
| 500 Delmar Ave Unit 502 Akron, OH | 2.0 | 1.0 | 1000 | $775 | $0.78 | 24d | 1 | 0.80mi |
| 649 Patterson Ave Unit a Akron, OH | 2.0 | 1.0 | 1000 | $775 | $0.78 | 44d | 1 | 0.86mi |
| 586 Robinette Ct Akron, OH | 4.0 | 1.0 | 1040 | $1,250 | $1.20 | 44d | 1 | 0.93mi |
| 1190 Hazel St Akron, OH | 3.0 | 1.0 | 1124 | $1,425 | $1.27 | 44d | 1 | 0.96mi |
| 1423 Creighton Ave Unit 1 Akron, OH | 3.0 | 1.0 | 1040 | $1,100 | $1.06 | 24d | 1 | 0.96mi |
| 857 Kennebec Ave Akron, OH | 3.0 | 1.0 | 1008 | $1,350 | $1.34 | 45d | 1 | 0.99mi |
| 680 Grifton Ave Akron, OH | 2.0 | 1.0 | 828 | $1,050 | $1.27 | 24d | 1 | 1.04mi |
| 676 Grifton Ave Akron, OH | 2.0 | 1.0 | 703 | $1,000 | $1.42 | 44d | 1 | 1.05mi |
| 106 Charles St Akron, OH | 2.0 | 1.0 | 800 | $850 | $1.06 | 44d | 1 | 1.10mi |
| 1444 Hyde Park Ave Akron, OH | 3.0 | 1.0 | 1104 | $1,395 | $1.26 | 14d | 1 | 1.12mi |
| 134 N Arlington St Akron, OH | 2.0 | 1.0 | 964 | $900 | $0.93 | 24d | 1 | 1.24mi |
| 605 E Buchtel Ave Unit 1 Akron, OH | 2.0 | 1.0 | 1000 | $695 | $0.69 | 15d | 1 | 1.27mi |
| 489 N Howard St Unit 101 Akron, OH | 2.0 | 1.0 | 700 | $799 | $1.14 | 44d | 1 | 1.30mi |
| 1446 Alphada Ave Akron, OH | 2.0 | 1.0 | 500 | $950 | $1.90 | 44d | 2 | 1.30mi |
| 545 E Buchtel Ave Unit 1 Akron, OH | 2.0 | 1.0 | 900 | $1,300 | $1.44 | 44d | 1 | 1.32mi |
| 797 E Market St Apt 220 Akron, OH | 2.0 | 1.5 | 1100 | $1,500 | $1.36 | 24d | 1 | 1.35mi |
| 1318 Arnold Ave Akron, OH | 3.0 | 1.0 | 1056 | $1,450 | $1.37 | 44d | 1 | 1.38mi |
| 109 Kent Ct Akron, OH | 2.0 | 1.0 | 1032 | $1,142 | $1.11 | 24d | 1 | 1.43mi |
| 539 E Cuyahoga Falls Ave Unit 1 Akron, OH | 2.0 | 1.0 | 1000 | $895 | $0.90 | 24d | 1 | 1.43mi |
| 825 Avon St Unit 1 Akron, OH | 2.0 | 1.0 | 960 | $875 | $0.91 | 22d | 1 | 1.47mi |
| 1059 Jean Ave Akron, OH | 3.0 | 1.0 | 1012 | $1,300 | $1.28 | 44d | 1 | 1.49mi |
Listing history 9 events
-
2026-06-13statusdays on market $112,900 Pending 10 DOM
-
2026-06-10days on market $112,900 Active 9 DOM
-
2026-06-09days on market $112,900 Active 8 DOM
-
2026-06-08days on market $112,900 Active 7 DOM
-
2026-06-07days on market $112,900 Active 6 DOM
-
2026-06-05days on market $112,900 Active 3 DOM
-
2026-06-03days on market $112,900 Active 2 DOM
-
2026-06-02remarks 699-char remark
-
2026-06-02$112,900 Active 1 DOM
ⓘ Source: listings_history table (triggers on properties + properties_extension) + one-shot
backfill from property_details.listing_events for pre-trigger history.
Tax reassessment forecast OH · Partial reset (capped growth)
- Current annual tax
- $1,737 · $145/mo
- Projected year-2 tax
- $1,749 · $146/mo
- Expected delta
- +$12/yr (+$1/mo · 0.7%)
ⓘ Screening estimate from a state-policy table — verify with the county assessor before closing.
Climate risk First Street
- Flood 6/10 Major FEMA zone X (unshaded) · 75% chance over 30 yrs
- Wildfire 1/10 Low
- Heat 3/10 Moderate 7 d/yr ≥97°F today · 16 d/yr by 30 yrs out
- Wind 1/10 Low
- Air quality 3/10 Moderate 2 unhealthy d/yr today · 4 by 30 yrs out
Nearby sold comps map
Loading sold comps map…
Walkable amenities ~0.75 mi
Loading nearby amenities…
Taxation est. · year 1
- Rental income
- $13,694
- − Mortgage interest
- −$6,324
- − Property taxes
- −$1,737
- − Insurance
- −$564
- − Repairs & maintenance
- −$1,096
- − Management
- −$1,096
- − Depreciation
- −$3,284
- Taxable loss
- −$407
- Est. tax savings @ 24.0%
- +$98
- After-tax cash flow
- $1,509/yr
For passive investors: Depreciation is non-cash, so a rental often shows a tax loss while cash-flowing — sheltering income. Rental losses are passive: they offset passive income freely, and up to $25,000/yr can offset ordinary (W-2) income if you actively participate and your MAGI is under $100k (phasing out to $0 by $150k); unused losses carry forward. On sale, claimed depreciation is recaptured at up to 25%, and gains may owe capital-gains tax (a 1031 exchange can defer both). Figures are a year-1 estimate at your 24.0% rate — not tax advice; consult a CPA.
Schools (NCES district)
- District
- Akron City
- NCES district ID
- 3904348
- Math proficiency
- 22% ▼ -17.00%
- Reading proficiency
- 30% ▼ -12.00%
- Median HH income
- $33,811
- Composite
- 21.31/100
- National rank
- #8383
- State rank
- #602 of 656 in OH
Livability — Akron
- Score
- 81/100
- State rank
- #104
- US rank
- #1591
Category grades
Schools grade is shown separately in the Schools card above.
Census & demographics
- Census place
- Akron, OH
- County
- Summit County · 440,783 people
- City population
- 174,375
- Metro
- Akron, OH
- Population (ZIP)
- 25,496
- Household income
- $41,066
- Rent vs Own
- Severe rent burden
- 2058.0
Population outlook (Summit County) Hauer SSP2
- Today (2025)
- 546,583 people
- By 2030
- 544,028 · -0.5%
- By 2040
- 531,363 · -2.8%
- By 2050
- 514,923 · -5.8%
- By 2075
- 481,765 · -11.9%
- By 2100
- 432,265 · -20.9%
Race, ethnicity, and origin ACS 2023
- Neighborhood character
- Highly diverse neighborhood (Simpson 0.73)
- Race & ethnicity
- White 40% Black 25% Asian 20% Hispanic / Latino 10% Two or more races 9%
- Hispanic origin (detail)
- Mexican 6% Puerto Rican 2%
- Common ancestry
- Romanian 2% Slovak 1% Italian 1%
- Foreign-born
- 25% · Canada, India, Philippines
- Languages at home
- 69% English-only · Other Indo-European 13% Spanish 7% Other Asian/Pacific 6%
Political lean MEDSL · Summit
- 2024 margin
- Lean D (+7.0) · D 53.0% · R 46.0%
- 2008→2024 swing
- -9.6pp toward R · 2008: 16.6pp · 2024: 7.0pp
- All cycles
- 2024: D+7.0 2020: D+9.6 2016: D+8.2 2012: D+14.8 2008: D+16.6
Not yet ingested
- Civics
- —
Market trends
- HPI YoY
- ▼ -194.41%
- Current HPI
- 203.4431
- Rent YoY
- ▲ 4.82%
- Metro
- Akron, OH
- State GDP YoY
- ▲ 1.98%
- F500 in state
- 48
Industry mix (Fortune 500 HQ in OH)
| Industry | F500 HQs | Revenue |
|---|---|---|
| Insurance | 3 | $145B |
|
||
| Industrial Machinery | 3 | $49B |
|
||
| Financial Services | 3 | $24B |
|
||
| Consumer Goods | 2 | $93B |
|
||
| Aerospace / Defense | 2 | $47B |
|
||
| Utilities | 2 | $33B |
|
||
Price history
+223.5% since first listed20 events — show timeline
- 2026-05-29 Listed $112,900 MLSNOW
- 2022-06-25 Price Changed $1,000 RENT.
- 2022-05-26 Sold (Public Records) $90,000 Public Records
- 2022-05-26 Sold (MLS) $90,000 MLSNOW
- 2022-05-06 Pending — MLSNOW
- 2022-04-20 Contingent — MLSNOW
- 2022-04-18 Listed $79,900 MLSNOW
- 2009-01-08 Sold (MLS) $24,900 MLSNOW
- 2008-08-18 Listed $24,900 MLSNOW
- 2005-02-04 Sold (MLS) $50,000 MLSNOW
- 2005-02-03 Sold (Public Records) $50,000 Public Records
- 2004-07-15 Listed $59,900 MLSNOW
- 1999-02-10 Sold (Public Records) $79,900 Public Records
- 1998-07-22 Sold (Public Records) $58,000 Public Records
- 1998-07-22 Sold (Public Records) $58,000 Public Records
- 1992-03-09 Sold (Public Records) $31,000 Public Records
- 1992-03-05 Listing Removed — MLSNOW
- 1991-11-06 Listed $34,900 MLSNOW
- 1991-11-01 Listing Removed — MLSNOW
- 1991-08-02 Listed $34,900 MLSNOW
Property tax history
+8.2%/yrLatest (2025): $1,737 · +0.2% YoY. Source: county tax records.
Cash-flow waterfall
monthlySold comps — $/sqft
last 12 mo · ≤1 miLoading sold comps…