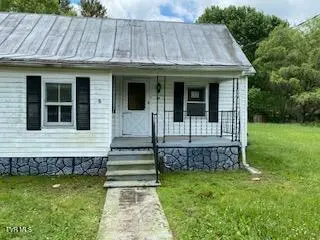
242 Rambling Ln · Bluff City, TN
Flood risk 1/10 · Minimal
- FEMA flood zone
- X (unshaded)
- Chance of flooding over 30 yrs
- 0.0%
- Est. flood insurance / yr
- $507 – $1,088
Fire risk 6/10 · Moderate
- Est. fire insurance / yr
- $949 – $1,763
Heat risk 4/10 · Minor
- Hot days now (above 93°F)
- 8 days/yr
- Hot days in 30 yrs
- 23 days/yr
Wind risk 2/10 · Minimal
- Chance of severe wind over 30 yrs
- —
Air-quality risk 2/10 · Minimal
- Unhealthy air days now
- 1 days/yr
- Unhealthy air days in 30 yrs
- 1 days/yr
Risk factors via First Street. Map © Google.
Why this score? — see what drove the B- grade
The composite is a weighted blend of 9 inputs, each scored 0–100. Each bar is that input's sub-score; the figure is the points it added to the 100-point composite (weight × sub-score).
- Cash flow +30.0/30.0
- 1% rule +10.0/10.0
- DSCR +10.0/10.0
- ARV discount +7.5/15.0
- Livability +2.8/5.0
- Rent growth +2.5/5.0
- Condition / age +2.5/5.0
- Schools +1.8/10.0
- Appreciation +0.0/10.0
$99,900
🖨 Deal sheet 📄 Offer letter ✓ Due diligence
Listing remarks
Adorable house near the river. Low county taxes. Nice, oversized level lot. Great fixer upper! Property sold as-is. All information taken from tax records. All information to be verified by buyers. Listing agent and seller not responsible. All information subject to errors and omissions. All offers must be submitted by the Buyer's agent via the RES. NET Agent Portal. If your offer is accepted, you agree to be responsible for an offer submission technology fee of $225.00. The fee will be collected and disbursed by the settlement agent and disbursed at the closing and settlement of the transaction. To submit your buyer's offer, simply click the link below. If you already have a RES. NET Agent
Key facts
- 0.79 acre lot
- Built 1929
- Listed 42 days
Property features AI
Exterior
- Utilities: Public water
- Home design: Single-family residential house; Not in a subdivision; Zoning: A 1
- Construction: Vinyl siding and other exterior materials
- Exterior features: Level topography; Metal roof
Interior
- Bathrooms: 1 full bathroom; 1 half bathroom
- Heating & cooling: Has heating (type: Other); Has cooling (type: Other)
- Interior features: Five total rooms; Fixer condition
Neighborhood map
What this means for you Summary
Snapshot
- This is a 2-bed/2.0-bath single-family listed at $100k.
Deal economics
- At list price, monthly cash flow is $680 ($8k/yr) — positive.
- The deal already cash-flows at list — no discount required.
- Meets the 1% rule at list price ($2k rent vs $100k).
- Recommended offer: $97k (3.0% below list) — sets the bar for market timing.
- Cap rate 14.5% vs local median 5.2% in Bluff City — top-decile yield for the area; either an underpriced asset or a hidden risk that comps aren't pricing in. Stress-test before assuming the spread holds.
Location & tenants
- Location reads 55/100 on livability (#361 in TN) — a working-class tenant base; expect higher turnover. Strengths: cost of living A+, housing A-; Watch: crime D+, employment D+, amenities F.
- Sullivan County (suburban): math 17% / reading 24% proficiency, ranked #109 of 139 in TN (top 78%) — low school quality limits family demand, transient renter base, plan for 1-2y turnover.
- Zoned schools: Bluff City Elementary (math 14% / reading 24%, grade F, #687 of 952 statewide, top 72%, 585 students, 0% FRL); Sullivan East Middle School (math 8% / reading 11%, grade F, #260 of 333 statewide, top 79%, 573 students, 0% FRL); Sullivan East High School (math 10% / reading 27%, grade F, #208 of 332 statewide, top 63%, 849 students, 0% FRL) — zoned schools average 0% FRL vs 45% district-wide (45 pts lower); this property's tenant base skews higher-income than the district average.
- Market conditions: 112 active listings in the ZIP; 453 units permitted in Sullivan County in 2024 (6 in 5+ unit buildings).
Forward outlook
- Local home prices are declining (-3.0%/yr); year-one equity from $691 of loan paydown is wiped out by about $3k of value loss. Plan a longer hold.
- Sullivan County population projected to shrink 5% by 2050 — rents likely to lag national; underwrite the cash flow, not the appreciation.
- At projected returns (-3.0% appreciation + 3.0% rent growth), your $28k cash investment doubles in ~5 years — after that, you're playing with house money.
Negotiation context
- It's been on market 43 days — a 3% lower offer ($97k) is reasonable based on typical stale-listing flexibility.
- Current owner paid $6k; list at $100k implies a 1437% gain — meaningful room to come down on a strong offer.
Risks & watch-outs
- Watch-outs: built in 1929 — expect roof / HVAC / electrical / plumbing capex.
- Climate carrying-cost: major wildfire risk — expect insurance premiums to compound above CPI over the hold.
Questions for the listing agent
- It's been on market 43 days. Have you received any prior offers? Is the seller open to a 3% concession, seller financing, or rate buy-down credit?
- Built in 1929 — when were the roof, HVAC, electrical panel, plumbing, and water heater last replaced?
- Is there a deadline driving the sale (1031 exchange, divorce, estate, relocation)? That informs how much negotiation room exists.
- Schools are F-rated, which usually means shorter tenancies and higher turnover. Who's the typical renter profile here, and what's been the actual vacancy rate?
- Crime grade is D in this area — have there been break-ins, vandalism, or insurance claims at this property in the last 3 years? What carrier currently insures it and at what premium?
- What's the average days-on-market for RENTAL listings here right now (not sales)? A rising rental-DOM trend means longer vacancies and softer asking-rent achievability than the comps imply.
- What's the recent tenant-quality profile in this submarket — average credit score on applications, eviction rate, late-payment / NSF rate, and stable-employment percentage? A property-management company in the area should have these aggregated.
- How much new for-sale + rental construction is in the pipeline within 1–3 miles? Heavy new supply typically softens prices + rents 12–24 months out; constrained supply supports both.
Investment metrics
- 1% rule
- 1.63% ✓
- Cap rate
- 14.46%
- Cash-on-cash
- 29.16%
- DSCR
- 2.30
- GRM
- 5.1
CMA / ARV
- ARV (median comp)
- $205,680
- List price
- $99,900
- Delta
- -51.43%
- Verdict
- UNDERPRICED
- Comps
- 5 within 1.0 mi
Projected returns pro-forma
-3.0% appreciation · 3.0% rent growth · sell at horizon
- IRR
- 23.5%
- Equity multiple
- 1.97×
- Total profit
- $27,073
- Equity at exit
- $14,895
- IRR
- 31.4%
- Equity multiple
- 3.83×
- Total profit
- $79,211
- Equity at exit
- $8,638
Cash invested: $27,972 (down + closing). Projections, not guarantees.
Landlord ↔ Tenant lean methodology
- Overall (STATE)
- 87 Strongly Landlord-Friendly
- State Tennessee
- 87 Strongly Landlord-Friendly · R+13
- County
- — inherits STATE
- City
- — inherits STATE
ZIP-level market 37618
- Home prices YoY
- -12.6%
- Active inventory
- 112
- Price-to-rent
- 5.1×
Monthly cashflow live
- Estimated rent
- $1,631 medium interval (Pro) →
- Mortgage (P&I)
- −$524
- Tax from tax record
- −$44 /mo · $524/yr
- Insurance
- −$42
- HOA
- −$0
- Vacancy / Maint / Mgmt
- −$343
- Net cashflow
- $680
Break-even live
UW: 25.0% down · 7.5% · 30yr · 1.5% tax · 5.0% vac · 8.0% maint · 8.0% mgmt
Financing live
Cash to close
- Down payment
- $24,975
- Closing costs
- $2,997
- Reserves months
- —
- Total cash needed
- —
Loan-product check · same deal, 3 products live
Conventional
25% down · 7.5% · 30yr
- Down + closing
- —
- Monthly P&I
- —
- Monthly cashflow
- —
- DSCR
- —
- Eligible?
- —
Personal DTI + credit; lowest rate.
DSCR
20% down · 8.5% · 30yr
- Down + closing
- —
- Monthly P&I
- —
- Monthly cashflow
- —
- DSCR
- —
- Eligible?
- —
No personal income docs; deal must DSCR.
Hard money
10% down · 12.0% · 12mo
- Down + closing
- —
- Monthly P&I
- —
- Monthly cashflow
- —
- DSCR
- —
- Eligible?
- —
Short-term bridge; refi at stabilization.
Listing history 17 events
-
2026-06-19days on market $99,900 Active 43 DOM
-
2026-06-18days on market $99,900 Active 42 DOM
-
2026-06-17days on market $99,900 Active 41 DOM
-
2026-06-16days on market $99,900 Active 40 DOM
-
2026-06-15pricedays on market $99,900 Active 39 DOM
-
2026-06-14days on market $104,900 Active 37 DOM
-
2026-06-13days on market $104,900 Active 36 DOM
-
2026-06-10days on market $104,900 Active 34 DOM
-
2026-06-09days on market $104,900 Active 33 DOM
-
2026-06-08days on market $104,900 Active 32 DOM
-
2026-06-07days on market $104,900 Active 31 DOM
-
2026-06-02days on market $104,900 Active 26 DOM
-
2026-06-01days on market $104,900 Active 25 DOM
-
2026-05-31days on market $104,900 Active 24 DOM
-
2026-05-30days on market $104,900 Active 23 DOM
-
2026-05-07$104,900 Active 1283-char remark
-
1978-03-23soldstatus $6,500
ⓘ Source: listings_history table (triggers on properties + properties_extension) + one-shot
backfill from property_details.listing_events for pre-trigger history.
Tax reassessment forecast TN · Resets to sale price
- Current annual tax
- $524 · $44/mo
- Projected year-2 tax
- $709 · $59/mo
- Expected delta
- +$185/yr (+$15/mo · 35.4%)
ⓘ Screening estimate from a state-policy table — verify with the county assessor before closing.
Climate risk First Street
- Flood 1/10 Low FEMA zone X (unshaded) · 0% chance over 30 yrs
- Wildfire 6/10 Major
- Heat 4/10 Moderate 8 d/yr ≥93°F today · 23 d/yr by 30 yrs out
- Wind 2/10 Low
- Air quality 2/10 Low 1 unhealthy d/yr today · 1 by 30 yrs out
Nearby sold comps map
Loading sold comps map…
Walkable amenities ~0.75 mi
Loading nearby amenities…
Taxation est. · year 1
- Rental income
- $19,577
- − Mortgage interest
- −$5,596
- − Property taxes
- −$524
- − Insurance
- −$500
- − Repairs & maintenance
- −$1,566
- − Management
- −$1,566
- − Depreciation
- −$2,906
- Taxable income
- $6,919
- Est. tax owed @ 24.0%
- −$1,661
- After-tax cash flow
- $6,495/yr
For passive investors: Depreciation is non-cash, so a rental often shows a tax loss while cash-flowing — sheltering income. Rental losses are passive: they offset passive income freely, and up to $25,000/yr can offset ordinary (W-2) income if you actively participate and your MAGI is under $100k (phasing out to $0 by $150k); unused losses carry forward. On sale, claimed depreciation is recaptured at up to 25%, and gains may owe capital-gains tax (a 1031 exchange can defer both). Figures are a year-1 estimate at your 24.0% rate — not tax advice; consult a CPA.
Schools (NCES district)
- District
- Sullivan County
- NCES district ID
- 4703990
- Math proficiency
- 17% ▼ -15.00%
- Reading proficiency
- 24% ▼ -10.00%
- Median HH income
- $43,263
- Composite
- 17.66/100
- National rank
- #9030
- State rank
- #109 of 139 in TN
Livability — Bluff City
- Score
- 55/100
- State rank
- #361
- US rank
- #23468
Category grades
Schools grade is shown separately in the Schools card above.
Census & demographics
- Population (ZIP)
- 13,208
Population outlook (Sullivan County) Hauer SSP2
- Today (2025)
- 157,030 people
- By 2030
- 156,415 · -0.4%
- By 2040
- 153,778 · -2.1%
- By 2050
- 149,018 · -5.1%
- By 2075
- 138,068 · -12.1%
- By 2100
- 119,927 · -23.6%
Race, ethnicity, and origin ACS 2023
- Neighborhood character
- Predominantly White (94%)
- Race & ethnicity
- White 94% Black 2% Two or more races 2% Hispanic / Latino 1%
- Common ancestry
- Serbian 3% Slovak 3% Lithuanian 1%
- Foreign-born
- 2% · Canada
- Languages at home
- 98% English-only · Spanish 2%
Political lean MEDSL · Sullivan
- 2024 margin
- Solid R (+55.0) · D 22.0% · R 77.0% · Other 1.0%
- 2008→2024 swing
- -13.6pp toward R · 2008: -41.3pp · 2024: -55.0pp
- All cycles
- 2024: R+55.0 2020: R+51.9 2016: R+56.2 2012: R+47.2 2008: R+41.3
Not yet ingested
- Civics
- —
Market trends
- HPI YoY
- ▼ -42.39%
- Current HPI
- 293.491
- Rent YoY
- —
- Metro
- —
- State GDP YoY
- ▲ 2.78%
- F500 in state
- 22
Industry mix (Fortune 500 HQ in TN)
| Industry | F500 HQs | Revenue |
|---|---|---|
| Healthcare | 3 | $91B |
|
||
| Retail | 3 | $72B |
|
||
| Transportation / Logistics | 1 | $88B |
|
||
| Paper / Packaging | 1 | $19B |
|
||
| Insurance | 1 | $13B |
|
||
| Energy | 1 | $12B |
|
||
Price history
+1436.9% since first listed3 events — show timeline
- 2026-06-14 Price Changed $99,900 TVRMLS
- 2026-05-07 Listed $104,900 TVRMLS
- 1978-03-23 Sold (Public Records) $6,500 Public Records
Property tax history
+5.5%/yrLatest (2025): $524 · +18.8% YoY. Source: county tax records.
Cash-flow waterfall
monthlySold comps — $/sqft
last 12 mo · ≤1 miLoading sold comps…