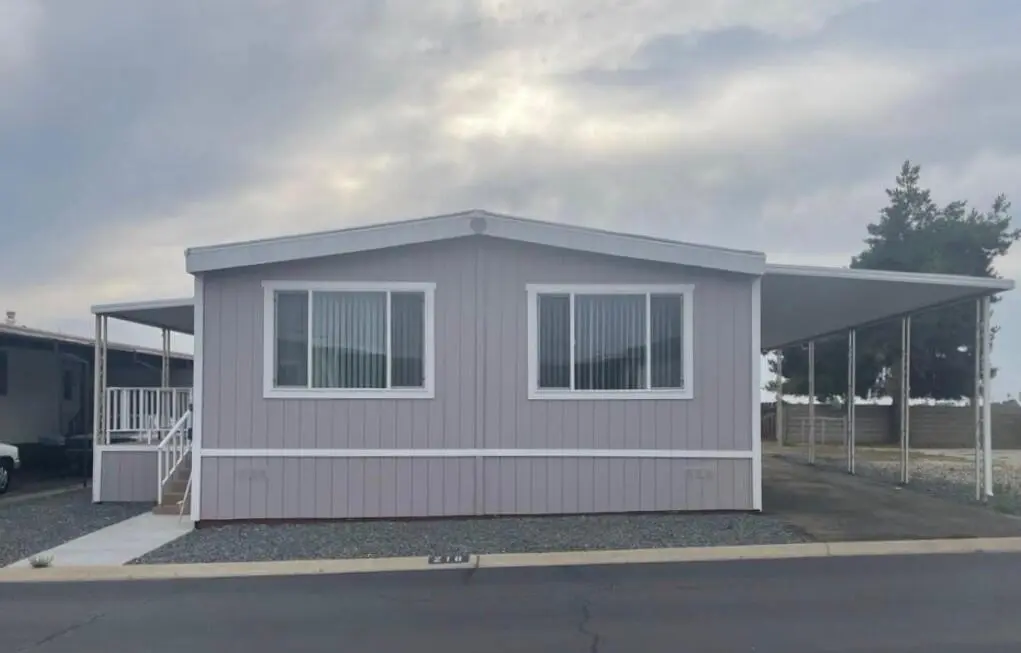
720 E Worth Ave #218 · Porterville, CA
Flood risk 1/10 · Minimal
- FEMA flood zone
- X (unshaded)
- Chance of flooding over 30 yrs
- 0.0%
- Est. flood insurance / yr
- $507 – $1,088
Fire risk 9/10 · Severe
- Est. fire insurance / yr
- $659 – $1,223
Heat risk 8/10 · Major
- Hot days now (above 105°F)
- 7 days/yr
- Hot days in 30 yrs
- 19 days/yr
Wind risk 1/10 · Minimal
- Chance of severe wind over 30 yrs
- —
Air-quality risk 10/10 · Severe
- Unhealthy air days now
- 38 days/yr
- Unhealthy air days in 30 yrs
- 42 days/yr
Risk factors via First Street. Map © Google.
Why this score? — see what drove the B grade
The composite is a weighted blend of 9 inputs, each scored 0–100. Each bar is that input's sub-score; the figure is the points it added to the 100-point composite (weight × sub-score).
- Cash flow +30.0/30.0
- 1% rule +10.0/10.0
- DSCR +10.0/10.0
- ARV discount +8.2/15.0
- Condition / age +4.0/5.0
- Rent growth +3.5/5.0
- Livability +3.0/5.0
- Schools +2.8/10.0
- Appreciation +0.0/10.0
$65,000
🖨 Deal sheet 📄 Offer letter ✓ Due diligence
Listing remarks MLS
Welcome to this beautifully updated manufactured home offering comfort, style, and space in a peaceful 55+ mobile home park. Added bonus is the covered porch and carport for your convenience. Roof was replaced in 2024 plus a newer Air Conditioner. Bright & Open Floor Plan. Perfect for relaxed living and entertaining. Spacious kitchen with abundant cabinet space, large dining room and an added bonus area off the kitchen. Fresh Updates: Newer paint, carpet, and flooring throughout give the home a modern, move-in ready feel. Community Lifestyle: Enjoy the tranquility of a friendly, well-maintained neighborhood with amenities designed for active and social living. Whether you're relaxing indoors or enjoying the peaceful surroundings, this home is the perfect blend of comfort and convenience. Don't miss the opportunity to make this beautiful home yours, schedule a showing today!
Key facts
- Covered porch
- Large dining room
- Spacious kitchen
Tags
Neighborhood map
What this means for you Summary
Snapshot
- This is a 2-bed/2.0-bath manufactured listed at $65k. Condition is rated good.
Deal economics
- At list price, monthly cash flow is $609 ($7k/yr) — positive.
- The deal already cash-flows at list — no discount required.
- Meets the 1% rule at list price ($1k rent vs $65k).
- Recommended offer: $57k (12.0% below list) — sets the bar for market timing.
- Cap rate 17.5% vs local median 2.7% in Porterville — top-decile yield for the area; either an underpriced asset or a hidden risk that comps aren't pricing in. Stress-test before assuming the spread holds.
Location & tenants
- Location reads 60/100 on livability (#561 in CA) — a middle-class / working-renter tenant base. Strengths: housing A, commute A-; Watch: crime C-, cost of living D+, schools F.
- Porterville Unified (urban): math 18% / reading 50% proficiency, ranked #302 of 517 in CA (top 58%) — families likely to look elsewhere, expect single-tenant / working-renter base with shorter leases; 84% free/reduced lunch — lower-income household profile, screen leases tightly.
- Market conditions: Rents rising fast (+4.1%/yr); 320 active listings in the ZIP; 1 comparable units currently listed for rent nearby; 1,447 units permitted in Tulare County in 2024 (307 in 5+ unit buildings).
Forward outlook
- Local home prices are declining (-3.0%/yr); year-one equity from $449 of loan paydown is wiped out by about $2k of value loss. Plan a longer hold.
- Tulare County population projected at +10% by 2050 — modest demand growth; plan on rents tracking national, not racing it.
- At projected returns (-3.0% appreciation + 4.1% rent growth), your $18k cash investment doubles in ~3 years — after that, you're playing with house money.
Negotiation context
- It's been on market 206 days — a 12% lower offer ($57k) is reasonable based on typical stale-listing flexibility.
- 2 sale attempts since 4y ago; this cycle's ask has dropped $15k (19%) from the opening price — seller is motivated, your offer sets the floor, not the list.
- Current owner paid $55k; 18% above their basis — modest negotiation headroom, anchor on the comps not their cost.
Risks & watch-outs
- Climate carrying-cost: severe wildfire risk; extreme-heat days projected 7→19/yr by 2055 (HVAC capex compounding) — expect insurance premiums to compound above CPI over the hold.
Questions for the listing agent
- It's been on market 206 days. Have you received any prior offers? Is the seller open to a 12% concession, seller financing, or rate buy-down credit?
- Built in 1974 — when were the roof, HVAC, electrical panel, plumbing, and water heater last replaced?
- Why hasn't it sold? Are there any deal-killer items the seller is aware of (foundation, flood, title, zoning, code violations)?
- Is there a deadline driving the sale (1031 exchange, divorce, estate, relocation)? That informs how much negotiation room exists.
- Schools are F-rated, which usually means shorter tenancies and higher turnover. Who's the typical renter profile here, and what's been the actual vacancy rate?
- What's the average days-on-market for RENTAL listings here right now (not sales)? A rising rental-DOM trend means longer vacancies and softer asking-rent achievability than the comps imply.
- What's the recent tenant-quality profile in this submarket — average credit score on applications, eviction rate, late-payment / NSF rate, and stable-employment percentage? A property-management company in the area should have these aggregated.
- How much new for-sale + rental construction is in the pipeline within 1–3 miles? Heavy new supply typically softens prices + rents 12–24 months out; constrained supply supports both.
Investment metrics
- 1% rule
- 2.06% ✓
- Cap rate
- 17.53%
- Cash-on-cash
- 40.12%
- DSCR
- 2.79
- GRM
- 4.0
CMA / ARV
- ARV (median comp)
- $66,009
- List price
- $65,000
- Delta
- -1.53%
- Verdict
- FAIR
- Comps
- 5 within 1.0 mi
Show comp detail 10 sales within ~0.75 mi
| Address | Dist | Beds/Ba | Sqft | Sold | Price | $/sf | Match |
|---|---|---|---|---|---|---|---|
| 720 E Worth Ave #48 | 0.00mi | 2/2.0 | 1,440 (0%) | 11mo | $60,000 | $42 | 91 |
| 720 E Worth Ave #64 | 0.00mi | 2/2.0 | 1,440 (0%) | 22mo | $89,900 | $62 | 82 |
| 720 E Worth Ave #118 | 0.00mi | 2/2.0 | 1,536 (+7%) | 9mo | $72,000 | $47 | 82 |
| 720 E Worth Ave #36 | 0.00mi | 2/2.0 | 1,440 (0%) | 22mo | $70,000 | $49 | 81 |
| 720 E Worth Ave #28 | 0.00mi | 3/2.0 (+1) | 1,440 (0%) | 20mo | $75,000 | $52 | 79 |
| 720 E Worth Ave | 0.36mi | 2/2.0 | 1,440 (0%) | 11mo | $60,000 | $42 | 74 |
| 720 E Worth Ave #193 | 0.00mi | 2/2.0 | 1,316 (-9%) | 16mo | $80,000 | $61 | 72 |
| 720 E Worth Ave #14 | 0.00mi | 3/2.0 (+1) | 1,248 (-13%) | 6mo | $80,000 | $64 | 68 |
| 720 E Worth Ave #224 | 0.00mi | 3/2.0 (+1) | 1,344 (-7%) | 20mo | $82,000 | $61 | 67 |
| 720 E Worth Ave #127 | 0.00mi | 3/2.0 (+1) | 1,248 (-13%) | 10mo | $67,000 | $54 | 64 |
Match score weights: distance 35% · size 25% · config 20% · recency 20%. Top-matched comps best support the ARV.
Projected returns pro-forma
-3.0% appreciation · 4.07% rent growth · sell at horizon
- IRR
- 37.7%
- Equity multiple
- 2.63×
- Total profit
- $29,702
- Equity at exit
- $9,692
- IRR
- 44.8%
- Equity multiple
- 5.50×
- Total profit
- $81,962
- Equity at exit
- $5,620
Cash invested: $18,200 (down + closing). Projections, not guarantees.
Landlord ↔ Tenant lean methodology
- Overall (STATE)
- 18 Strongly Tenant-Friendly
- State California
- 18 Strongly Tenant-Friendly · D+13
- County
- — inherits STATE
- City
- — inherits STATE
ZIP-level market 93257
- Rents YoY
- 4.1%
- Active inventory
- 320
- Price-to-rent
- 4.0×
Monthly cashflow live
- Estimated rent
- $1,339 medium interval (Pro) →
- Mortgage (P&I)
- −$341
- Tax est. 1.5%
- −$81 /mo · $975/yr
- Insurance
- −$27
- HOA
- −$0
- Vacancy / Maint / Mgmt
- −$281
- Net cashflow
- $609
Break-even live
UW: 25.0% down · 7.5% · 30yr · 1.5% tax · 5.0% vac · 8.0% maint · 8.0% mgmt
Financing live
Cash to close
- Down payment
- $16,250
- Closing costs
- $1,950
- Reserves months
- —
- Total cash needed
- —
Loan-product check · same deal, 3 products live
Conventional
25% down · 7.5% · 30yr
- Down + closing
- —
- Monthly P&I
- —
- Monthly cashflow
- —
- DSCR
- —
- Eligible?
- —
Personal DTI + credit; lowest rate.
DSCR
20% down · 8.5% · 30yr
- Down + closing
- —
- Monthly P&I
- —
- Monthly cashflow
- —
- DSCR
- —
- Eligible?
- —
No personal income docs; deal must DSCR.
Hard money
10% down · 12.0% · 12mo
- Down + closing
- —
- Monthly P&I
- —
- Monthly cashflow
- —
- DSCR
- —
- Eligible?
- —
Short-term bridge; refi at stabilization.
Rent comps 1 comps
| Address | Beds | Baths | Sqft | Rent | $/sqft | DOM | Units | Dist |
|---|---|---|---|---|---|---|---|---|
| 195 E Mountain View Ave Porterville, CA | 2.0 | 1.0 | 1075 | $1,200 | $1.12 | 21d | 1 | 0.86mi |
Listing history 23 events
-
2026-06-18days on market $65,000 Active 206 DOM
-
2026-06-17days on market $65,000 Active 205 DOM
-
2026-06-16days on market $65,000 Active 204 DOM
-
2026-06-15days on market $65,000 Active 203 DOM
-
2026-06-14days on market $65,000 Active 201 DOM
-
2026-06-13days on market $65,000 Active 200 DOM
-
2026-06-10days on market $65,000 Active 198 DOM
-
2026-06-09days on market $65,000 Active 197 DOM
-
2026-06-08days on market $65,000 Active 196 DOM
-
2026-06-07days on market $65,000 Active 195 DOM
-
2026-06-05days on market $65,000 Active 192 DOM
-
2026-06-03pricedays on market $65,000 Active 191 DOM
-
2026-06-02days on market $70,000 Active 190 DOM
-
2026-06-01days on market $70,000 Active 189 DOM
-
2026-05-31days on market $70,000 Active 188 DOM
-
2026-05-30days on market $70,000 Active 187 DOM
-
2026-05-18status Pending 892-char remark
Show marketing remark (892 chars)
Welcome to this beautifully updated manufactured home offering comfort, style, and space in a peaceful 55+ mobile home park. Added bonus is the covered porch and carport for your convenience. Roof was replaced in 2024 plus a newer Air Conditioner. Bright & Open Floor Plan. Perfect for relaxed living and entertaining. Spacious kitchen with abundant cabinet space, large dining room and an added bonus area off the kitchen. Fresh Updates: Newer paint, carpet, and flooring throughout give the home a modern, move-in ready feel. Community Lifestyle: Enjoy the tranquility of a friendly, well-maintained neighborhood with amenities designed for active and social living. Whether you're relaxing indoors or enjoying the peaceful surroundings, this home is the perfect blend of comfort and convenience. Don't miss the opportunity to make this beautiful home yours, schedule a showing today!
-
2025-11-14$80,000 Active 892-char remark
Show marketing remark (892 chars)
Welcome to this beautifully updated manufactured home offering comfort, style, and space in a peaceful 55+ mobile home park. Added bonus is the covered porch and carport for your convenience. Roof was replaced in 2024 plus a newer Air Conditioner. Bright & Open Floor Plan. Perfect for relaxed living and entertaining. Spacious kitchen with abundant cabinet space, large dining room and an added bonus area off the kitchen. Fresh Updates: Newer paint, carpet, and flooring throughout give the home a modern, move-in ready feel. Community Lifestyle: Enjoy the tranquility of a friendly, well-maintained neighborhood with amenities designed for active and social living. Whether you're relaxing indoors or enjoying the peaceful surroundings, this home is the perfect blend of comfort and convenience. Don't miss the opportunity to make this beautiful home yours, schedule a showing today!
-
2022-11-23soldstatus $55,000 Closed 284-char remark
Show marketing remark (284 chars)
MOVE-IN READY!!! Here is your chance to own this fabulous, updated home with an open floor plan! 2/2 with a large deck, inside laundry, dining room, 2 living spaces, dining room, and lots of storage. Park is 55+, gated, with updated clubhouse, 2 pools, spa, billiards, and much more!
-
2022-07-11status Pending 284-char remark
Show marketing remark (284 chars)
MOVE-IN READY!!! Here is your chance to own this fabulous, updated home with an open floor plan! 2/2 with a large deck, inside laundry, dining room, 2 living spaces, dining room, and lots of storage. Park is 55+, gated, with updated clubhouse, 2 pools, spa, billiards, and much more!
-
2022-04-28$57,000 Active 284-char remark
Show marketing remark (284 chars)
MOVE-IN READY!!! Here is your chance to own this fabulous, updated home with an open floor plan! 2/2 with a large deck, inside laundry, dining room, 2 living spaces, dining room, and lots of storage. Park is 55+, gated, with updated clubhouse, 2 pools, spa, billiards, and much more!
-
2022-04-25soldstatus $50,000
-
2021-02-02soldstatus $32,000
ⓘ Source: listings_history table (triggers on properties + properties_extension) + one-shot
backfill from property_details.listing_events for pre-trigger history.
Climate risk First Street
- Flood 1/10 Low FEMA zone X (unshaded) · 0% chance over 30 yrs
- Wildfire 9/10 Extreme
- Heat 8/10 Severe 7 d/yr ≥105°F today · 19 d/yr by 30 yrs out
- Wind 1/10 Low
- Air quality 10/10 Extreme 38 unhealthy d/yr today · 42 by 30 yrs out
Nearby sold comps map
Loading sold comps map…
Walkable amenities ~0.75 mi
Loading nearby amenities…
Taxation est. · year 1
- Rental income
- $16,067
- − Mortgage interest
- −$3,641
- − Property taxes
- −$975
- − Insurance
- −$325
- − Repairs & maintenance
- −$1,285
- − Management
- −$1,285
- − Depreciation
- −$1,891
- Taxable income
- $6,664
- Est. tax owed @ 24.0%
- −$1,599
- After-tax cash flow
- $5,703/yr
For passive investors: Depreciation is non-cash, so a rental often shows a tax loss while cash-flowing — sheltering income. Rental losses are passive: they offset passive income freely, and up to $25,000/yr can offset ordinary (W-2) income if you actively participate and your MAGI is under $100k (phasing out to $0 by $150k); unused losses carry forward. On sale, claimed depreciation is recaptured at up to 25%, and gains may owe capital-gains tax (a 1031 exchange can defer both). Figures are a year-1 estimate at your 24.0% rate — not tax advice; consult a CPA.
Condition & rehab AI · 12 photos
This beautifully updated manufactured home offers a good condition with fresh updates, making it a move-in ready property.
Value-add opportunities
- Both painting — Fresh paint enhances curb appeal and interior aesthetics
- Both new flooring — Updated flooring improves both resale and rental value
- Both new kitchen appliances — Modern appliances attract more buyers and renters
Renovation cost estimate screening
Value-add ROI direction
- Both painting — Fresh paint enhances curb appeal and interior aesthetics ↑
- Both new flooring — Updated flooring improves both resale and rental value ↑
- Both new kitchen appliances — Modern appliances attract more buyers and renters ↑
ⓘ Cost ranges are severity-bucket heuristics (US national rule-of-thumb). Get contractor quotes + a written scope before underwriting a rehab budget.
Schools (NCES district)
- District
- Porterville Unified
- NCES district ID
- 0600064
- Math proficiency
- 18% ▼ -10.00%
- Reading proficiency
- 50% ▲ 6.00%
- Median HH income
- $35,157
- Composite
- 27.97/100
- National rank
- #6855
- State rank
- #302 of 517 in CA
Livability — Porterville
- Score
- 60/100
- State rank
- #561
- US rank
- #18537
Category grades
Schools grade is shown separately in the Schools card above.
Census & demographics
- County
- Tulare County · 323,826 people
- City population
- 80,467
- Metro
- Visalia, CA
- Population (ZIP)
- 80,467
- Household income
- $59,704
- Rent vs Own
- Severe rent burden
- 3028.0
Population outlook (Tulare County) Hauer SSP2
- Today (2025)
- 484,681 people
- By 2030
- 496,241 · +2.4%
- By 2040
- 518,507 · +7.0%
- By 2050
- 534,920 · +10.4%
- By 2075
- 548,417 · +13.2%
- By 2100
- 513,085 · +5.9%
Race, ethnicity, and origin ACS 2023
- Neighborhood character
- Predominantly Hispanic (72%)
- Race & ethnicity
- Hispanic / Latino 72% Two or more races 23% White 21% Native American 3% Asian 2%
- Hispanic origin (detail)
- Mexican 69%
- Common ancestry
- Iranian 1%
- Foreign-born
- 26% · Canada
- Languages at home
- 45% English-only · Spanish 52% Tagalog/Filipino 1% Arabic 1%
Political lean MEDSL · Tulare
- 2024 margin
- Strong R (+20.7) · D 38.5% · R 59.2% · Other 2.3%
- 2008→2024 swing
- -5.4pp toward R · 2008: -15.3pp · 2024: -20.7pp
- All cycles
- 2024: R+20.7 2020: R+7.8 2016: R+12.1 2012: R+17.8 2008: R+15.3
Not yet ingested
- Civics
- —
Market trends
- HPI YoY
- ▼ -375.52%
- Current HPI
- 362.656
- Rent YoY
- ▲ 4.07%
- Metro
- Visalia, CA
- State GDP YoY
- ▲ 3.21%
- F500 in state
- 116
Industry mix (Fortune 500 HQ in CA)
| Industry | F500 HQs | Revenue |
|---|---|---|
| Technology | 27 | $1,492B |
|
||
| Financial Services | 3 | $174B |
|
||
| Retail | 3 | $44B |
|
||
| Insurance | 3 | $26B |
|
||
| Media / Entertainment | 2 | $115B |
|
||
| Pharmaceuticals / Biotech | 2 | $62B |
|
||
Price history
+150.0% since first listed7 events — show timeline
- 2026-05-18 Pending — TCMLS
- 2025-11-14 Listed $80,000 TCMLS
- 2022-11-23 Sold (MLS) $55,000 TCMLS
- 2022-07-11 Pending — TCMLS
- 2022-04-28 Listed $57,000 TCMLS
- 2022-04-25 Sold (MLS) $50,000 TCMLS
- 2021-02-02 Sold (MLS) $32,000 TCMLS
Cash-flow waterfall
monthlySold comps — $/sqft
last 12 mo · ≤1 miLoading sold comps…