6607 Alcove St · Odessa, TX
Flood risk 4/10 · Minor
- FEMA flood zone
- X (unshaded)
- Chance of flooding over 30 yrs
- 0.27%
- Est. flood insurance / yr
- $507 – $1,088
Fire risk 6/10 · Moderate
- Est. fire insurance / yr
- $1,222 – $2,270
Heat risk 6/10 · Moderate
- Hot days now (above 101°F)
- 7 days/yr
- Hot days in 30 yrs
- 22 days/yr
Wind risk 2/10 · Minimal
- Chance of severe wind over 30 yrs
- 3.0%
Air-quality risk 1/10 · Minimal
- Unhealthy air days now
- 0 days/yr
- Unhealthy air days in 30 yrs
- 0 days/yr
Risk factors via First Street. Map © Google.
Why this score? — see what drove the D grade
The composite is a weighted blend of 9 inputs, each scored 0–100. Each bar is that input's sub-score; the figure is the points it added to the 100-point composite (weight × sub-score).
- Cash flow +16.8/30.0
- DSCR +5.2/10.0
- 1% rule +5.0/10.0
- Livability +3.8/5.0
- Rent growth +2.8/5.0
- ARV discount +2.6/15.0
- Condition / age +2.5/5.0
- Schools +2.2/10.0
- Appreciation +0.0/10.0
$212,500
🖨 Deal sheet (PDF) 📄 Offer letter ✓ Due diligence
Listing remarks MLS
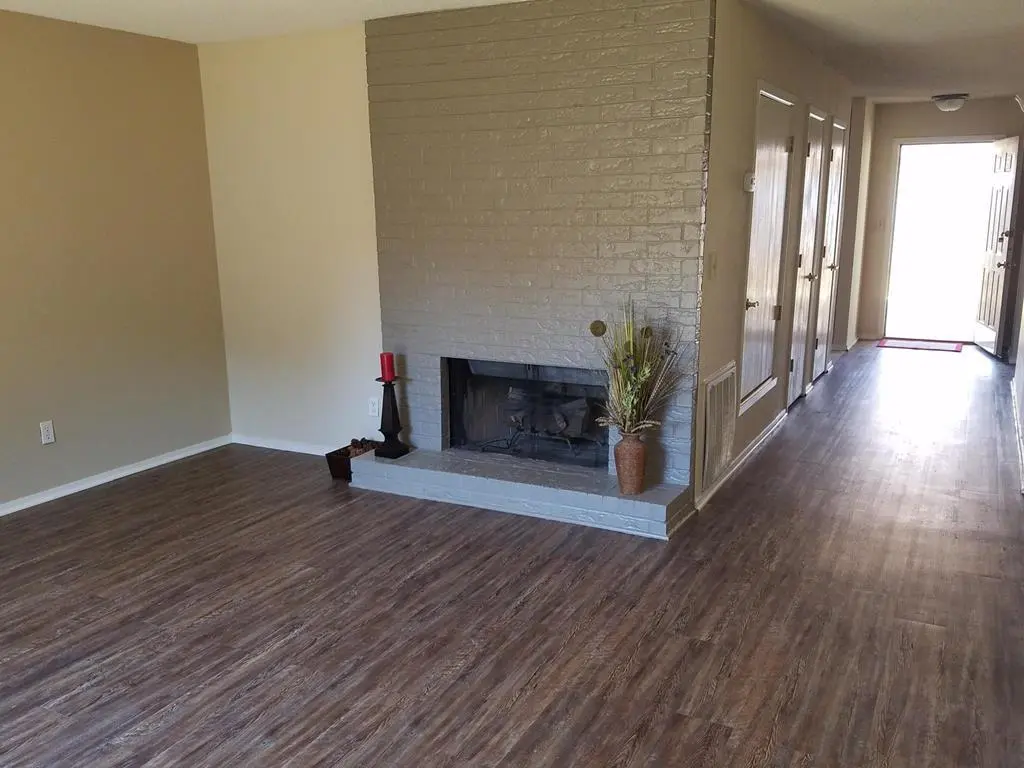
Perfect little townhouse with low mantainice kitchen updated new fence in front small front courtyard with atorage shed Check out his 2 bedroom 2 bath yard. Has a new roof, new flooring, new paint 2 bedrroom 2 bath with a lovely fireplace
Key facts
- Tall privacy fence
- Private front patio
- Quiet neighborhood
Tags
Neighborhood map
What this means for you Summary
Snapshot
- This is a 2-bed/2.0-bath other listed at $212k.
Deal economics
- At list price, monthly cash flow is $135 ($2k/yr) — positive.
- The deal already cash-flows at list — no discount required.
- To meet the 1% rule (rent ≥ 1% of price), the offer needs to be $212k (0.3% below list).
- Recommended offer: $193k (9.0% below list) — sets the bar for market timing.
Location & tenants
- Location reads 75/100 on livability (#132 in TX, #3,928 nationally) — a middle-class / working-renter tenant base. Strengths: cost of living A+, housing A+, health & safety A+; Watch: commute D+, amenities D.
- Ector County ISD (urban): math 22% / reading 27% proficiency, ranked #707 of 826 in TX (top 86%) — low school quality limits family demand, transient renter base, plan for 1-2y turnover.
- Zoned schools: L B Johnson El (math 26% / reading 27%, grade F, #2,927 of 4,322 statewide, top 68%, 517 students, 67% FRL); Ector College Prep Success Academy (math 18% / reading 24%, grade F, #1,387 of 1,662 statewide, top 85%, 1,384 students, 72% FRL, charter); Permian H S (math 19% / reading 29%, grade F, #1,333 of 1,632 statewide, top 82%, 3,978 students, 51% FRL).
- Market conditions: Rents rising (+1.4%/yr); 268 active listings in the ZIP; 14 comparable units currently listed for rent nearby; rentals lingering (median 46d on market — plan ~5-8 weeks vacancy on turnover, expect pricing pressure); 50% of comp listings sitting > 30 days — soft ceiling on asking rent; solid renter incomes; 1,004 units permitted in Ector County in 2024 (0 in 5+ unit buildings).
- This rent runs 34% of the median local income ($75k/yr) — at the standard rent-burdened threshold; future hikes will face affordability resistance.
Forward outlook
- Local home prices are declining (-3.0%/yr); year-one equity from $1k of loan paydown is wiped out by about $6k of value loss. Plan a longer hold.
- Ector County population projected at +78% by 2050 — long-run rental-demand tailwind backs the buy-and-hold thesis.
Negotiation context
- It's been on market 108 days — a 9% lower offer ($193k) is reasonable based on typical stale-listing flexibility.
- 4 sale attempts since 26y ago; this cycle's ask is 25% above the opening price — seller raised mid-cycle; expect resistance to lowballs.
Risks & watch-outs
- Climate carrying-cost: major wildfire risk; extreme-heat days projected 7→22/yr by 2055 (HVAC capex compounding) — expect insurance premiums to compound above CPI over the hold.
Questions for the listing agent
- It's been on market 108 days. Have you received any prior offers? Is the seller open to a 9% concession, seller financing, or rate buy-down credit?
- Why hasn't it sold? Are there any deal-killer items the seller is aware of (foundation, flood, title, zoning, code violations)?
- Is there a deadline driving the sale (1031 exchange, divorce, estate, relocation)? That informs how much negotiation room exists.
- Schools are F-rated, which usually means shorter tenancies and higher turnover. Who's the typical renter profile here, and what's been the actual vacancy rate?
- The area grade is low — what's the realistic commute time and amenity access for the typical tenant pool here? Any planned neighborhood developments (good or bad) we should know about?
- What's the average days-on-market for RENTAL listings here right now (not sales)? A rising rental-DOM trend means longer vacancies and softer asking-rent achievability than the comps imply.
- What's the recent tenant-quality profile in this submarket — average credit score on applications, eviction rate, late-payment / NSF rate, and stable-employment percentage? A property-management company in the area should have these aggregated.
- How much new for-sale + rental construction is in the pipeline within 1–3 miles? Heavy new supply typically softens prices + rents 12–24 months out; constrained supply supports both.
Investment metrics
- 1% rule
- 1.00% ✗
- Cap rate
- 7.05%
- Cash-on-cash
- 2.72%
- DSCR
- 1.12
- GRM
- 8.4
CMA / ARV
- ARV (median comp)
- $191,464
- List price
- $212,500
- Delta
- 10.99%
- Verdict
- OVERPRICED
- Comps
- 1 within 2.0 mi
Projected returns pro-forma
-3.0% appreciation · 1.36% rent growth · sell at horizon
- IRR
- -13.9%
- Equity multiple
- 0.51×
- Total profit
- $-29,207
- Equity at exit
- $31,684
- IRR
- -8.0%
- Equity multiple
- 0.53×
- Total profit
- $-27,723
- Equity at exit
- $18,373
Cash invested: $59,500 (down + closing). Projections, not guarantees.
Landlord ↔ Tenant lean methodology
- Overall (STATE)
- 87 Strongly Landlord-Friendly
- State Texas
- 87 Strongly Landlord-Friendly · R+5
- County
- — inherits STATE
- City
- — inherits STATE
ZIP-level market 79762
- Rents YoY
- 1.4%
- Active inventory
- 268
- Price-to-rent
- 8.4×
Monthly cashflow live
- Estimated rent
- $2,119 high interval (Pro) →
- Mortgage (P&I)
- −$1,114
- Tax from tax record
- −$336 /mo · $4,032/yr
- Insurance
- −$89
- HOA
- −$0
- Lot rent
- −$0
- Vacancy / Maint / Mgmt
- −$445
- Net cashflow
- $135
Break-even live
Sensitivity live
| Price | -10% $255 | -5% $195 | +0% $135 | +5% $75 | +10% $15 |
|---|---|---|---|---|---|
| Rent | -10% $-32 | -5% $51 | +0% $135 | +5% $219 | +10% $302 |
| Rate | -1.0pp $242 | -0.5pp $189 | base $135 | +0.5pp $80 | +1.0pp $24 |
UW: 25.0% down · 7.5% · 30yr · 1.5% tax · 5.0% vac · 8.0% maint · 8.0% mgmt
Financing live
Cash to close
- Down payment
- $53,125
- Closing costs
- $6,375
- Reserves months
- —
- Total cash needed
- —
Loan-product check · same deal, 3 products live
Conventional
25% down · 7.5% · 30yr
- Down + closing
- —
- Monthly P&I
- —
- Monthly cashflow
- —
- DSCR
- —
- Eligible?
- —
Personal DTI + credit; lowest rate.
DSCR
20% down · 8.5% · 30yr
- Down + closing
- —
- Monthly P&I
- —
- Monthly cashflow
- —
- DSCR
- —
- Eligible?
- —
No personal income docs; deal must DSCR.
Hard money
10% down · 12.0% · 12mo
- Down + closing
- —
- Monthly P&I
- —
- Monthly cashflow
- —
- DSCR
- —
- Eligible?
- —
Short-term bridge; refi at stabilization.
Rent comps 14 comps
| Address | Beds | Baths | Sqft | Rent | $/sqft | DOM | Units | Dist |
|---|---|---|---|---|---|---|---|---|
| 3001 Pointer Ln Unit 5B Odessa, TX | 3.0 | 2.5 | 1817 | $2,450 | $1.35 | 46d | 1 | 0.44mi |
| 3001 Pointer Ln Unit 12D Odessa, TX | 3.0 | 2.5 | 1704 | $2,800 | $1.64 | 23d | 1 | 0.47mi |
| 503 Old Course Rd Odessa, TX | 3.0 | 2.5 | 1731 | $2,200 | $1.27 | 15d | 1 | 0.53mi |
| 2201 Rocky Lane Rd Odessa, TX | 1.0–2.0 | 1.0–2.5 | 900 | $1,675 | $1.86 | 15d | 10 | 0.56mi |
| 1205 Old Course Rd Odessa, TX | 3.0 | 2.5 | 1731 | $2,100 | $1.21 | 46d | 1 | 0.61mi |
| 6500 Eastridge Rd Odessa, TX | 2.0–3.0 | 1.5–2.5 | 1222 | $1,570 | $1.28 | 15d | 4 | 0.67mi |
| 7204 Donatello St Odessa, TX | 3.0 | 2.0 | 1748 | $2,400 | $1.37 | 46d | 1 | 0.75mi |
| 3418 Rocky Lane Rd Odessa, TX | 2.0 | 2.0 | 1537 | $1,900 | $1.24 | 23d | 1 | 0.75mi |
| 7206 Raphael St Odessa, TX | 3.0 | 2.0 | 1743 | $2,800 | $1.61 | 46d | 1 | 0.77mi |
| 7309 Raphael St Odessa, TX | 3.0 | 2.0 | 1824 | $3,500 | $1.92 | 23d | 1 | 0.93mi |
| 7214 Barksdale Ln Odessa, TX | 3.0 | 2.0 | 1295 | $2,000 | $1.54 | 46d | 1 | 0.94mi |
| 7230 Barksdale Ln Odessa, TX | 3.0 | 2.0 | 1283 | $2,100 | $1.64 | 23d | 1 | 0.99mi |
| 105 Quail Run Odessa, TX | 3.0 | 2.0 | 1560 | $2,600 | $1.67 | 46d | 1 | 1.18mi |
| 1326 French Ave Unit A Odessa, TX | 2.0 | 1.5 | 1600 | $2,000 | $1.25 | 46d | 1 | 1.39mi |
Listing history 30 events
-
2026-06-23days on market $212,500 Active 108 DOM
-
2026-06-21days on market $212,500 Active 107 DOM
-
2026-06-19days on market $212,500 Active 105 DOM
-
2026-06-18days on market $212,500 Active 104 DOM
-
2026-06-17days on market $212,500 Active 103 DOM
-
2026-06-16days on market $212,500 Active 102 DOM
-
2026-06-15days on market $212,500 Active 101 DOM
-
2026-06-14pricedays on market $212,500 Active 99 DOM
-
2026-06-13days on market $214,900 Active 98 DOM
-
2026-06-10days on market $214,900 Active 96 DOM
-
2026-06-09days on market $214,900 Active 95 DOM
-
2026-06-08days on market $214,900 Active 94 DOM
-
2026-06-07days on market $214,900 Active 93 DOM
-
2026-06-01days on market $214,900 Active 88 DOM
-
2026-05-31days on market $214,900 Active 87 DOM
-
2026-05-30days on market $214,900 Active 86 DOM
-
2026-05-12price $214,900
-
2026-04-28price $217,900
-
2026-04-01price $219,900
-
2018-04-16soldstatus
-
2018-04-13soldstatus 239-char remark
Show marketing remark (239 chars)
Perfect little townhouse with low mantainice kitchen updated new fence in front small front courtyard with atorage shed Check out his 2 bedroom 2 bath yard. Has a new roof, new flooring, new paint 2 bedrroom 2 bath with a lovely fireplace
-
2018-03-28$169,900 239-char remark
Show marketing remark (239 chars)
Perfect little townhouse with low mantainice kitchen updated new fence in front small front courtyard with atorage shed Check out his 2 bedroom 2 bath yard. Has a new roof, new flooring, new paint 2 bedrroom 2 bath with a lovely fireplace
-
2012-05-01soldstatus
-
2012-04-30soldstatus
-
2012-03-14$127,500
-
2003-04-03soldstatus
-
2003-04-03soldstatus
-
2003-02-12$70,000
-
2000-06-29soldstatus
-
2000-05-01$57,900
ⓘ Source: listings_history table (triggers on properties + properties_extension) + one-shot
backfill from property_details.listing_events for pre-trigger history.
Tax reassessment forecast TX · Resets to sale price
- Current annual tax
- $4,032 · $336/mo
- Projected year-2 tax
- $4,032 · $336/mo
- Expected delta
- $0/yr ($0/mo · 0.0%)
ⓘ Screening estimate from a state-policy table — verify with the county assessor before closing.
Climate risk First Street
- Flood 4/10 Moderate FEMA zone X (unshaded) · 27% chance over 30 yrs
- Wildfire 6/10 Major
- Heat 6/10 Major 7 d/yr ≥101°F today · 22 d/yr by 30 yrs out
- Wind 2/10 Low 3% chance of damaging wind over 30 yrs
- Air quality 1/10 Low 0 unhealthy d/yr today · 0 by 30 yrs out
Nearby sold comps map
Loading sold comps map…
Walkable amenities ~0.75 mi
Loading nearby amenities…
Taxation est. · year 1
- Rental income
- $25,425
- − Mortgage interest
- −$11,903
- − Property taxes
- −$4,032
- − Insurance
- −$1,062
- − Repairs & maintenance
- −$2,034
- − Management
- −$2,034
- − Depreciation
- −$6,182
- Taxable loss
- −$1,823
- Est. tax savings @ 24.0%
- +$437
- After-tax cash flow
- $2,056/yr
For passive investors: Depreciation is non-cash, so a rental often shows a tax loss while cash-flowing — sheltering income. Rental losses are passive: they offset passive income freely, and up to $25,000/yr can offset ordinary (W-2) income if you actively participate and your MAGI is under $100k (phasing out to $0 by $150k); unused losses carry forward. On sale, claimed depreciation is recaptured at up to 25%, and gains may owe capital-gains tax (a 1031 exchange can defer both). Figures are a year-1 estimate at your 24.0% rate — not tax advice; consult a CPA.
Schools (NCES district)
- District
- Ector County ISD
- NCES district ID
- 4818000
- Math proficiency
- 22% ▼ -9.00%
- Reading proficiency
- 27% ▼ -4.00%
- Median HH income
- $52,740
- Composite
- 21.89/100
- National rank
- #8233
- State rank
- #707 of 826 in TX
Livability — Odessa
- Score
- 75/100
- State rank
- #132
- US rank
- #3928
Category grades
Schools grade is shown separately in the Schools card above.
Census & demographics
- Census place
- Odessa, TX
- County
- Ector County · 131,169 people
- City population
- 131,169
- Metro
- Odessa, TX
- Population (ZIP)
- 39,927
- Household income
- $75,272
- Rent vs Own
- Severe rent burden
- 1477.0
Population outlook (Ector County) Hauer SSP2
- Today (2025)
- 212,765 people
- By 2030
- 241,962 · +13.7%
- By 2040
- 306,582 · +44.1%
- By 2050
- 379,755 · +78.5%
- By 2075
- 568,991 · +167.4%
- By 2100
- 709,829 · +233.6%
Race, ethnicity, and origin ACS 2023
- Neighborhood character
- Diverse neighborhood (Simpson 0.58)
- Race & ethnicity
- Hispanic / Latino 52% White 38% Two or more races 22% Black 6% Asian 2% Native American 1%
- Hispanic origin (detail)
- Mexican 45% Cuban 3%
- Common ancestry
- Slovak 1% Lithuanian 1% Italian 1%
- Foreign-born
- 12% · Canada, Vietnam
- Languages at home
- 68% English-only · Spanish 30%
Political lean MEDSL · Ector
- 2024 margin
- Solid R (+52.9) · D 23.2% · R 76.1%
- 2008→2024 swing
- -4.9pp toward R · 2008: -48.0pp · 2024: -52.9pp
- All cycles
- 2024: R+52.9 2020: R+47.8 2016: R+40.6 2012: R+48.9 2008: R+48.0
Not yet ingested
- Civics
- —
Market trends
- HPI YoY
- ▼ -194.97%
- Current HPI
- 229.6022
- Rent YoY
- ▲ 1.36%
- Metro
- Odessa, TX
- State GDP YoY
- ▲ 3.95%
- F500 in state
- 110
Industry mix (Fortune 500 HQ in TX)
| Industry | F500 HQs | Revenue |
|---|---|---|
| Energy | 16 | $1,198B |
|
||
| Technology | 5 | $198B |
|
||
| Engineering / Construction | 4 | $72B |
|
||
| Energy Services | 3 | $60B |
|
||
| Utilities | 3 | $41B |
|
||
| Healthcare | 2 | $330B |
|
||
Price history
+271.2% since first listed14 events — show timeline
- 2026-05-12 Price Changed $214,900 ODMLS
- 2026-04-28 Price Changed $217,900 ODMLS
- 2026-04-01 Price Changed $219,900 ODMLS
- 2018-04-16 Sold (Public Records) — Public Records
- 2018-04-13 Sold (MLS) — ODMLS
- 2018-03-28 Listed $169,900 ODMLS
- 2012-05-01 Sold (Public Records) — Public Records
- 2012-04-30 Sold (MLS) — ODMLS
- 2012-03-14 Listed $127,500 ODMLS
- 2003-04-03 Sold (Public Records) — Public Records
- 2003-04-03 Sold (MLS) — ODMLS
- 2003-02-12 Listed $70,000 ODMLS
- 2000-06-29 Sold (MLS) — ODMLS
- 2000-05-01 Listed $57,900 ODMLS
Property tax history
+4.4%/yrLatest (2025): $4,032 · +6.5% YoY. Source: county tax records.
Cash-flow waterfall
monthlySold comps — $/sqft
last 12 mo · ≤1 miLoading sold comps…