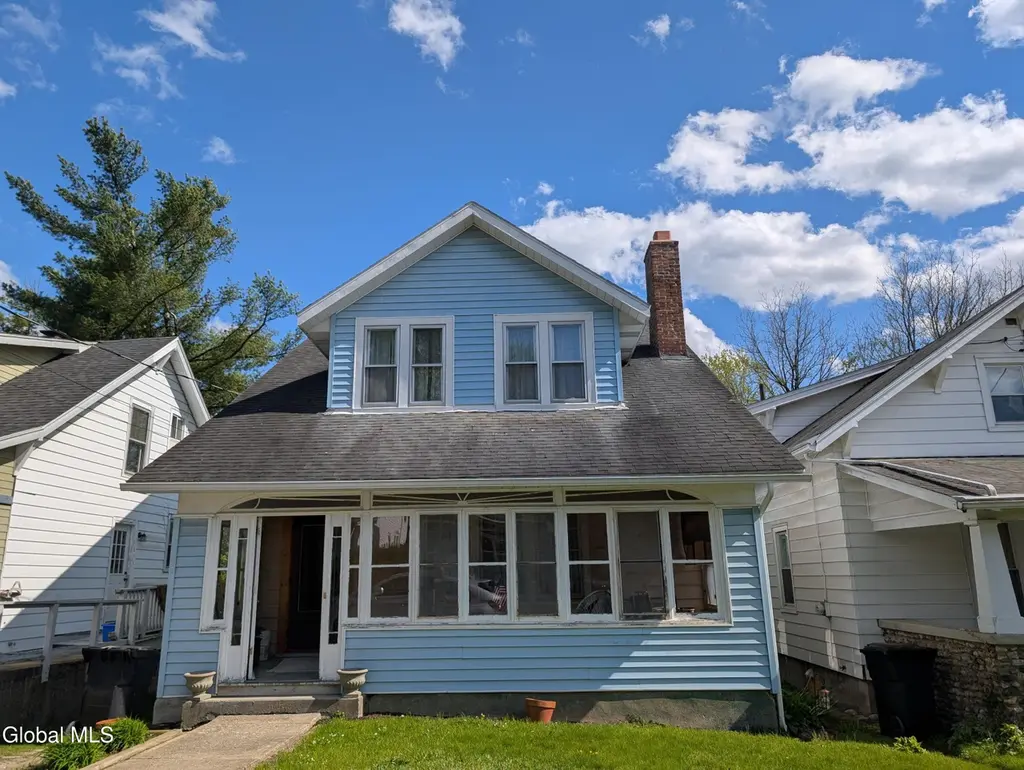
18 Griswold Ave · Troy, NY
Flood risk 1/10 · Minimal
- FEMA flood zone
- X
- Chance of flooding over 30 yrs
- 0.0%
- Est. flood insurance / yr
- $473 – $860
Fire risk 3/10 · Minor
- Est. fire insurance / yr
- $691 – $1,283
Heat risk 3/10 · Minor
- Hot days now (above 96°F)
- 7 days/yr
- Hot days in 30 yrs
- 16 days/yr
Wind risk 3/10 · Minor
- Chance of severe wind over 30 yrs
- 6.0%
Air-quality risk 2/10 · Minimal
- Unhealthy air days now
- 0 days/yr
- Unhealthy air days in 30 yrs
- 1 days/yr
Risk factors via First Street. Map © Google.
Why this score? — see what drove the B grade
The composite is a weighted blend of 9 inputs, each scored 0–100. Each bar is that input's sub-score; the figure is the points it added to the 100-point composite (weight × sub-score).
- Cash flow +25.2/30.0
- ARV discount +15.0/15.0
- DSCR +8.3/10.0
- 1% rule +7.9/10.0
- Livability +4.0/5.0
- Schools +3.8/10.0
- Rent growth +3.7/5.0
- Condition / age +2.5/5.0
- Appreciation +0.0/10.0
$160,000
🖨 Deal sheet (PDF) 📄 Offer letter ✓ Due diligence
Listing remarks
Here is your chance to buy in this established neighborhood! This home was owner occupied for almost 50 years! This is now waiting for you to make this your own and build lasting memories. This 3 bedroom 1 1/2 bath home is in need of some TLC to bring it back to what it was. This is being sold as is. Seller prefers a quick closing, so cash is preferred. No assignments please.
Key facts
- 5,662 sq ft lot
- 3 parking spots
- Built 1920
Property features AI
Exterior
- Parking: Driveway with space for 3 vehicles
- Utilities: 150 Amp electrical service; Public water; Public sewer
- Home design: Single-family residence; Fixer condition
- Construction: Vinyl siding
- Exterior features: Asphalt roof
Interior
- Kitchen: Range; Refrigerator
- Bedrooms: Three bedrooms on the second level
- Flooring: Hardwood floors
- Bathrooms: One full bathroom on the second level; One half bathroom on the first level
- Heating & cooling: Oil heating with radiant heat
- Interior features: 8 total rooms; Full basement with interior entry; Living room with fireplace
- Laundry & utility: Laundry room with washer and electric dryer hookups
Neighborhood map
What this means for you Summary
Snapshot
- This is a 3-bed/1.5-bath single-family listed at $160k.
Deal economics
- At list price, monthly cash flow is $358 ($4k/yr) — positive.
- The deal already cash-flows at list — no discount required.
- Meets the 1% rule at list price ($2k rent vs $160k).
- Cap rate 9.0% vs local median 5.3% in Troy — top-decile yield for the area; either an underpriced asset or a hidden risk that comps aren't pricing in. Stress-test before assuming the spread holds.
Location & tenants
- Location reads 81/100 on livability (#88 in NY, #1,350 nationally) — a professional / high-income tenant draw. Strengths: amenities A+, commute A+, housing A+; Watch: employment C-, crime F.
- Troy City School District (urban): math 44% / reading 46% proficiency, ranked #467 of 590 in NY (top 79%) — families likely to look elsewhere, expect single-tenant / working-renter base with shorter leases; 62% free/reduced lunch — lower-income household profile, screen leases tightly.
- Zoned schools: Ps 16 (math 52% / reading 52%, grade C-, #988 of 2,108 statewide, top 49%, 248 students, 60% FRL); Troy Middle School (math 22% / reading 43%, grade F, #504 of 729 statewide, top 70%, 786 students, 72% FRL); Troy High School (math 95% / reading 77%, grade A, #347 of 1,100 statewide, top 32%, 1,153 students, 64% FRL) — zoned schools at 65% FRL track the district average.
- Market conditions: Rents rising fast (+4.9%/yr); 220 active listings in the ZIP; 6 comparable units currently listed for rent nearby; rentals at typical pace (median 26d on market — plan ~3-4 weeks tenant-placement turnaround); solid renter incomes; 405 units permitted in Rensselaer County in 2024 (224 in 5+ unit buildings).
- This rent runs 33% of the median local income ($76k/yr) — at the standard rent-burdened threshold; future hikes will face affordability resistance.
Forward outlook
- Local home prices are declining (-3.0%/yr); year-one equity from $1k of loan paydown is wiped out by about $5k of value loss. Plan a longer hold.
- Rensselaer County population projected to shrink 6% by 2050 — rents likely to lag national; underwrite the cash flow, not the appreciation.
- At projected returns (-3.0% appreciation + 4.9% rent growth), your $45k cash investment doubles in ~9 years — after that, you're playing with house money.
Negotiation context
- Only 5 days on market — expect competitive offers; lowballing is unlikely to land.
Risks & watch-outs
- Watch-outs: property tax is 2.7% of price; built in 1920 — expect roof / HVAC / electrical / plumbing capex.
Questions for the listing agent
- Built in 1920 — when were the roof, HVAC, electrical panel, plumbing, and water heater last replaced?
- Property tax is high relative to price — has the assessment been appealed recently, and will the sale trigger a re-assessment?
- Is there a deadline driving the sale (1031 exchange, divorce, estate, relocation)? That informs how much negotiation room exists.
- Crime grade is F in this area — have there been break-ins, vandalism, or insurance claims at this property in the last 3 years? What carrier currently insures it and at what premium?
- What's the average days-on-market for RENTAL listings here right now (not sales)? A rising rental-DOM trend means longer vacancies and softer asking-rent achievability than the comps imply.
- What's the recent tenant-quality profile in this submarket — average credit score on applications, eviction rate, late-payment / NSF rate, and stable-employment percentage? A property-management company in the area should have these aggregated.
- How much new for-sale + rental construction is in the pipeline within 1–3 miles? Heavy new supply typically softens prices + rents 12–24 months out; constrained supply supports both.
Investment metrics
- 1% rule
- 1.29% ✓
- Cap rate
- 8.98%
- Cash-on-cash
- 9.60%
- DSCR
- 1.43
- GRM
- 6.5
CMA / ARV
- ARV (median comp)
- $264,799
- List price
- $160,000
- Delta
- -39.58%
- Verdict
- UNDERPRICED
- Comps
- 20 within 1.0 mi
Show comp detail 12 sales within ~0.75 mi
| Address | Dist | Beds/Ba | Sqft | Sold | Price | $/sf | Match |
|---|---|---|---|---|---|---|---|
| 11 Lilac Ln | 0.20mi | 3/1.5 | 1,344 (-6%) | 5mo | $235,000 | $175 | 77 |
| 4 Arts St | 0.15mi | 3/1.0 | 1,248 (-13%) | 10mo | $330,500 | $265 | 61 |
| 14 Cleminshaw Ave | 0.32mi | 2/1.0 (-1) | 1,311 (-8%) | 7mo | $259,900 | $198 | 58 |
| 16 Cleminshaw Ave | 0.31mi | 3/2.0 | 1,290 (-10%) | 12mo | $325,000 | $252 | 57 |
| 8 The Crossways | 0.56mi | 2/2.0 (-1) | 1,445 (+1%) | 10mo | $377,000 | $261 | 57 |
| 51 Wynantskill Way | 0.65mi | 3/2.0 | 1,450 (+2%) | 10mo | $375,000 | $259 | 56 |
| 14 Parkview Ct | 0.34mi | 3/1.0 | 1,215 (-15%) | 2mo | $252,000 | $207 | 56 |
| 10 Gene Ave | 0.59mi | 4/2.0 (+1) | 1,350 (-6%) | 6mo | $290,000 | $215 | 52 |
| 35 Mountainview Ave | 0.21mi | 3/2.0 | 1,640 (+15%) | 17mo | $280,000 | $171 | 49 |
| 2 Miller Ave | 0.49mi | 3/1.0 | 1,248 (-13%) | 7mo | $105,000 | $84 | 48 |
| 120 Winter St | 0.43mi | 2/1.0 (-1) | 1,215 (-15%) | 15mo | $202,000 | $166 | 36 |
| 30 Wynantskill Way | 0.74mi | 3/1.5 | 1,224 (-14%) | 13mo | $285,000 | $233 | 31 |
Match score weights: distance 35% · size 25% · config 20% · recency 20%. Top-matched comps best support the ARV.
Projected returns pro-forma
-3.0% appreciation · 4.88% rent growth · sell at horizon
- IRR
- 0.6%
- Equity multiple
- 1.02×
- Total profit
- $1,006
- Equity at exit
- $23,857
- IRR
- 12.3%
- Equity multiple
- 2.07×
- Total profit
- $47,744
- Equity at exit
- $13,834
Cash invested: $44,800 (down + closing). Projections, not guarantees.
Landlord ↔ Tenant lean methodology
- Overall (STATE)
- 15 Strongly Tenant-Friendly
- State New York
- 15 Strongly Tenant-Friendly · D+10
- County
- — inherits STATE
- City
- — inherits STATE
ZIP-level market 12180
- Home prices YoY
- -33.3%
- Rents YoY
- 4.9%
- Active inventory
- 220
- Price-to-rent
- 6.5×
Monthly cashflow live
- Estimated rent
- $2,061 high interval (Pro) →
- Mortgage (P&I)
- −$839
- Tax from tax record
- −$364 /mo · $4,368/yr
- Insurance
- −$67
- HOA
- −$0
- Vacancy / Maint / Mgmt
- −$433
- Net cashflow
- $358
Break-even live
Sensitivity live
| Price | -10% $449 | -5% $404 | +0% $358 | +5% $313 | +10% $268 |
|---|---|---|---|---|---|
| Rent | -10% $196 | -5% $277 | +0% $358 | +5% $440 | +10% $521 |
| Rate | -1.0pp $439 | -0.5pp $399 | base $358 | +0.5pp $317 | +1.0pp $275 |
UW: 25.0% down · 7.5% · 30yr · 1.5% tax · 5.0% vac · 8.0% maint · 8.0% mgmt
Financing live
Cash to close
- Down payment
- $40,000
- Closing costs
- $4,800
- Reserves months
- —
- Total cash needed
- —
Loan-product check · same deal, 3 products live
Conventional
25% down · 7.5% · 30yr
- Down + closing
- —
- Monthly P&I
- —
- Monthly cashflow
- —
- DSCR
- —
- Eligible?
- —
Personal DTI + credit; lowest rate.
DSCR
20% down · 8.5% · 30yr
- Down + closing
- —
- Monthly P&I
- —
- Monthly cashflow
- —
- DSCR
- —
- Eligible?
- —
No personal income docs; deal must DSCR.
Hard money
10% down · 12.0% · 12mo
- Down + closing
- —
- Monthly P&I
- —
- Monthly cashflow
- —
- DSCR
- —
- Eligible?
- —
Short-term bridge; refi at stabilization.
Rent comps 6 comps
| Address | Beds | Baths | Sqft | Rent | $/sqft | DOM | Units | Dist |
|---|---|---|---|---|---|---|---|---|
| 669 Pawling Ave Troy, NY | 4.0 | 1.0 | 1700 | $2,350 | $1.38 | 21d | 1 | 0.11mi |
| 54 Main Ave Wynantskill, NY | 4.0 | 1.0 | 1360 | $1,950 | $1.43 | 16d | 1 | 0.63mi |
| 102 Main Ave Wynantskill, NY | 3.0 | 1.0 | 1316 | $1,600 | $1.22 | 46d | 1 | 0.83mi |
| 136 Maple Ave Unit 2 Troy, NY | 2.0 | 1.0 | 1155 | $2,000 | $1.73 | 45d | 1 | 0.87mi |
| 110 Colleen Rd Troy, NY | 1.0–2.0 | 1.0 | 955 | $1,550 | $1.62 | 16d | 9 | 0.94mi |
| 110 Project Rd Unit 1 Troy, NY | 2.0 | 1.0 | 1000 | $1,300 | $1.30 | 25d | 1 | 1.20mi |
Listing history 2 events
-
2026-05-18status Pending 384-char remark
-
2026-05-13$160,000 Active 384-char remark
ⓘ Source: listings_history table (triggers on properties + properties_extension) + one-shot
backfill from property_details.listing_events for pre-trigger history.
Tax reassessment forecast NY · Partial reset (capped growth)
- Current annual tax
- $4,368 · $364/mo
- Projected year-2 tax
- $4,368 · $364/mo
- Expected delta
- $0/yr ($0/mo · 0.0%)
ⓘ Screening estimate from a state-policy table — verify with the county assessor before closing.
Climate risk First Street
- Flood 1/10 Low FEMA zone X · 0% chance over 30 yrs
- Wildfire 3/10 Moderate
- Heat 3/10 Moderate 7 d/yr ≥96°F today · 16 d/yr by 30 yrs out
- Wind 3/10 Moderate 6% chance of damaging wind over 30 yrs
- Air quality 2/10 Low 0 unhealthy d/yr today · 1 by 30 yrs out
Nearby sold comps map
Loading sold comps map…
Walkable amenities ~0.75 mi
Loading nearby amenities…
Taxation est. · year 1
- Rental income
- $24,732
- − Mortgage interest
- −$8,962
- − Property taxes
- −$4,368
- − Insurance
- −$800
- − Repairs & maintenance
- −$1,979
- − Management
- −$1,979
- − Depreciation
- −$4,655
- Taxable income
- $1,990
- Est. tax owed @ 24.0%
- −$477
- After-tax cash flow
- $3,824/yr
For passive investors: Depreciation is non-cash, so a rental often shows a tax loss while cash-flowing — sheltering income. Rental losses are passive: they offset passive income freely, and up to $25,000/yr can offset ordinary (W-2) income if you actively participate and your MAGI is under $100k (phasing out to $0 by $150k); unused losses carry forward. On sale, claimed depreciation is recaptured at up to 25%, and gains may owe capital-gains tax (a 1031 exchange can defer both). Figures are a year-1 estimate at your 24.0% rate — not tax advice; consult a CPA.
Schools (NCES district)
- District
- Troy City School District
- NCES district ID
- 3628950
- Math proficiency
- 44% ▲ 6.00%
- Reading proficiency
- 46% ▲ 6.00%
- Median HH income
- $42,143
- Composite
- 37.89/100
- National rank
- #4318
- State rank
- #467 of 590 in NY
Livability — Troy
- Score
- 81/100
- State rank
- #88
- US rank
- #1350
Category grades
Schools grade is shown separately in the Schools card above.
Census & demographics
- Census place
- Troy, NY
- County
- Rensselaer County · 75,590 people
- City population
- 53,479
- Metro
- Albany-Schenectady-Troy, NY
- Population (ZIP)
- 53,479
- Household income
- $75,851
- Rent vs Own
- Severe rent burden
- 2698.0
Population outlook (Rensselaer County) Hauer SSP2
- Today (2025)
- 162,400 people
- By 2030
- 161,746 · -0.4%
- By 2040
- 158,095 · -2.7%
- By 2050
- 152,966 · -5.8%
- By 2075
- 140,767 · -13.3%
- By 2100
- 124,727 · -23.2%
Race, ethnicity, and origin ACS 2023
- Neighborhood character
- Predominantly White (70%)
- Race & ethnicity
- White 70% Black 12% Hispanic / Latino 8% Two or more races 8% Asian 5%
- Hispanic origin (detail)
- Mexican 1% Puerto Rican 4%
- Common ancestry
- Romanian 5% Lithuanian 5% Slovak 1%
- Foreign-born
- 10% · Canada, China
- Languages at home
- 88% English-only · Spanish 4% Other Indo-European 2% Arabic 2%
Political lean MEDSL · Rensselaer
- 2024 margin
- Toss-up / Even · D 50.7% · R 49.3%
- 2008→2024 swing
- -8.0pp toward R · 2008: 9.3pp · 2024: 1.4pp
- All cycles
- 2024: D+1.4 2020: D+5.6 2016: R+2.9 2012: D+11.8 2008: D+9.3
Not yet ingested
- Civics
- —
Market trends
- HPI YoY
- ▼ -142.53%
- Current HPI
- 285.0762
- Rent YoY
- ▲ 4.88%
- Metro
- Albany-Schenectady-Troy, NY
- State GDP YoY
- ▲ 2.60%
- F500 in state
- 92
Industry mix (Fortune 500 HQ in NY)
| Industry | F500 HQs | Revenue |
|---|---|---|
| Financial Services | 10 | $950B |
|
||
| Consumer Goods | 9 | $162B |
|
||
| Insurance | 4 | $225B |
|
||
| Telecommunications | 2 | $144B |
|
||
| Pharmaceuticals | 2 | $112B |
|
||
| Media / Entertainment | 2 | $69B |
|
||
Price history
2 events — show timeline
- 2026-05-18 Pending — Global MLS
- 2026-05-13 Listed $160,000 Global MLS
Property tax history
+11.4%/yrLatest (2025): $4,368 · -28.1% YoY. Source: county tax records.
Cash-flow waterfall
monthlySold comps — $/sqft
last 12 mo · ≤1 miLoading sold comps…