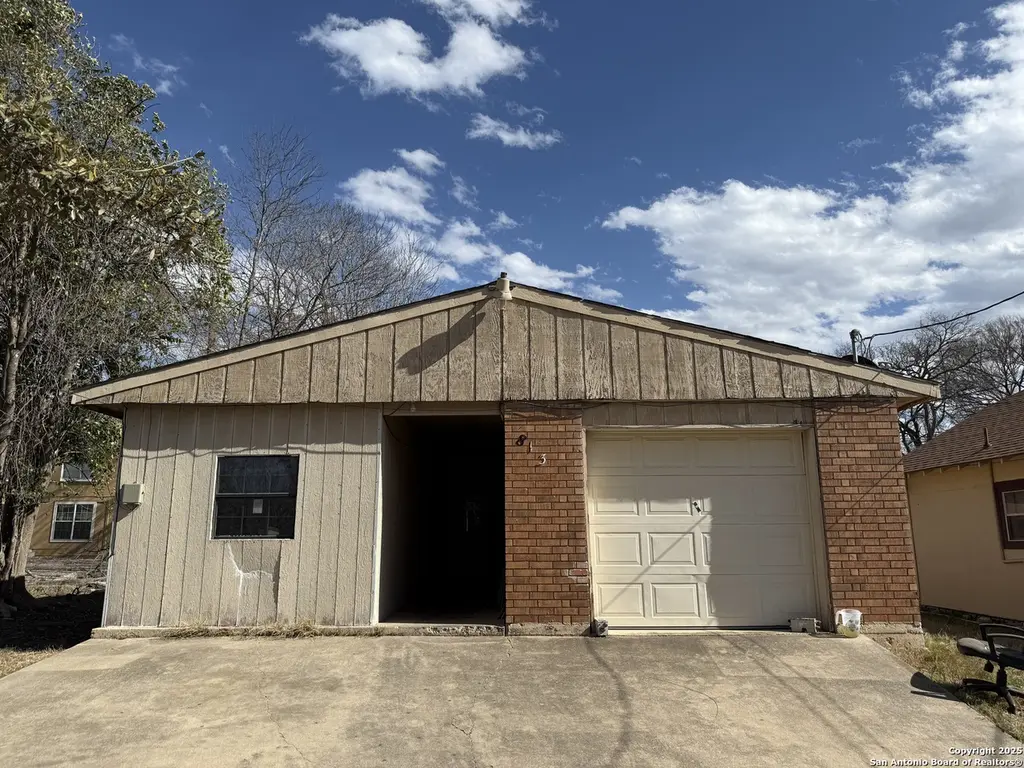
813 Ross · Kerrville, TX
Flood risk 3/10 · Minor
- FEMA flood zone
- X (unshaded)
- Chance of flooding over 30 yrs
- 0.1%
- Est. flood insurance / yr
- $507 – $1,088
Fire risk 4/10 · Minor
- Est. fire insurance / yr
- $1,222 – $2,270
Heat risk 6/10 · Moderate
- Hot days now (above 103°F)
- 7 days/yr
- Hot days in 30 yrs
- 21 days/yr
Wind risk 6/10 · Moderate
- Chance of severe wind over 30 yrs
- 52.0%
Air-quality risk 1/10 · Minimal
- Unhealthy air days now
- 0 days/yr
- Unhealthy air days in 30 yrs
- 0 days/yr
Risk factors via First Street. Map © Google.
Why this score? — see what drove the C grade
The composite is a weighted blend of 9 inputs, each scored 0–100. Each bar is that input's sub-score; the figure is the points it added to the 100-point composite (weight × sub-score).
- Cash flow +17.6/30.0
- ARV discount +15.0/15.0
- DSCR +5.5/10.0
- 1% rule +5.1/10.0
- Schools +4.1/10.0
- Livability +4.0/5.0
- Rent growth +3.3/5.0
- Condition / age +2.5/5.0
- Appreciation +0.0/10.0
$178,000
🖨 Deal sheet (PDF) 📄 Offer letter ✓ Due diligence
Listing remarks MLS
Investor property in an up and coming area with lots of potential for growth. Decent sized lot .23 acres. Schedule a showing today!
Key facts
- 0.23 acre lot
- Garage
- Built 1972
Neighborhood map
What this means for you Summary
Snapshot
- This is a 3-bed/1.0-bath single-family listed at $178k.
Deal economics
- At list price, monthly cash flow is $142 ($2k/yr) — positive.
- The deal already cash-flows at list — no discount required.
- Meets the 1% rule at list price ($2k rent vs $178k).
- Recommended offer: $157k (12.0% below list) — sets the bar for market timing.
- Cap rate 7.2% vs local median 2.1% in Kerrville — top-decile yield for the area; either an underpriced asset or a hidden risk that comps aren't pricing in. Stress-test before assuming the spread holds.
Location & tenants
- Location reads 81/100 on livability (#25 in TX, #1,483 nationally) — a professional / high-income tenant draw. Strengths: crime A+, cost of living A+, housing A+; Watch: employment C-, commute F.
- Kerrville ISD (town): math 45% / reading 51% proficiency, ranked #220 of 826 in TX (top 27%) — families likely to look elsewhere, expect single-tenant / working-renter base with shorter leases.
- Market conditions: Rents rising (+3.0%/yr); 753 active listings in the ZIP; 8 comparable units currently listed for rent nearby; rentals lingering (median 44d on market — plan ~5-8 weeks vacancy on turnover, expect pricing pressure); 62% of comp listings sitting > 30 days — soft ceiling on asking rent; 422 units permitted in Kerr County in 2024 (322 in 5+ unit buildings).
- This rent runs 32% of the median local income ($67k/yr) — at the standard rent-burdened threshold; future hikes will face affordability resistance.
Forward outlook
- Local home prices are declining (-3.0%/yr); year-one equity from $1k of loan paydown is wiped out by about $5k of value loss. Plan a longer hold.
- Kerr County population projected at +15% by 2050 — long-run rental-demand tailwind backs the buy-and-hold thesis.
Negotiation context
- It's been on market 250 days — a 12% lower offer ($157k) is reasonable based on typical stale-listing flexibility.
- 4 sale attempts since 21y ago with the ask held roughly flat each time — persistent listings suggest the price (not the market) is what's stuck; bring a comps-based counter.
Risks & watch-outs
- Climate carrying-cost: major wind risk, 52% chance of damaging wind over 30y; extreme-heat days projected 7→21/yr by 2055 (HVAC capex compounding) — expect insurance premiums to compound above CPI over the hold.
Questions for the listing agent
- It's been on market 250 days. Have you received any prior offers? Is the seller open to a 12% concession, seller financing, or rate buy-down credit?
- Built in 1972 — when were the roof, HVAC, electrical panel, plumbing, and water heater last replaced?
- Why hasn't it sold? Are there any deal-killer items the seller is aware of (foundation, flood, title, zoning, code violations)?
- Is there a deadline driving the sale (1031 exchange, divorce, estate, relocation)? That informs how much negotiation room exists.
- Schools are B-rated — typically a magnet for longer-tenancy family renters. What's the average tenant stay here, and is there a school-zone premium baked into asking?
- What's the average days-on-market for RENTAL listings here right now (not sales)? A rising rental-DOM trend means longer vacancies and softer asking-rent achievability than the comps imply.
- What's the recent tenant-quality profile in this submarket — average credit score on applications, eviction rate, late-payment / NSF rate, and stable-employment percentage? A property-management company in the area should have these aggregated.
- How much new for-sale + rental construction is in the pipeline within 1–3 miles? Heavy new supply typically softens prices + rents 12–24 months out; constrained supply supports both.
Investment metrics
- 1% rule
- 1.01% ✓
- Cap rate
- 7.25%
- Cash-on-cash
- 3.41%
- DSCR
- 1.15
- GRM
- 8.3
CMA / ARV
- ARV (median comp)
- $258,906
- List price
- $178,000
- Delta
- -31.25%
- Verdict
- UNDERPRICED
- Comps
- 20 within 1.0 mi
Show comp detail 10 sales within ~0.75 mi
| Address | Dist | Beds/Ba | Sqft | Sold | Price | $/sf | Match |
|---|---|---|---|---|---|---|---|
| 712 Gilmer | 0.15mi | 3/2.0 | 1,228 (-7%) | 11mo | $255,000 | $208 | 68 |
| 924 Barnett | 0.44mi | 3/1.0 | 1,218 (-8%) | 5mo | $274,900 | $226 | 62 |
| 909 Ford St | 0.19mi | 3/1.0 | 1,148 (-13%) | 12mo | $219,000 | $191 | 60 |
| 230 Travis | 0.65mi | 3/1.0 | 1,428 (+8%) | 8mo | $390,000 | $273 | 49 |
| 316 Travis St | 0.49mi | 2/1.0 (-1) | 1,204 (-9%) | 13mo | $264,999 | $220 | 47 |
| 1619 Woodside Dr | 0.33mi | 3/2.0 | 1,145 (-13%) | 15mo | $259,000 | $226 | 46 |
| 324 Ross St | 0.43mi | 2/2.0 (-1) | 1,453 (+10%) | 11mo | $279,500 | $192 | 45 |
| 1912 Weston Loop | 0.66mi | 3/2.0 | 1,375 (+4%) | 20mo | $318,000 | $231 | 41 |
| 1913 Weston Loop | 0.67mi | 3/2.0 | 1,364 (+4%) | 23mo | $325,000 | $238 | 39 |
| 2216 San Jacinto | 0.67mi | 2/3.0 (-1) | 1,448 (+10%) | 18mo | $410,000 | $283 | 24 |
Match score weights: distance 35% · size 25% · config 20% · recency 20%. Top-matched comps best support the ARV.
Projected returns pro-forma
-3.0% appreciation · 3.03% rent growth · sell at horizon
- IRR
- -10.9%
- Equity multiple
- 0.60×
- Total profit
- $-19,712
- Equity at exit
- $26,540
- IRR
- -1.5%
- Equity multiple
- 0.90×
- Total profit
- $-5,099
- Equity at exit
- $15,390
Cash invested: $49,840 (down + closing). Projections, not guarantees.
Landlord ↔ Tenant lean methodology
- Overall (STATE)
- 87 Strongly Landlord-Friendly
- State Texas
- 87 Strongly Landlord-Friendly · R+5
- County
- — inherits STATE
- City
- — inherits STATE
ZIP-level market 78028
- Rents YoY
- 3.0%
- Active inventory
- 753
- Price-to-rent
- 8.3×
Monthly cashflow live
- Estimated rent
- $1,795 high interval (Pro) →
- Mortgage (P&I)
- −$933
- Tax from tax record
- −$269 /mo · $3,229/yr
- Insurance
- −$74
- HOA
- −$0
- Vacancy / Maint / Mgmt
- −$377
- Net cashflow
- $142
Break-even live
Sensitivity live
| Price | -10% $242 | -5% $192 | +0% $142 | +5% $91 | +10% $41 |
|---|---|---|---|---|---|
| Rent | -10% $0 | -5% $71 | +0% $142 | +5% $213 | +10% $283 |
| Rate | -1.0pp $231 | -0.5pp $187 | base $142 | +0.5pp $96 | +1.0pp $49 |
UW: 25.0% down · 7.5% · 30yr · 1.5% tax · 5.0% vac · 8.0% maint · 8.0% mgmt
Financing live
Cash to close
- Down payment
- $44,500
- Closing costs
- $5,340
- Reserves months
- —
- Total cash needed
- —
Loan-product check · same deal, 3 products live
Conventional
25% down · 7.5% · 30yr
- Down + closing
- —
- Monthly P&I
- —
- Monthly cashflow
- —
- DSCR
- —
- Eligible?
- —
Personal DTI + credit; lowest rate.
DSCR
20% down · 8.5% · 30yr
- Down + closing
- —
- Monthly P&I
- —
- Monthly cashflow
- —
- DSCR
- —
- Eligible?
- —
No personal income docs; deal must DSCR.
Hard money
10% down · 12.0% · 12mo
- Down + closing
- —
- Monthly P&I
- —
- Monthly cashflow
- —
- DSCR
- —
- Eligible?
- —
Short-term bridge; refi at stabilization.
Rent comps 8 comps
| Address | Beds | Baths | Sqft | Rent | $/sqft | DOM | Units | Dist |
|---|---|---|---|---|---|---|---|---|
| 909 Tivy St Kerrville, TX | 2.0 | 1.0 | 1000 | $1,300 | $1.30 | 44d | 1 | 0.26mi |
| 1316 Carol Ann Dr Kerrville, TX | 3.0 | 2.0 | 1400 | $1,950 | $1.39 | 24d | 1 | 0.42mi |
| 2105 Singing Wind Dr Kerrville, TX | 1.0–3.0 | 1.0–1.5 | 822 | $1,375 | $1.67 | 2d | 5 | 0.94mi |
| 2105 Singing Wind Dr Kerrville, TX | 1.0–3.0 | 1.0–1.5 | 822 | $1,375 | $1.67 | 44d | 1 | 0.94mi |
| 486 Bridal Path Kerrville, TX | 4.0 | 2.0 | 1450 | $2,000 | $1.38 | 44d | 1 | 0.99mi |
| 101 W Schreiner St Kerrville, TX | 2.0 | 1.0 | 1100 | $1,575 | $1.43 | 44d | 1 | 1.21mi |
| 717 Hill Country Dr Kerrville, TX | 1.0–2.0 | 1.0–2.0 | 953 | $1,353 | $1.42 | 2d | 5 | 1.26mi |
| 125 Amelia Ct Kerrville, TX | 3.0 | 2.0 | 1091 | $1,650 | $1.51 | 44d | 1 | 1.40mi |
Listing history 24 events
-
2026-06-19days on market $178,000 Active 250 DOM
-
2026-06-18days on market $178,000 Active 249 DOM
-
2026-06-17days on market $178,000 Active 248 DOM
-
2026-06-16days on market $178,000 Active 247 DOM
-
2026-06-15days on market $178,000 Active 246 DOM
-
2026-06-14days on market $178,000 Active 244 DOM
-
2026-06-12days on market $178,000 Active 243 DOM
-
2026-06-09days on market $178,000 Active 240 DOM
-
2026-06-08days on market $178,000 Active 239 DOM
-
2026-06-07days on market $178,000 Active 238 DOM
-
2026-06-05days on market $178,000 Active 235 DOM
-
2026-06-03days on market $178,000 Active 234 DOM
-
2026-06-02days on market $178,000 Active 233 DOM
-
2026-06-01days on market $178,000 Active 232 DOM
-
2026-05-31days on market $178,000 Active 231 DOM
-
2026-05-30days on market $178,000 Active 230 DOM
-
2026-04-15status Back on Market 131-char remark
Show marketing remark (131 chars)
Investor property in an up and coming area with lots of potential for growth. Decent sized lot .23 acres. Schedule a showing today!
-
2026-02-02historical 131-char remark
Show marketing remark (131 chars)
Investor property in an up and coming area with lots of potential for growth. Decent sized lot .23 acres. Schedule a showing today!
-
2026-02-01status Back on Market 131-char remark
Show marketing remark (131 chars)
Investor property in an up and coming area with lots of potential for growth. Decent sized lot .23 acres. Schedule a showing today!
-
2026-01-31historical 131-char remark
Show marketing remark (131 chars)
Investor property in an up and coming area with lots of potential for growth. Decent sized lot .23 acres. Schedule a showing today!
-
2025-07-31$178,000 New 131-char remark
Show marketing remark (131 chars)
Investor property in an up and coming area with lots of potential for growth. Decent sized lot .23 acres. Schedule a showing today!
-
2014-10-31soldstatus
-
2005-08-09soldstatus 102-char remark
Show marketing remark (102 chars)
3/2 all brick home with nice shade trees on quiet street. Low maintenance exterior with big back yard.
-
2005-04-12$79,999 102-char remark
Show marketing remark (102 chars)
3/2 all brick home with nice shade trees on quiet street. Low maintenance exterior with big back yard.
ⓘ Source: listings_history table (triggers on properties + properties_extension) + one-shot
backfill from property_details.listing_events for pre-trigger history.
Tax reassessment forecast TX · Resets to sale price
- Current annual tax
- $3,229 · $269/mo
- Projected year-2 tax
- $3,257 · $271/mo
- Expected delta
- +$28/yr (+$2/mo · 0.9%)
ⓘ Screening estimate from a state-policy table — verify with the county assessor before closing.
Climate risk First Street
- Flood 3/10 Moderate FEMA zone X (unshaded) · 10% chance over 30 yrs
- Wildfire 4/10 Moderate
- Heat 6/10 Major 7 d/yr ≥103°F today · 21 d/yr by 30 yrs out
- Wind 6/10 Major 52% chance of damaging wind over 30 yrs
- Air quality 1/10 Low 0 unhealthy d/yr today · 0 by 30 yrs out
Nearby sold comps map
Loading sold comps map…
Walkable amenities ~0.75 mi
Loading nearby amenities…
Taxation est. · year 1
- Rental income
- $21,545
- − Mortgage interest
- −$9,971
- − Property taxes
- −$3,229
- − Insurance
- −$890
- − Repairs & maintenance
- −$1,724
- − Management
- −$1,724
- − Depreciation
- −$5,178
- Taxable loss
- −$1,171
- Est. tax savings @ 24.0%
- +$281
- After-tax cash flow
- $1,981/yr
For passive investors: Depreciation is non-cash, so a rental often shows a tax loss while cash-flowing — sheltering income. Rental losses are passive: they offset passive income freely, and up to $25,000/yr can offset ordinary (W-2) income if you actively participate and your MAGI is under $100k (phasing out to $0 by $150k); unused losses carry forward. On sale, claimed depreciation is recaptured at up to 25%, and gains may owe capital-gains tax (a 1031 exchange can defer both). Figures are a year-1 estimate at your 24.0% rate — not tax advice; consult a CPA.
Schools (NCES district)
- District
- Kerrville ISD
- NCES district ID
- 4825590
- Math proficiency
- 45% ▼ -10.00%
- Reading proficiency
- 51% ▼ -1.00%
- Median HH income
- $44,050
- Composite
- 40.54/100
- National rank
- #3702
- State rank
- #220 of 826 in TX
Livability — Kerrville
- Score
- 81/100
- State rank
- #25
- US rank
- #1483
Category grades
Schools grade is shown separately in the Schools card above.
Census & demographics
- Census place
- Kerrville, TX
- County
- Kerr County · 41,206 people
- City population
- 41,206
- Metro
- Kerrville, TX
- Population (ZIP)
- 41,206
- Household income
- $66,991
- Rent vs Own
- Severe rent burden
- 1092.0
Population outlook (Kerr County) Hauer SSP2
- Today (2025)
- 54,010 people
- By 2030
- 55,651 · +3.0%
- By 2040
- 58,923 · +9.1%
- By 2050
- 62,117 · +15.0%
- By 2075
- 71,809 · +33.0%
- By 2100
- 77,004 · +42.6%
Race, ethnicity, and origin ACS 2023
- Neighborhood character
- Predominantly White (69%)
- Race & ethnicity
- White 69% Hispanic / Latino 26% Two or more races 12% Black 2%
- Hispanic origin (detail)
- Mexican 22%
- Common ancestry
- Lithuanian 3% Slovak 3% Portuguese 2%
- Foreign-born
- 6% · Canada
- Languages at home
- 89% English-only · Spanish 10%
Political lean MEDSL · Kerr
- 2024 margin
- Solid R (+54.3) · D 22.4% · R 76.8%
- 2008→2024 swing
- -4.8pp toward R · 2008: -49.6pp · 2024: -54.3pp
- All cycles
- 2024: R+54.3 2020: R+51.7 2016: R+56.3 2012: R+59.1 2008: R+49.6
Not yet ingested
- Civics
- —
Market trends
- HPI YoY
- ▼ -260.97%
- Current HPI
- 213.3663
- Rent YoY
- ▲ 3.03%
- Metro
- Kerrville, TX
- State GDP YoY
- ▲ 3.95%
- F500 in state
- 110
Industry mix (Fortune 500 HQ in TX)
| Industry | F500 HQs | Revenue |
|---|---|---|
| Energy | 16 | $1,198B |
|
||
| Technology | 5 | $198B |
|
||
| Engineering / Construction | 4 | $72B |
|
||
| Energy Services | 3 | $60B |
|
||
| Utilities | 3 | $41B |
|
||
| Healthcare | 2 | $330B |
|
||
Price history
+122.5% since first listed8 events — show timeline
- 2026-04-15 Relisted — LERA
- 2026-02-02 Listing Removed — LERA
- 2026-02-01 Relisted — LERA
- 2026-01-31 Listing Removed — LERA
- 2025-07-31 Listed $178,000 LERA
- 2014-10-31 Sold (Public Records) — Public Records
- 2005-08-09 Sold (MLS) — KVMLS
- 2005-04-12 Listed $79,999 KVMLS
Property tax history
+3.4%/yrLatest (2025): $3,229 · +6.4% YoY. Source: county tax records.
Cash-flow waterfall
monthlySold comps — $/sqft
last 12 mo · ≤1 miLoading sold comps…