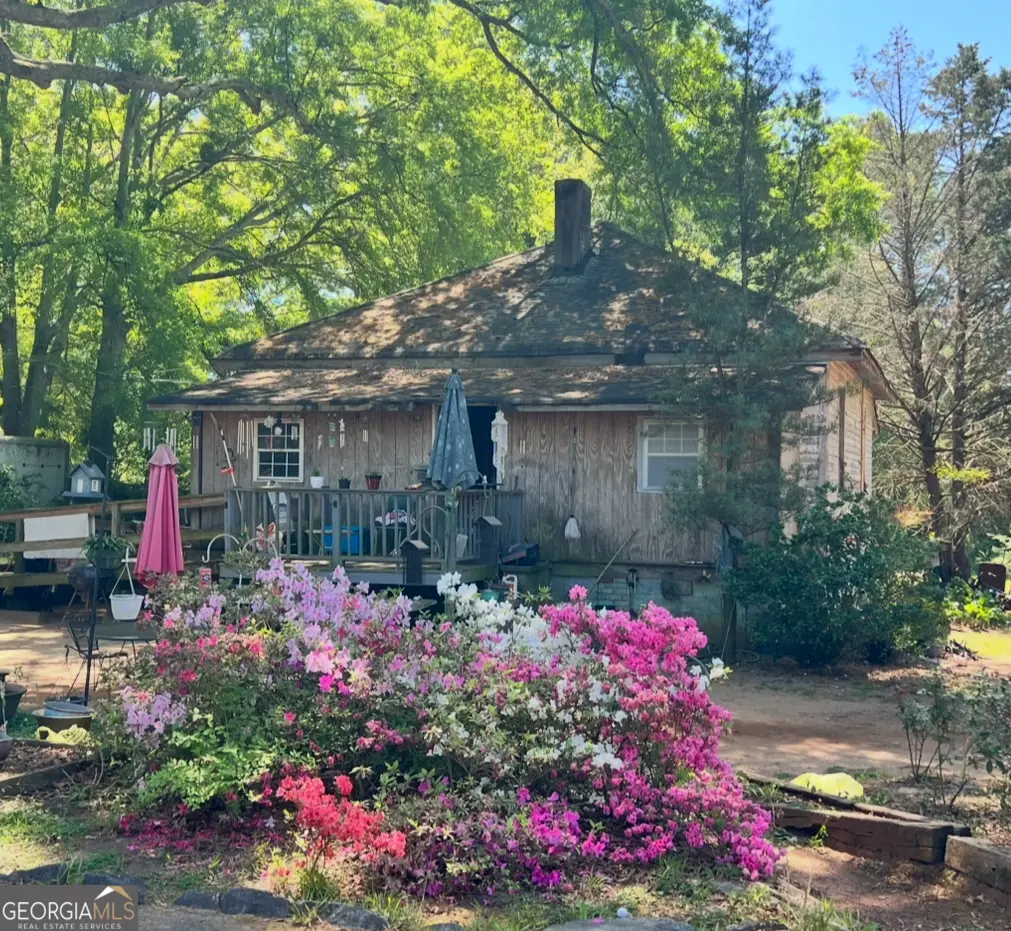
203 Morris St · Palmetto, GA
Flood risk 1/10 · Minimal
- FEMA flood zone
- X (unshaded)
- Chance of flooding over 30 yrs
- 0.0%
- Est. flood insurance / yr
- $473 – $860
Fire risk 3/10 · Minor
- Est. fire insurance / yr
- $963 – $1,789
Heat risk 6/10 · Moderate
- Hot days now (above 104°F)
- 7 days/yr
- Hot days in 30 yrs
- 20 days/yr
Wind risk 6/10 · Moderate
- Chance of severe wind over 30 yrs
- 27.0%
Air-quality risk 3/10 · Minor
- Unhealthy air days now
- 3 days/yr
- Unhealthy air days in 30 yrs
- 3 days/yr
Risk factors via First Street. Map © Google.
Why this score? — see what drove the B grade
The composite is a weighted blend of 9 inputs, each scored 0–100. Each bar is that input's sub-score; the figure is the points it added to the 100-point composite (weight × sub-score).
- Cash flow +30.0/30.0
- 1% rule +10.0/10.0
- DSCR +10.0/10.0
- ARV discount +7.5/15.0
- Schools +4.5/10.0
- Livability +3.1/5.0
- Rent growth +2.5/5.0
- Condition / age +2.5/5.0
- Appreciation +0.0/10.0
$75,000
🖨 Deal sheet (PDF) 📄 Offer letter ✓ Due diligence
Listing remarks MLS
Bungalow Cottage in Downtown Palmetto! Bring your creativity to life with this opportunity to own a home on a quiet street in South Fulton County. There is plenty of room for value add improvement.
Key facts
- 0.46 acre lot
- Built 1920
- Listed 31 days
Neighborhood map
What this means for you Summary
Snapshot
- This is a 2-bed/1.0-bath single-family listed at $75k.
Deal economics
- At list price, monthly cash flow is $815 ($10k/yr) — positive.
- The deal already cash-flows at list — no discount required.
- Meets the 1% rule at list price ($2k rent vs $75k).
- Recommended offer: $73k (3.0% below list) — sets the bar for market timing.
- Cap rate 19.3% vs local median 3.6% in Palmetto — top-decile yield for the area; either an underpriced asset or a hidden risk that comps aren't pricing in. Stress-test before assuming the spread holds.
Location & tenants
- Location reads 61/100 on livability (#329 in GA) — a middle-class / working-renter tenant base. Strengths: crime A+, cost of living A+, housing A+; Watch: employment D, schools D-, amenities F.
- Fulton County (suburban): math 49% / reading 53% proficiency, ranked #12 of 174 in GA (top 7%) — acceptable for families but not a draw, mixed tenant base, ~2y average lease.
- Market conditions: 227 active listings in the ZIP; 10 comparable units currently listed for rent nearby; rentals at typical pace (median 26d on market — plan ~3-4 weeks tenant-placement turnaround); 40% of comp listings sitting > 30 days — soft ceiling on asking rent; solid renter incomes; 11,565 units permitted in Fulton County in 2024 (8,159 in 5+ unit buildings).
Forward outlook
- Local home prices are declining (-3.0%/yr); year-one equity from $519 of loan paydown is wiped out by about $2k of value loss. Plan a longer hold.
- Fulton County population projected at +38% by 2050 — long-run rental-demand tailwind backs the buy-and-hold thesis.
- At projected returns (-3.0% appreciation + 3.0% rent growth), your $21k cash investment doubles in ~3 years — after that, you're playing with house money.
Negotiation context
- It's been on market 31 days — a 3% lower offer ($73k) is reasonable based on typical stale-listing flexibility.
Risks & watch-outs
- Watch-outs: built in 1920 — expect roof / HVAC / electrical / plumbing capex.
- Climate carrying-cost: major wind risk, 27% chance of damaging wind over 30y; extreme-heat days projected 7→20/yr by 2055 (HVAC capex compounding) — expect insurance premiums to compound above CPI over the hold.
Questions for the listing agent
- It's been on market 31 days. Have you received any prior offers? Is the seller open to a 3% concession, seller financing, or rate buy-down credit?
- Built in 1920 — when were the roof, HVAC, electrical panel, plumbing, and water heater last replaced?
- Is there a deadline driving the sale (1031 exchange, divorce, estate, relocation)? That informs how much negotiation room exists.
- Schools are D-rated, which usually means shorter tenancies and higher turnover. Who's the typical renter profile here, and what's been the actual vacancy rate?
- What's the average days-on-market for RENTAL listings here right now (not sales)? A rising rental-DOM trend means longer vacancies and softer asking-rent achievability than the comps imply.
- What's the recent tenant-quality profile in this submarket — average credit score on applications, eviction rate, late-payment / NSF rate, and stable-employment percentage? A property-management company in the area should have these aggregated.
- How much new for-sale + rental construction is in the pipeline within 1–3 miles? Heavy new supply typically softens prices + rents 12–24 months out; constrained supply supports both.
Investment metrics
- 1% rule
- 2.25% ✓
- Cap rate
- 19.33%
- Cash-on-cash
- 46.56%
- DSCR
- 3.07
- GRM
- 3.7
CMA / ARV
- ARV (median comp)
- $229,953
- List price
- $75,000
- Delta
- -67.38%
- Verdict
- UNDERPRICED
- Comps
- 20 within 1.0 mi
Show comp detail 7 sales within ~0.75 mi
| Address | Dist | Beds/Ba | Sqft | Sold | Price | $/sf | Match |
|---|---|---|---|---|---|---|---|
| 203 Morris St | 0.00mi | 2/1.0 | 1,184 (0%) | 1mo | $55,000 | $46 | 99 |
| 355 Tiffany Ln | 0.08mi | 3/2.0 (+1) | 1,159 (-2%) | 8mo | $255,000 | $220 | 78 |
| 335 Tiffany Ln | 0.07mi | 3/2.0 (+1) | 1,209 (+2%) | 24mo | $226,000 | $187 | 64 |
| 514 Griffith Dr | 0.34mi | 2/1.0 | 1,084 (-8%) | 19mo | $214,000 | $197 | 54 |
| 511 Harris Ave | 0.39mi | 3/1.0 (+1) | 1,100 (-7%) | 23mo | $229,500 | $209 | 46 |
| 203 Greensprings Dr | 0.50mi | 3/1.5 (+1) | 1,020 (-14%) | 13mo | $235,000 | $230 | 35 |
| 523 Menefee St | 0.72mi | 3/2.0 (+1) | 1,264 (+7%) | 20mo | $240,000 | $190 | 30 |
Match score weights: distance 35% · size 25% · config 20% · recency 20%. Top-matched comps best support the ARV.
Projected returns pro-forma
-3.0% appreciation · 3.0% rent growth · sell at horizon
- IRR
- 43.9%
- Equity multiple
- 2.89×
- Total profit
- $39,769
- Equity at exit
- $11,183
- IRR
- 49.8%
- Equity multiple
- 5.84×
- Total profit
- $101,560
- Equity at exit
- $6,485
Cash invested: $21,000 (down + closing). Projections, not guarantees.
Landlord ↔ Tenant lean methodology
- Overall (STATE)
- 90 Strongly Landlord-Friendly
- State Georgia
- 90 Strongly Landlord-Friendly · R+3
- County
- — inherits STATE
- City
- — inherits STATE
ZIP-level market 30268
- Home prices YoY
- -22.1%
- Active inventory
- 227
- Price-to-rent
- 3.7×
Monthly cashflow live
- Estimated rent
- $1,689 high interval (Pro) →
- Mortgage (P&I)
- −$393
- Tax from tax record
- −$95 /mo · $1,141/yr
- Insurance
- −$31
- HOA
- −$0
- Vacancy / Maint / Mgmt
- −$355
- Net cashflow
- $815
Break-even live
Sensitivity live
| Price | -10% $857 | -5% $836 | +0% $815 | +5% $794 | +10% $772 |
|---|---|---|---|---|---|
| Rent | -10% $681 | -5% $748 | +0% $815 | +5% $882 | +10% $948 |
| Rate | -1.0pp $853 | -0.5pp $834 | base $815 | +0.5pp $795 | +1.0pp $776 |
UW: 25.0% down · 7.5% · 30yr · 1.5% tax · 5.0% vac · 8.0% maint · 8.0% mgmt
Financing live
Cash to close
- Down payment
- $18,750
- Closing costs
- $2,250
- Reserves months
- —
- Total cash needed
- —
Loan-product check · same deal, 3 products live
Conventional
25% down · 7.5% · 30yr
- Down + closing
- —
- Monthly P&I
- —
- Monthly cashflow
- —
- DSCR
- —
- Eligible?
- —
Personal DTI + credit; lowest rate.
DSCR
20% down · 8.5% · 30yr
- Down + closing
- —
- Monthly P&I
- —
- Monthly cashflow
- —
- DSCR
- —
- Eligible?
- —
No personal income docs; deal must DSCR.
Hard money
10% down · 12.0% · 12mo
- Down + closing
- —
- Monthly P&I
- —
- Monthly cashflow
- —
- DSCR
- —
- Eligible?
- —
Short-term bridge; refi at stabilization.
Rent comps 10 comps
| Address | Beds | Baths | Sqft | Rent | $/sqft | DOM | Units | Dist |
|---|---|---|---|---|---|---|---|---|
| 165 Pine Ter Unit 165 Palmetto, GA | 2.0 | 1.0 | 800 | $1,250 | $1.56 | 45d | 1 | 0.16mi |
| 640 Main St Palmetto, GA | 2.0 | 1.0 | 1066 | $1,875 | $1.76 | 45d | 1 | 0.20mi |
| 513 Center St Palmetto, GA | 2.0 | 1.0 | 850 | $1,250 | $1.47 | 6d | 1 | 0.49mi |
| 553 Magnolia Cir Palmetto, GA | 3.0 | 2.5 | 1386 | $1,845 | $1.33 | 23d | 1 | 0.53mi |
| 552 Magnolia Cir Palmetto, GA | 3.0 | 2.5 | 1386 | $1,690 | $1.22 | 25d | 1 | 0.55mi |
| 660 Magnolia Cir Palmetto, GA | 3.0 | 2.5 | 1386 | $1,965 | $1.42 | 45d | 1 | 0.59mi |
| 635 Magnolia Cir Palmetto, GA | 3.0 | 2.5 | 1386 | $1,690 | $1.22 | 45d | 1 | 0.60mi |
| 513 Toombs St Unit 5 Palmetto, GA | 2.0 | 1.5 | 1200 | $1,350 | $1.12 | 25d | 1 | 0.71mi |
| 222 Taylor Cir Palmetto, GA | 1.0 | 2.0 | 1500 | $800 | $0.53 | 0d | 1 | 0.85mi |
| 545 Carlton Pointe Dr Palmetto, GA | 2.0 | 2.0 | 1073 | $1,375 | $1.28 | 25d | 1 | 1.36mi |
Listing history 2 events
-
2026-05-14status Under Contract 197-char remark
Show marketing remark (197 chars)
Bungalow Cottage in Downtown Palmetto! Bring your creativity to life with this opportunity to own a home on a quiet street in South Fulton County. There is plenty of room for value add improvement.
-
2026-03-06$75,000 New 197-char remark
Show marketing remark (197 chars)
Bungalow Cottage in Downtown Palmetto! Bring your creativity to life with this opportunity to own a home on a quiet street in South Fulton County. There is plenty of room for value add improvement.
ⓘ Source: listings_history table (triggers on properties + properties_extension) + one-shot
backfill from property_details.listing_events for pre-trigger history.
Tax reassessment forecast GA · Resets to sale price
- Current annual tax
- $1,141 · $95/mo
- Projected year-2 tax
- $1,141 · $95/mo
- Expected delta
- $0/yr ($0/mo · 0.0%)
ⓘ Screening estimate from a state-policy table — verify with the county assessor before closing.
Climate risk First Street
- Flood 1/10 Low FEMA zone X (unshaded) · 0% chance over 30 yrs
- Wildfire 3/10 Moderate
- Heat 6/10 Major 7 d/yr ≥104°F today · 20 d/yr by 30 yrs out
- Wind 6/10 Major 27% chance of damaging wind over 30 yrs
- Air quality 3/10 Moderate 3 unhealthy d/yr today · 3 by 30 yrs out
Nearby sold comps map
Loading sold comps map…
Walkable amenities ~0.75 mi
Loading nearby amenities…
Taxation est. · year 1
- Rental income
- $20,270
- − Mortgage interest
- −$4,201
- − Property taxes
- −$1,141
- − Insurance
- −$375
- − Repairs & maintenance
- −$1,622
- − Management
- −$1,622
- − Depreciation
- −$2,182
- Taxable income
- $9,128
- Est. tax owed @ 24.0%
- −$2,191
- After-tax cash flow
- $7,587/yr
For passive investors: Depreciation is non-cash, so a rental often shows a tax loss while cash-flowing — sheltering income. Rental losses are passive: they offset passive income freely, and up to $25,000/yr can offset ordinary (W-2) income if you actively participate and your MAGI is under $100k (phasing out to $0 by $150k); unused losses carry forward. On sale, claimed depreciation is recaptured at up to 25%, and gains may owe capital-gains tax (a 1031 exchange can defer both). Figures are a year-1 estimate at your 24.0% rate — not tax advice; consult a CPA.
Schools (NCES district)
- District
- Fulton County
- NCES district ID
- 1302280
- Math proficiency
- 49% ▼ -2.00%
- Reading proficiency
- 53% ▬ 0.00%
- Median HH income
- $68,035
- Composite
- 45.33/100
- National rank
- #2640
- State rank
- #12 of 174 in GA
Livability — Palmetto
- Score
- 61/100
- State rank
- #329
- US rank
- #17351
Category grades
Schools grade is shown separately in the Schools card above.
Census & demographics
- Census place
- Palmetto, GA
- County
- Fulton County · 1,094,430 people
- City population
- 50,621
- Metro
- Atlanta-Sandy Springs-Alpharetta, GA
- Population (ZIP)
- 10,874
- Household income
- $91,349
- Rent vs Own
- Severe rent burden
- 206.0
Population outlook (Fulton County) Hauer SSP2
- Today (2025)
- 1,203,707 people
- By 2030
- 1,299,706 · +8.0%
- By 2040
- 1,488,256 · +23.6%
- By 2050
- 1,664,580 · +38.3%
- By 2075
- 2,036,072 · +69.2%
- By 2100
- 2,222,402 · +84.6%
Race, ethnicity, and origin ACS 2023
- Neighborhood character
- Diverse neighborhood (Simpson 0.67)
- Race & ethnicity
- Black 42% White 36% Hispanic / Latino 18% Two or more races 5%
- Hispanic origin (detail)
- Mexican 13% Puerto Rican 3%
- Common ancestry
- Iranian 1% Serbian 1% Romanian 1%
- Foreign-born
- 8% · Canada
- Languages at home
- 84% English-only · Spanish 14% Russian/Polish/Slavic 1%
Political lean MEDSL · Fulton
- 2024 margin
- Solid D (+44.9) · D 71.9% · R 27.0% · Other 1.1%
- 2008→2024 swing
- +9.8pp toward D · 2008: 35.0pp · 2024: 44.9pp
- All cycles
- 2024: D+44.9 2020: D+46.4 2016: D+42.1 2012: D+29.6 2008: D+35.0
Not yet ingested
- Civics
- —
Market trends
- HPI YoY
- ▼ -73.29%
- Current HPI
- 258.4993
- Rent YoY
- —
- Metro
- Atlanta-Sandy Springs-Alpharetta, GA
- State GDP YoY
- ▲ 2.66%
- F500 in state
- 28
Industry mix (Fortune 500 HQ in GA)
| Industry | F500 HQs | Revenue |
|---|---|---|
| Paper / Packaging | 2 | $29B |
|
||
| Retail | 1 | $160B |
|
||
| Transportation / Logistics | 1 | $91B |
|
||
| Airlines | 1 | $62B |
|
||
| Consumer Goods | 1 | $47B |
|
||
| Utilities | 1 | $25B |
|
||
Price history
2 events — show timeline
- 2026-05-14 Pending — GAMLS
- 2026-03-06 Listed $75,000 GAMLS
Property tax history
+4.3%/yrLatest (2025): $1,141 · +43.1% YoY. Source: county tax records.
Cash-flow waterfall
monthlySold comps — $/sqft
last 12 mo · ≤1 miLoading sold comps…