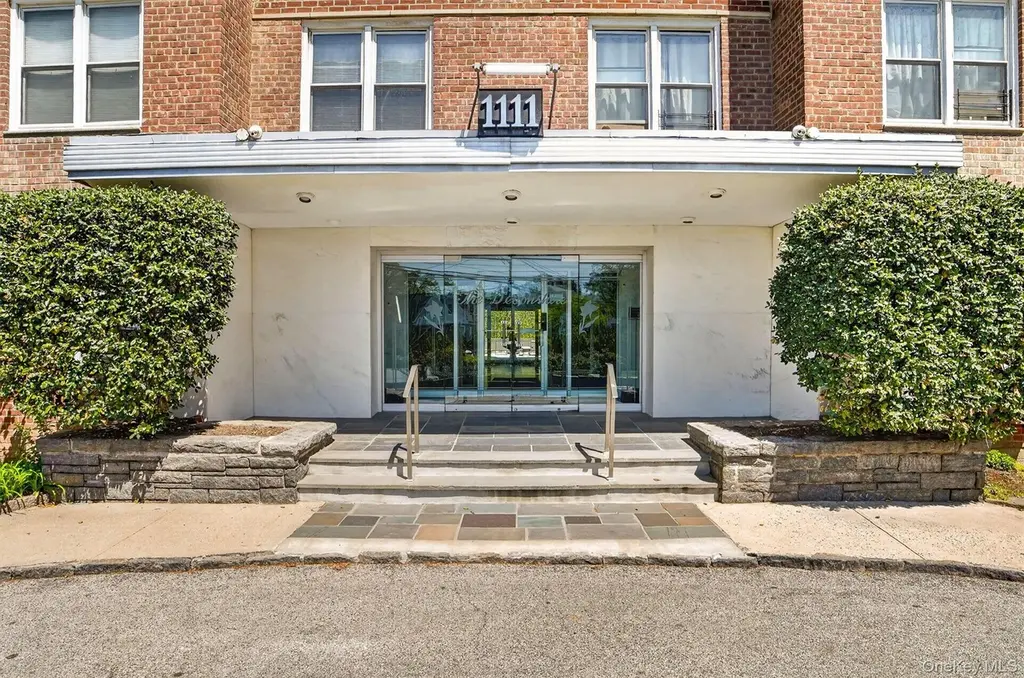
1111 Midland Ave Unit 1B · Yonkers, NY
Flood risk 6/10 · Moderate
- FEMA flood zone
- X (unshaded)
- Chance of flooding over 30 yrs
- 0.75%
- Est. flood insurance / yr
- $507 – $1,088
Fire risk 1/10 · Minimal
- Est. fire insurance / yr
- $691 – $1,283
Heat risk 6/10 · Moderate
- Hot days now (above 99°F)
- 7 days/yr
- Hot days in 30 yrs
- 15 days/yr
Wind risk 6/10 · Moderate
- Chance of severe wind over 30 yrs
- 27.0%
Air-quality risk 3/10 · Minor
- Unhealthy air days now
- 3 days/yr
- Unhealthy air days in 30 yrs
- 4 days/yr
Risk factors via First Street. Map © Google.
Why this score? — see what drove the B grade
The composite is a weighted blend of 9 inputs, each scored 0–100. Each bar is that input's sub-score; the figure is the points it added to the 100-point composite (weight × sub-score).
- Cash flow +28.9/30.0
- ARV discount +13.6/15.0
- DSCR +10.0/10.0
- 1% rule +8.1/10.0
- Schools +4.1/10.0
- Rent growth +3.6/5.0
- Livability +3.4/5.0
- Condition / age +2.5/5.0
- Appreciation +0.0/10.0
$169,000
🖨 Deal sheet (PDF) 📄 Offer letter ✓ Due diligence
Listing remarks
* * * AO, continue to show for back up * * * * * Bright and airy, this sun-drenched 1 bedroom unit is a true gem! Offering an abundance of space and closets galore, it’s designed for both comfort and convenience. Enjoy your morning coffee or unwinding in the evening on your personal terrace . The Devonshire is a sought-after mid-rise cooperative that combines convenience, comfort, and charm, with elevator access and a host of on-site amenities—including a live-in superintendent, laundry facilities, package area, storage and bicycle rooms, and parking — This home strikes the perfect balance between Bronxville and Yonkers living. Just minutes from Bronxville Village,
Key facts
- Laundry facilities
- Storage rooms
- Parking
Tags
Property features AI
Exterior
- Parking: Assigned parking; Garage parking; On-street parking; Parking lot
- Utilities: Electric service: Con Edison; Public sewer; Public trash collection
- Home design: Stock cooperative
- Construction: Brick exterior
- Exterior features: Brick construction; Not waterfront
Interior
- Kitchen: Dishwasher; Gas range; Microwave; Refrigerator
- Bedrooms: Entry level: 1
- Bathrooms: One full bathroom
- Heating & cooling: Steam heating; No central cooling
- Interior features: First-floor bedroom; First-floor full bath; Elevator access; Entrance foyer; Galley-style kitchen; His-and-hers closets
- Laundry & utility: Pets allowed — contact for details
Neighborhood map
What this means for you Summary
Snapshot
- This is a 1-bed/1.0-bath condo listed at $169k.
Deal economics
- At list price, monthly cash flow is $576 ($7k/yr) — positive.
- The deal already cash-flows at list — no discount required.
- Meets the 1% rule at list price ($2k rent vs $169k).
- Recommended offer: $166k (1.5% below list) — sets the bar for market timing.
- Cap rate 10.4% vs local median 5.3% in Yonkers — top-decile yield for the area; either an underpriced asset or a hidden risk that comps aren't pricing in. Stress-test before assuming the spread holds.
Location & tenants
- Location reads 68/100 on livability (#528 in NY) — a middle-class / working-renter tenant base. Strengths: employment A, commute B; Watch: amenities F, cost of living F.
- Yonkers City School District (suburban): math 41% / reading 54% proficiency, ranked #413 of 590 in NY (top 70%) — families likely to look elsewhere, expect single-tenant / working-renter base with shorter leases; 64% free/reduced lunch — lower-income household profile, screen leases tightly.
- Zoned schools: Yonkers Early Childhood Academy (327 students, 72% FRL); Yonkers Middle School (math 17% / reading 37%, grade F, #587 of 729 statewide, top 81%, 601 students, 88% FRL); Yonkers High School (math 92% / reading 88%, grade A+, #238 of 1,100 statewide, top 23%, 1,060 students, 76% FRL) — zoned schools average 79% FRL vs 64% district-wide (15 pts higher); higher-poverty schools than district average — tighter screening recommended.
- Market conditions: Rents rising fast (+4.3%/yr); 245 active listings in the ZIP; 13 comparable units currently listed for rent nearby; rentals at typical pace (median 15d on market — plan ~3-4 weeks tenant-placement turnaround); high-income renter base; 954 units permitted in Westchester County in 2024 (649 in 5+ unit buildings).
Forward outlook
- Local home prices are declining (-3.0%/yr); year-one equity from $1k of loan paydown is wiped out by about $5k of value loss. Plan a longer hold.
- Westchester County population projected at +10% by 2050 — modest demand growth; plan on rents tracking national, not racing it.
- At projected returns (-3.0% appreciation + 4.3% rent growth), your $47k cash investment doubles in ~8 years — after that, you're playing with house money.
Negotiation context
- It's been on market 20 days — a 2% lower offer ($166k) is reasonable based on typical stale-listing flexibility.
- 9 sale attempts since 21y ago with the ask held roughly flat each time — persistent listings suggest the price (not the market) is what's stuck; bring a comps-based counter.
- Current owner paid $133k; 27% above their basis — modest negotiation headroom, anchor on the comps not their cost.
Risks & watch-outs
- Watch-outs: built in 1956 — expect roof / HVAC / electrical / plumbing capex.
- Climate carrying-cost: major flood risk; major wind risk, 27% chance of damaging wind over 30y; extreme-heat days projected 7→15/yr by 2055 (HVAC capex compounding) — expect insurance premiums to compound above CPI over the hold.
Questions for the listing agent
- Built in 1956 — when were the roof, HVAC, electrical panel, plumbing, and water heater last replaced?
- Any open or pending special assessments — roof, HVAC, plumbing, elevator, façade? What's the per-unit balance and payoff schedule, and is the seller paying it off at close or rolling it to the buyer?
- Is there a deadline driving the sale (1031 exchange, divorce, estate, relocation)? That informs how much negotiation room exists.
- What's the average days-on-market for RENTAL listings here right now (not sales)? A rising rental-DOM trend means longer vacancies and softer asking-rent achievability than the comps imply.
- What's the recent tenant-quality profile in this submarket — average credit score on applications, eviction rate, late-payment / NSF rate, and stable-employment percentage? A property-management company in the area should have these aggregated.
- How much new apartment / multifamily construction is in the pipeline within 1–3 miles? Heavy new supply (>2% of stock underway) typically softens rents 12–24 months out; light construction supports rent growth.
Investment metrics
- 1% rule
- 1.31% ✓
- Cap rate
- 10.38%
- Cash-on-cash
- 14.60%
- DSCR
- 1.65
- GRM
- 6.4
CMA / ARV
- ARV (median comp)
- $195,640
- List price
- $169,000
- Delta
- -13.62%
- Verdict
- UNDERPRICED
- Comps
- 20 within 1.0 mi
Projected returns pro-forma
-3.0% appreciation · 4.27% rent growth · sell at horizon
- IRR
- 6.5%
- Equity multiple
- 1.26×
- Total profit
- $12,162
- Equity at exit
- $25,198
- IRR
- 17.0%
- Equity multiple
- 2.48×
- Total profit
- $69,955
- Equity at exit
- $14,612
Cash invested: $47,320 (down + closing). Projections, not guarantees.
Landlord ↔ Tenant lean methodology
- Overall (CITY)
- 5 Strongly Tenant-Friendly
- State New York
- 15 Strongly Tenant-Friendly · D+10
- County
- — inherits STATE
- City Yonkers
- 5 Strongly Tenant-Friendly · D+20
ZIP-level market 10708
- Rents YoY
- 4.3%
- Active inventory
- 245
- Price-to-rent
- 6.4×
Monthly cashflow live
- Estimated rent
- $2,207 high interval (Pro) →
- Mortgage (P&I)
- −$886
- Tax est. 1.5%
- −$211 /mo · $2,535/yr
- Insurance
- −$70
- HOA
- −$0
- Vacancy / Maint / Mgmt
- −$463
- Net cashflow
- $576
Break-even live
Sensitivity live
| Price | -10% $692 | -5% $634 | +0% $576 | +5% $517 | +10% $459 |
|---|---|---|---|---|---|
| Rent | -10% $401 | -5% $488 | +0% $576 | +5% $663 | +10% $750 |
| Rate | -1.0pp $661 | -0.5pp $619 | base $576 | +0.5pp $532 | +1.0pp $487 |
UW: 25.0% down · 7.5% · 30yr · 1.5% tax · 5.0% vac · 8.0% maint · 8.0% mgmt
Financing live
Cash to close
- Down payment
- $42,250
- Closing costs
- $5,070
- Reserves months
- —
- Total cash needed
- —
Loan-product check · same deal, 3 products live
Conventional
25% down · 7.5% · 30yr
- Down + closing
- —
- Monthly P&I
- —
- Monthly cashflow
- —
- DSCR
- —
- Eligible?
- —
Personal DTI + credit; lowest rate.
DSCR
20% down · 8.5% · 30yr
- Down + closing
- —
- Monthly P&I
- —
- Monthly cashflow
- —
- DSCR
- —
- Eligible?
- —
No personal income docs; deal must DSCR.
Hard money
10% down · 12.0% · 12mo
- Down + closing
- —
- Monthly P&I
- —
- Monthly cashflow
- —
- DSCR
- —
- Eligible?
- —
Short-term bridge; refi at stabilization.
Rent comps 13 comps
| Address | Beds | Baths | Sqft | Rent | $/sqft | DOM | Units | Dist |
|---|---|---|---|---|---|---|---|---|
| 28 Kenilworth Rd Unit The Cottage Yonkers, NY | 1.0 | 1.0 | 600 | $1,950 | $3.25 | 15d | 1 | 0.88mi |
| 42 Broad St W Mount Vernon, NY | 3.0 | 1.0–2.0 | 955 | $2,841 | $2.97 | 2d | 16 | 0.94mi |
| 42 Broad St W Mount Vernon, NY | 3.0 | 1.0–2.0 | 1014 | $3,956 | $3.90 | 24d | 15 | 0.94mi |
| 669 N Terrace Ave Mount Vernon, NY | 1.0 | 1.0 | 750 | $2,031 | $2.71 | 25d | 1 | 0.94mi |
| 247 Mile Square Rd Unit 1ST Yonkers, NY | — | 1.5 | 350 | $1,650 | $4.71 | 5d | 1 | 0.96mi |
| 247 Mile Square Rd Yonkers, NY | — | 1.0 | 350 | $1,650 | $4.71 | 5d | 1 | 0.96mi |
| 33 William St Mount Vernon, NY | 1.0–2.0 | 1.0 | 725 | $1,850 | $2.55 | 22d | 2 | 1.04mi |
| 42 Winchester Ave Unit 2A Yonkers, NY | 1.0 | 1.0 | 700 | $2,100 | $3.00 | 14d | 1 | 1.16mi |
| 8 Wainwright Ave Unit 2A Yonkers, NY | — | 1.0 | 700 | $1,600 | $2.29 | 8d | 1 | 1.27mi |
| 12 Wainwright Ave Apt 1B Yonkers, NY | 1.0 | 1.0 | 700 | $1,950 | $2.79 | 44d | 1 | 1.29mi |
| 103 North St Mount Vernon, NY | 1.0 | 1.0 | 720 | $1,900 | $2.64 | 21d | 1 | 1.35mi |
| 717 Tuckahoe Rd Unit 16A Yonkers, NY | 1.0 | 1.0 | 650 | $2,495 | $3.84 | 5d | 1 | 1.38mi |
| 411 Bronx River Rd Unit 2K Yonkers, NY | — | 1.0 | 516 | $1,795 | $3.48 | 0d | 1 | 1.44mi |
HOA detail condo
- Monthly dues
- $0 · $0/yr
- Assessments
- None detected in remarks — confirm with the listing agent.
Listing history 27 events
-
2026-05-14status Pending 958-char remark
-
2026-04-24$169,000 Active 958-char remark
-
2023-03-09status Active
-
2023-01-04status Pending
-
2022-11-08price $139,000
-
2022-09-14price $140,000
-
2022-06-15$149,999 Active
-
2022-06-11historical
-
2022-05-11price $144,999
-
2022-03-05price $149,999
-
2022-01-11$155,000 Active
-
2020-02-19historical
-
2020-01-02price $160,000
-
2019-11-09$163,500 Active
-
2010-10-06historical Cancelled
-
2010-09-14status Active
-
2010-09-04historical
-
2010-09-02historical Pending
-
2010-08-14price
-
2010-08-04price
-
2010-07-23price
-
2010-07-12Active
-
2006-10-20soldstatus $133,000
-
2006-10-20price $159,000
-
2006-05-15$133,000
-
2005-12-13historical
-
2005-11-07
ⓘ Source: listings_history table (triggers on properties + properties_extension) + one-shot
backfill from property_details.listing_events for pre-trigger history.
Climate risk First Street
- Flood 6/10 Major FEMA zone X (unshaded) · 75% chance over 30 yrs
- Wildfire 1/10 Low
- Heat 6/10 Major 7 d/yr ≥99°F today · 15 d/yr by 30 yrs out
- Wind 6/10 Major 27% chance of damaging wind over 30 yrs
- Air quality 3/10 Moderate 3 unhealthy d/yr today · 4 by 30 yrs out
Nearby sold comps map
Loading sold comps map…
Walkable amenities ~0.75 mi
Loading nearby amenities…
Taxation est. · year 1
- Rental income
- $26,483
- − Mortgage interest
- −$9,467
- − Property taxes
- −$2,535
- − Insurance
- −$845
- − Repairs & maintenance
- −$2,119
- − Management
- −$2,119
- − Depreciation
- −$4,916
- Taxable income
- $4,483
- Est. tax owed @ 24.0%
- −$1,076
- After-tax cash flow
- $5,831/yr
For passive investors: Depreciation is non-cash, so a rental often shows a tax loss while cash-flowing — sheltering income. Rental losses are passive: they offset passive income freely, and up to $25,000/yr can offset ordinary (W-2) income if you actively participate and your MAGI is under $100k (phasing out to $0 by $150k); unused losses carry forward. On sale, claimed depreciation is recaptured at up to 25%, and gains may owe capital-gains tax (a 1031 exchange can defer both). Figures are a year-1 estimate at your 24.0% rate — not tax advice; consult a CPA.
Schools (NCES district)
- District
- Yonkers City School District
- NCES district ID
- 3631920
- Math proficiency
- 41% ▼ -1.00%
- Reading proficiency
- 54% ▲ 14.00%
- Median HH income
- $58,042
- Composite
- 41.43/100
- National rank
- #3471
- State rank
- #413 of 590 in NY
Livability — Yonkers
- Score
- 68/100
- State rank
- #528
- US rank
- #9394
Category grades
Schools grade is shown separately in the Schools card above.
Census & demographics
- Census place
- Yonkers, NY
- County
- Westchester County · 709,332 people
- City population
- 212,407
- Metro
- New York-Newark-Jersey City, NY-NJ-PA
- Population (ZIP)
- 22,482
- Household income
- $126,343
- Rent vs Own
- Severe rent burden
- 357.0
Population outlook (Westchester County) Hauer SSP2
- Today (2025)
- 1,028,035 people
- By 2030
- 1,051,636 · +2.3%
- By 2040
- 1,098,520 · +6.9%
- By 2050
- 1,136,044 · +10.5%
- By 2075
- 1,196,925 · +16.4%
- By 2100
- 1,175,147 · +14.3%
Race, ethnicity, and origin ACS 2023
- Neighborhood character
- Predominantly White (69%)
- Race & ethnicity
- White 69% Hispanic / Latino 17% Two or more races 10% Black 6% Asian 4%
- Hispanic origin (detail)
- Puerto Rican 7% Dominican 3%
- Common ancestry
- Romanian 2% Lithuanian 2% Scotch-Irish 1%
- Foreign-born
- 16% · Canada, China
- Languages at home
- 76% English-only · Spanish 10% Other Indo-European 6% Other Asian/Pacific 2%
Political lean MEDSL · Westchester
- 2024 margin
- Strong D (+26.3) · D 63.1% · R 36.9%
- 2008→2024 swing
- -1.3pp toward R · 2008: 27.6pp · 2024: 26.3pp
- All cycles
- 2024: D+26.3 2020: D+36.3 2016: D+32.8 2012: D+22.2 2008: D+27.6
Not yet ingested
- Civics
- —
Market trends
- HPI YoY
- ▼ -668.11%
- Current HPI
- 203.4295
- Rent YoY
- ▲ 4.27%
- Metro
- New York-Newark-Jersey City, NY-NJ-PA
- State GDP YoY
- ▲ 2.60%
- F500 in state
- 92
Industry mix (Fortune 500 HQ in NY)
| Industry | F500 HQs | Revenue |
|---|---|---|
| Financial Services | 10 | $950B |
|
||
| Consumer Goods | 9 | $162B |
|
||
| Insurance | 4 | $225B |
|
||
| Telecommunications | 2 | $144B |
|
||
| Pharmaceuticals | 2 | $112B |
|
||
| Media / Entertainment | 2 | $69B |
|
||
Price history
+27.1% since first listed27 events — show timeline
- 2026-05-14 Pending — OneKey® MLS as Distributed by MLS Grid
- 2026-04-24 Listed $169,000 OneKey® MLS as Distributed by MLS Grid
- 2023-03-09 Relisted — OneKey® MLS as Distributed by MLS Grid
- 2023-01-04 Pending — OneKey® MLS as Distributed by MLS Grid
- 2022-11-08 Price Changed $139,000 OneKey® MLS as Distributed by MLS Grid
- 2022-09-14 Price Changed $140,000 OneKey® MLS as Distributed by MLS Grid
- 2022-06-15 Listed $149,999 OneKey® MLS as Distributed by MLS Grid
- 2022-06-11 Listing Removed — OneKey® MLS as Distributed by MLS Grid
- 2022-05-11 Price Changed $144,999 OneKey® MLS as Distributed by MLS Grid
- 2022-03-05 Price Changed $149,999 OneKey® MLS as Distributed by MLS Grid
- 2022-01-11 Listed $155,000 OneKey® MLS as Distributed by MLS Grid
- 2020-02-19 Listing Removed — OneKey® MLS as Distributed by MLS Grid
- 2020-01-02 Price Changed $160,000 OneKey® MLS as Distributed by MLS Grid
- 2019-11-09 Listed $163,500 OneKey® MLS as Distributed by MLS Grid
- 2010-10-06 Delisted — HGMLS
- 2010-09-14 Relisted — HGMLS
- 2010-09-04 Delisted — HGMLS
- 2010-09-02 Contingent — HGMLS
- 2010-08-14 Price Changed — HGMLS
- 2010-08-04 Price Changed — HGMLS
- 2010-07-23 Price Changed — HGMLS
- 2010-07-12 Listed — HGMLS
- 2006-10-20 Price Changed $159,000 HGMLS
- 2006-10-20 Sold (MLS) $133,000 HGMLS
- 2006-05-15 Listed $133,000 HGMLS
- 2005-12-13 Delisted — HGMLS
- 2005-11-07 Listed — HGMLS
Cash-flow waterfall
monthlySold comps — $/sqft
last 12 mo · ≤1 miLoading sold comps…