30 Tarragon Way · New Lebanon, OH
Flood risk 1/10 · Minimal
- FEMA flood zone
- X (unshaded)
- Chance of flooding over 30 yrs
- 0.0%
- Est. flood insurance / yr
- $507 – $1,088
Fire risk 1/10 · Minimal
- Est. fire insurance / yr
- $713 – $1,323
Heat risk 3/10 · Minor
- Hot days now (above 101°F)
- 7 days/yr
- Hot days in 30 yrs
- 19 days/yr
Wind risk 2/10 · Minimal
- Chance of severe wind over 30 yrs
- 1.0%
Air-quality risk 2/10 · Minimal
- Unhealthy air days now
- 1 days/yr
- Unhealthy air days in 30 yrs
- 2 days/yr
Risk factors via First Street. Map © Google.
Why this score? — see what drove the D grade
The composite is a weighted blend of 9 inputs, each scored 0–100. Each bar is that input's sub-score; the figure is the points it added to the 100-point composite (weight × sub-score).
- Cash flow +11.6/30.0
- Appreciation +10.0/10.0
- Schools +4.2/10.0
- Livability +3.5/5.0
- DSCR +3.4/10.0
- 1% rule +3.1/10.0
- ARV discount +2.6/15.0
- Rent growth +2.5/5.0
- Condition / age +2.5/5.0
$249,000
🖨 Deal sheet (PDF) 📄 Offer letter ✓ Due diligence
Listing remarks MLS
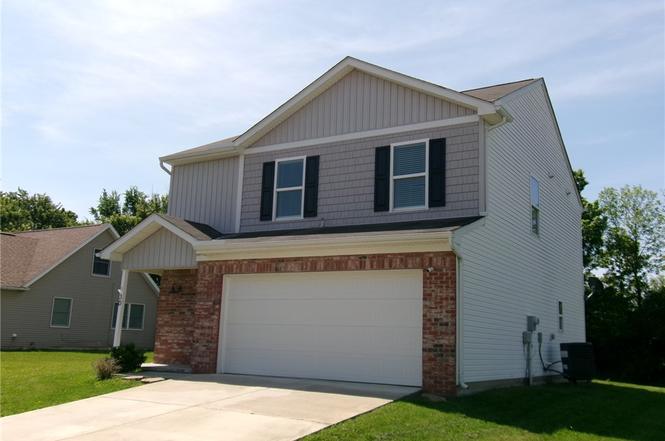
Better than new! This less than 1 year old property features 3 bedrooms, 2.5 bathrooms, a loft, new appliances, a new large rear patio and much more!
Key facts
- Al fresco dining
- Versatile layout
- Inviting patio
Tags
Property features AI
Finance
- Financial info: Offered for sale
Exterior
- Parking: Attached two-car garage
- Utilities: Public water; Storm sewer; Sewer available; Water available
- Home design: 2 stories; Frame construction with vinyl and wood siding; Slab foundation
- Construction: Frame, vinyl siding, and wood siding construction; Slab foundation
- Exterior features: Patio; Residential zoning
Interior
- Kitchen: Kitchen (13 x 17); Built-In Oven; Range; Dishwasher; Refrigerator
- Bedrooms: Main level bedroom (10 x 10); Second level bedroom (10 x 10); Second level bedroom (12 x 14)
- Bathrooms: 2 full bathrooms; 1 half bathroom; 1 main level bathroom
- Heating & cooling: Central air conditioning; Electric forced-air heating
- Interior features: 8 total rooms; Entry/foyer; Living room; Loft; Utility room
- Laundry & utility: Washer; Dryer; Utility room (6 x 7)
Neighborhood map
What this means for you Summary
Snapshot
- This is a 3-bed/2.5-bath single-family listed at $249k.
Deal economics
- At list price, monthly cash flow is $-79 ($-953/yr) — negative.
- To cash-flow at today's rent, offer at most $235k (5.6% below list).
- To meet the 1% rule (rent ≥ 1% of price), the offer needs to be $201k (19.1% below list).
- Recommended offer: $201k (19.1% below list) — sets the bar for 1% rule.
Location & tenants
- Location reads 70/100 on livability (#450 in OH) — a middle-class / working-renter tenant base. Strengths: cost of living A+, housing A+, crime A; Watch: employment C-, amenities F, commute F.
- New Lebanon Local (town): math 43% / reading 56% proficiency, ranked #448 of 656 in OH (top 68%) — families likely to look elsewhere, expect single-tenant / working-renter base with shorter leases.
- Market conditions: 20 active listings in the ZIP; 3 comparable units currently listed for rent nearby; rentals leasing fast (median 3d on market — plan ~1-2 weeks tenant-placement turnaround); solid renter incomes; 907 units permitted in Montgomery County in 2024 (416 in 5+ unit buildings).
- This rent runs 31% of the median local income ($77k/yr) — at the standard rent-burdened threshold; future hikes will face affordability resistance.
Forward outlook
- In year one you build about $27k of equity ($2k loan paydown + $25k appreciation (10.0% local appreciation)).
- Montgomery County population projected at -10% by 2050 — secular population decline; favor cash flow + early exit over multi-decade hold.
- At projected returns (10.0% appreciation + 3.0% rent growth), your $70k cash investment doubles in ~3 years — after that, you're playing with house money.
- By year 2, paydown + projected appreciation supports a ~$43k cash-out refi (75% LTV) — recoverable capital for the next deal without selling this one.
Negotiation context
- Only 1 days on market — expect competitive offers; lowballing is unlikely to land.
- 9 sale attempts since 7y ago with the ask held roughly flat each time — persistent listings suggest the price (not the market) is what's stuck; bring a comps-based counter.
- Current owner paid $202k; 23% above their basis — modest negotiation headroom, anchor on the comps not their cost.
Questions for the listing agent
- What do current leases actually rent for vs. the listed asking? Can we see a recent rent roll and the last 12 months of T-12 income?
- Is there a deadline driving the sale (1031 exchange, divorce, estate, relocation)? That informs how much negotiation room exists.
- Schools are B-rated — typically a magnet for longer-tenancy family renters. What's the average tenant stay here, and is there a school-zone premium baked into asking?
- The area grade is low — what's the realistic commute time and amenity access for the typical tenant pool here? Any planned neighborhood developments (good or bad) we should know about?
- What's the average days-on-market for RENTAL listings here right now (not sales)? A rising rental-DOM trend means longer vacancies and softer asking-rent achievability than the comps imply.
- What's the recent tenant-quality profile in this submarket — average credit score on applications, eviction rate, late-payment / NSF rate, and stable-employment percentage? A property-management company in the area should have these aggregated.
- How much new for-sale + rental construction is in the pipeline within 1–3 miles? Heavy new supply typically softens prices + rents 12–24 months out; constrained supply supports both.
Investment metrics
- 1% rule
- 0.81% ✗
- Cap rate
- 5.91%
- Cash-on-cash
- -1.37%
- DSCR
- 0.94
- GRM
- 10.3
CMA / ARV
- ARV (on-the-fly)
- $224,680
- Comps found
- 9
Show comp detail 9 sales within ~0.75 mi
| Address | Dist | Beds/Ba | Sqft | Sold | Price | $/sf | Match |
|---|---|---|---|---|---|---|---|
| 91 Tarragon Way | 0.06mi | 3/2.0 | 1,519 (-7%) | 1mo | $238,000 | $157 | 82 |
| 831 S Church St | 0.18mi | 3/2.0 | 1,722 (+5%) | 22mo | $320,000 | $186 | 63 |
| 229 Blosser St | 0.54mi | 3/2.0 | 1,728 (+5%) | 1mo | $236,000 | $137 | 63 |
| 630 Holderman Pl | 0.05mi | 4/2.0 (+1) | 1,420 (-13%) | 7mo | $240,000 | $169 | 63 |
| 107 Laredo Ave | 0.42mi | 3/1.0 | 1,503 (-8%) | 6mo | $195,000 | $130 | 56 |
| 625 Holderman Pl | 0.07mi | 4/3.0 (+1) | 1,880 (+15%) | 22mo | $265,000 | $141 | 47 |
| 303 S Church St | 0.48mi | 2/1.0 (-1) | 1,402 (-14%) | 9mo | $145,000 | $103 | 35 |
| 215 Mills Pl | 0.53mi | 3/1.5 | 1,394 (-15%) | 20mo | $188,700 | $135 | 30 |
| 718 Greyhound Dr | 0.71mi | 2/2.0 (-1) | 1,466 (-11%) | 19mo | $193,000 | $132 | 26 |
Match score weights: distance 35% · size 25% · config 20% · recency 20%. Top-matched comps best support the ARV.
Projected returns pro-forma
10.0% appreciation · 3.0% rent growth · sell at horizon
- IRR
- 23.3%
- Equity multiple
- 2.87×
- Total profit
- $130,554
- Equity at exit
- $224,319
- IRR
- 20.8%
- Equity multiple
- 6.57×
- Total profit
- $388,435
- Equity at exit
- $483,752
Cash invested: $69,720 (down + closing). Projections, not guarantees.
Landlord ↔ Tenant lean methodology
- Overall (STATE)
- 73 Landlord-Friendly
- State Ohio
- 73 Landlord-Friendly · R+6
- County
- — inherits STATE
- City
- — inherits STATE
ZIP-level market 45345
- Home prices YoY
- 8.0%
- Active inventory
- 20
- Price-to-rent
- 10.3×
Monthly cashflow live
- Estimated rent
- $2,014 medium interval (Pro) →
- Mortgage (P&I)
- −$1,306
- Tax from tax record
- −$261 /mo · $3,132/yr
- Insurance
- −$104
- HOA
- −$0
- Vacancy / Maint / Mgmt
- −$423
- Net cashflow
- $-79
Break-even live
Sensitivity live
| Price | -10% $62 | -5% $-9 | +0% $-79 | +5% $-150 | +10% $-220 |
|---|---|---|---|---|---|
| Rent | -10% $-239 | -5% $-159 | +0% $-79 | +5% $0 | +10% $80 |
| Rate | -1.0pp $46 | -0.5pp $-16 | base $-79 | +0.5pp $-144 | +1.0pp $-210 |
UW: 25.0% down · 7.5% · 30yr · 1.5% tax · 5.0% vac · 8.0% maint · 8.0% mgmt
Financing live
Cash to close
- Down payment
- $62,250
- Closing costs
- $7,470
- Reserves months
- —
- Total cash needed
- —
Loan-product check · same deal, 3 products live
Conventional
25% down · 7.5% · 30yr
- Down + closing
- —
- Monthly P&I
- —
- Monthly cashflow
- —
- DSCR
- —
- Eligible?
- —
Personal DTI + credit; lowest rate.
DSCR
20% down · 8.5% · 30yr
- Down + closing
- —
- Monthly P&I
- —
- Monthly cashflow
- —
- DSCR
- —
- Eligible?
- —
No personal income docs; deal must DSCR.
Hard money
10% down · 12.0% · 12mo
- Down + closing
- —
- Monthly P&I
- —
- Monthly cashflow
- —
- DSCR
- —
- Eligible?
- —
Short-term bridge; refi at stabilization.
Rent comps 3 comps
| Address | Beds | Baths | Sqft | Rent | $/sqft | DOM | Units | Dist |
|---|---|---|---|---|---|---|---|---|
| 570 Holderman Pl New Lebanon, OH | 4.0 | 3.0 | 2007 | $2,200 | $1.10 | 3d | 1 | 0.14mi |
| 575 Holderman Pl New Lebanon, OH | 4.0 | 3.0 | 2007 | $2,200 | $1.10 | 3d | 1 | 0.16mi |
| 20 Clinchfield Ct New Lebanon, OH | 2.0 | 2.0 | 1362 | $1,600 | $1.17 | 3d | 1 | 0.17mi |
Listing history 2 events
-
2026-06-18remarks 699-char remark
-
2026-06-18$249,000 Active 1 DOM
ⓘ Source: listings_history table (triggers on properties + properties_extension) + one-shot
backfill from property_details.listing_events for pre-trigger history.
Tax reassessment forecast OH · Partial reset (capped growth)
- Current annual tax
- $3,132 · $261/mo
- Projected year-2 tax
- $3,508 · $292/mo
- Expected delta
- +$376/yr (+$31/mo · 12.0%)
ⓘ Screening estimate from a state-policy table — verify with the county assessor before closing.
Climate risk First Street
- Flood 1/10 Low FEMA zone X (unshaded) · 0% chance over 30 yrs
- Wildfire 1/10 Low
- Heat 3/10 Moderate 7 d/yr ≥101°F today · 19 d/yr by 30 yrs out
- Wind 2/10 Low 100% chance of damaging wind over 30 yrs
- Air quality 2/10 Low 1 unhealthy d/yr today · 2 by 30 yrs out
Nearby sold comps map
Loading sold comps map…
Walkable amenities ~0.75 mi
Loading nearby amenities…
Taxation est. · year 1
- Rental income
- $24,169
- − Mortgage interest
- −$13,948
- − Property taxes
- −$3,132
- − Insurance
- −$1,245
- − Repairs & maintenance
- −$1,934
- − Management
- −$1,934
- − Depreciation
- −$7,244
- Taxable loss
- −$5,267
- Est. tax savings @ 24.0%
- +$1,264
- After-tax cash flow
- $311/yr
For passive investors: Depreciation is non-cash, so a rental often shows a tax loss while cash-flowing — sheltering income. Rental losses are passive: they offset passive income freely, and up to $25,000/yr can offset ordinary (W-2) income if you actively participate and your MAGI is under $100k (phasing out to $0 by $150k); unused losses carry forward. On sale, claimed depreciation is recaptured at up to 25%, and gains may owe capital-gains tax (a 1031 exchange can defer both). Figures are a year-1 estimate at your 24.0% rate — not tax advice; consult a CPA.
Schools (NCES district)
- District
- New Lebanon Local
- NCES district ID
- 3904871
- Math proficiency
- 43% ▼ -19.00%
- Reading proficiency
- 56% ▼ -7.00%
- Median HH income
- $45,363
- Composite
- 41.88/100
- National rank
- #3369
- State rank
- #448 of 656 in OH
Livability — New Lebanon
- Score
- 70/100
- State rank
- #450
- US rank
- #7342
Category grades
Schools grade is shown separately in the Schools card above.
Census & demographics
- Census place
- New Lebanon, OH
- County
- Montgomery · 506,435 people
- City population
- 5,923
- Metro
- Dayton-Kettering-Beavercreek, OH
- Population (ZIP)
- 5,923
- Household income
- $77,279
- Rent vs Own
- Severe rent burden
- 8.9
Population outlook (Montgomery County) Hauer SSP2
- Today (2025)
- 523,241 people
- By 2030
- 514,948 · -1.6%
- By 2040
- 493,378 · -5.7%
- By 2050
- 469,639 · -10.2%
- By 2075
- 418,360 · -20.0%
- By 2100
- 353,315 · -32.5%
Race, ethnicity, and origin ACS 2023
- Neighborhood character
- Predominantly White (92%)
- Race & ethnicity
- White 92% Two or more races 6% Black 2%
- Common ancestry
- Romanian 3% Slovak 1% Scottish 1%
- Foreign-born
- 0% · China
- Languages at home
- 98% English-only · Spanish 1% German/W. Germanic 1%
Political lean MEDSL · Montgomery
- 2024 margin
- Toss-up / Even · D 49.8% · R 49.3%
- 2008→2024 swing
- -5.8pp toward R · 2008: 6.2pp · 2024: 0.5pp
- All cycles
- 2024: D+0.5 2020: D+2.2 2016: R+1.2 2012: D+3.1 2008: D+6.2
Not yet ingested
- Civics
- —
Market trends
- HPI YoY
- ▲ 27.56%
- Current HPI
- 370.29
- Rent YoY
- —
- Metro
- —
- State GDP YoY
- ▲ 1.98%
- F500 in state
- 48
Industry mix (Fortune 500 HQ in OH)
| Industry | F500 HQs | Revenue |
|---|---|---|
| Insurance | 3 | $145B |
|
||
| Industrial Machinery | 3 | $49B |
|
||
| Financial Services | 3 | $24B |
|
||
| Consumer Goods | 2 | $93B |
|
||
| Aerospace / Defense | 2 | $47B |
|
||
| Utilities | 2 | $33B |
|
||
Price history
+58.6% since first listed25 events — show timeline
- 2026-06-17 Listed $249,000 Dayton MLS
- 2022-02-14 Sold (Public Records) $202,000 Public Records
- 2021-04-30 Sold (MLS) $200,000 Dayton MLS
- 2021-04-30 Sold (MLS) $200,000 Dayton MLS
- 2021-04-30 Sold (MLS) $200,000 Cincy MLS
- 2021-03-29 Contingent — Cincy MLS
- 2021-03-29 Contingent — Dayton MLS
- 2021-03-26 Relisted — Dayton MLS
- 2021-03-25 Relisted — Cincy MLS
- 2021-03-05 Contingent — Cincy MLS
- 2021-03-05 Contingent — Dayton MLS
- 2021-03-03 Listed $189,900 Dayton MLS
- 2021-02-25 Listed $189,900 Cincy MLS
- 2020-11-19 Sold (Public Records) $165,000 Public Records
- 2020-08-28 Sold (MLS) $156,990 Dayton MLS
- 2020-08-28 Sold (MLS) $156,990 Dayton MLS
- 2020-07-21 Pending — Dayton MLS
- 2020-07-18 Listed $156,990 Dayton MLS
- 2020-04-08 Listing Removed — WRIST
- 2019-09-05 Listed $156,990 WRIST
- 2019-08-29 Listing Removed — WRIST
- 2019-07-14 Listing Removed — Dayton MLS
- 2019-05-03 Price Changed $156,990 Dayton MLS
- 2019-01-14 Listed $154,990 Dayton MLS
- 2019-01-11 Listed $156,990 WRIST
Property tax history
+14.2%/yrLatest (2025): $3,132 · -0.1% YoY. Source: county tax records.
Cash-flow waterfall
monthlySold comps — $/sqft
last 12 mo · ≤1 miLoading sold comps…