5997 County Road 3214 · Lone Oak, TX
Flood risk 1/10 · Minimal
- FEMA flood zone
- X (unshaded)
- Chance of flooding over 30 yrs
- 0.0%
- Est. flood insurance / yr
- $507 – $1,088
Fire risk 5/10 · Moderate
- Est. fire insurance / yr
- $1,222 – $2,270
Heat risk 7/10 · Major
- Hot days now (above 110°F)
- 7 days/yr
- Hot days in 30 yrs
- 24 days/yr
Wind risk 6/10 · Moderate
- Chance of severe wind over 30 yrs
- 27.0%
Air-quality risk 2/10 · Minimal
- Unhealthy air days now
- 1 days/yr
- Unhealthy air days in 30 yrs
- 1 days/yr
Risk factors via First Street. Map © Google.
Why this score? — see what drove the D- grade
The composite is a weighted blend of 9 inputs, each scored 0–100. Each bar is that input's sub-score; the figure is the points it added to the 100-point composite (weight × sub-score).
- Appreciation +10.0/10.0
- Cash flow +7.7/30.0
- ARV discount +7.5/15.0
- Schools +3.7/10.0
- Livability +2.7/5.0
- Rent growth +2.5/5.0
- Condition / age +2.5/5.0
- DSCR +1.8/10.0
- 1% rule +1.2/10.0
$250,000
🖨 Deal sheet (PDF) 📄 Offer letter ✓ Due diligence
Listing remarks
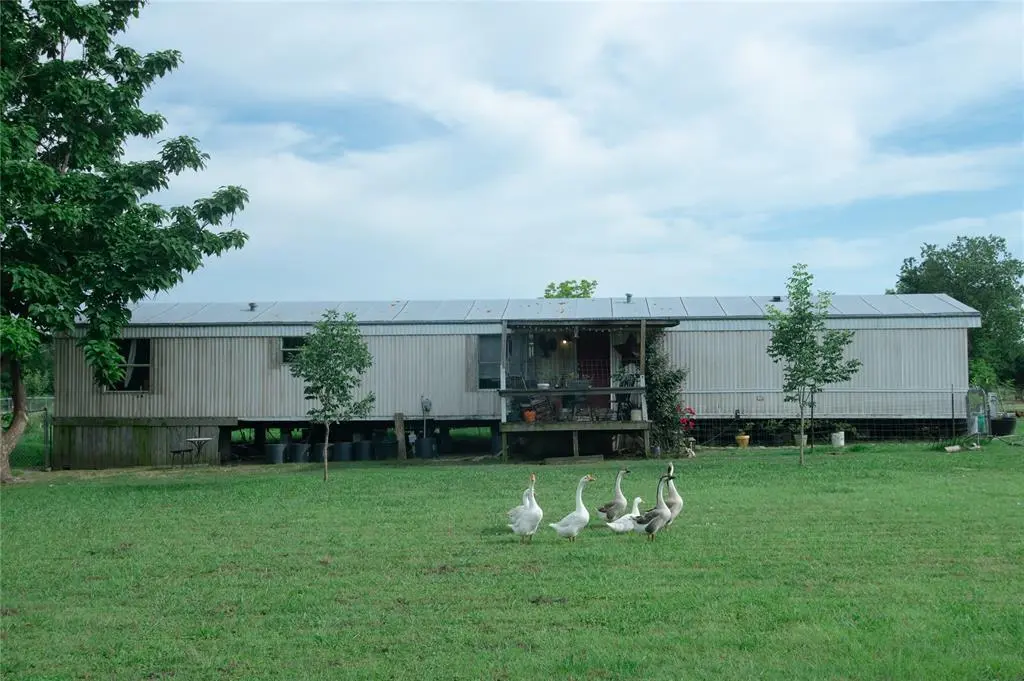
Welcome to your serene slice of country living! Situated on a 5-acre lot in Hunt County, this manufactured home for sale at 5997 County Road 3214 offers the perfect blend of rural tranquility and accessible amenities. This charming 1,152-square-foot residence provides a comfortable, open layout, making it an excellent opportunity for anyone seeking Lone Oak TX real estate. This 5 acre lot presents endless possibilities, whether you dream of establishing a vibrant garden, raising chickens, keeping agricultural projects, or simply enjoying the expansive outdoor space and wide-open Texas skies. A spacious barn provides ample space for animals and equipment and is located near the large pond to
Key facts
- Near lake tawakoni
- 5 acre lot
- Spacious barn
Tags
Property features AI
Finance
- Other: 5.0-acre lot (FM road frontage; asphalt road access); Will not subdivide; Horse permitted; horse amenities include equipment barn, goat/sheep barn, holding pens
- Financial info: Listing terms: Cash or Conventional; Loan type treated as clear; No second mortgage
- HOA & community: No association
Exterior
- Parking: Additional parking; Gravel parking; No garage / no covered carport
- Utilities: City water; Septic (including aerobic septic); Electricity connected
- Home design: Mobile home (residential); Property currently used for agricultural, hunting/fishing, livestock, poultry, sheep/goats; Property attached
- Construction: Built in 2002
- Exterior features: Covered patio/porch; RV hookup; Stable/Barn; Barn(s); Poultry coop; Barbed wire fencing; Grassed and partially wooded vegetation; Pasture; Tank/pond; Acreage, agricultural use
Interior
- Kitchen: Dishwasher; Disposal; Electric oven; Electric range
- Bedrooms: 3 bedrooms (all on main level)
- Bathrooms: 2 full bathrooms
- Heating & cooling: Central air; Electric heating
- Interior features: Open floorplan; Cable TV available; 5 total rooms; 1 living area; 1 dining area; One level
- Laundry & utility: Full-size washer/dryer area; Washer hookup; Electric dryer hookup; Electric water heater
Neighborhood map
What this means for you Summary
Snapshot
- This is a 3-bed/2.0-bath manufactured listed at $250k.
Deal economics
- At list price, monthly cash flow is $-289 ($-3k/yr) — negative.
- To cash-flow at today's rent, offer at most $199k (20.4% below list).
- To meet the 1% rule (rent ≥ 1% of price), the offer needs to be $155k (38.2% below list).
- Recommended offer: $155k (38.2% below list) — sets the bar for 1% rule.
- Cap rate 4.9% vs local median 2.2% in Lone Oak — top-decile yield for the area; either an underpriced asset or a hidden risk that comps aren't pricing in. Stress-test before assuming the spread holds.
Location & tenants
- Location reads 53/100 on livability (#1,438 in TX) — a working-class tenant base; expect higher turnover. Strengths: cost of living A+, housing A+; Watch: employment D+, crime F, amenities F.
- Lone Oak ISD (rural): math 42% / reading 43% proficiency, ranked #310 of 826 in TX (top 38%) — families likely to look elsewhere, expect single-tenant / working-renter base with shorter leases.
- Zoned schools: Lone Oak El (math 37% / reading 42%, grade F, #1,545 of 4,322 statewide, top 38%, 489 students, 45% FRL); Lone Oak Middle (math 45% / reading 43%, grade D, #512 of 1,662 statewide, top 32%, 254 students, 48% FRL); Lone Oak H S (math 52% / reading 47%, grade D, #509 of 1,632 statewide, top 34%, 340 students, 43% FRL).
- Market conditions: 115 active listings in the ZIP; 1,289 units permitted in Hunt County in 2024 (527 in 5+ unit buildings).
Forward outlook
- In year one you build about $27k of equity ($2k loan paydown + $25k appreciation (10.0% local appreciation)).
- Hunt County population projected at +15% by 2050 — modest demand growth; plan on rents tracking national, not racing it.
- By year 2, paydown + projected appreciation supports a ~$43k cash-out refi (75% LTV) — recoverable capital for the next deal without selling this one.
Negotiation context
- Only 9 days on market — expect competitive offers; lowballing is unlikely to land.
Risks & watch-outs
- Climate carrying-cost: major wind risk, 27% chance of damaging wind over 30y; moderate wildfire risk; extreme-heat days projected 7→24/yr by 2055 (HVAC capex compounding) — expect insurance premiums to compound above CPI over the hold.
Questions for the listing agent
- What do current leases actually rent for vs. the listed asking? Can we see a recent rent roll and the last 12 months of T-12 income?
- Is there a deadline driving the sale (1031 exchange, divorce, estate, relocation)? That informs how much negotiation room exists.
- Schools are D-rated, which usually means shorter tenancies and higher turnover. Who's the typical renter profile here, and what's been the actual vacancy rate?
- Crime grade is F in this area — have there been break-ins, vandalism, or insurance claims at this property in the last 3 years? What carrier currently insures it and at what premium?
- The area grade is low — what's the realistic commute time and amenity access for the typical tenant pool here? Any planned neighborhood developments (good or bad) we should know about?
- What's the average days-on-market for RENTAL listings here right now (not sales)? A rising rental-DOM trend means longer vacancies and softer asking-rent achievability than the comps imply.
- What's the recent tenant-quality profile in this submarket — average credit score on applications, eviction rate, late-payment / NSF rate, and stable-employment percentage? A property-management company in the area should have these aggregated.
- How much new for-sale + rental construction is in the pipeline within 1–3 miles? Heavy new supply typically softens prices + rents 12–24 months out; constrained supply supports both.
Investment metrics
- 1% rule
- 0.62% ✗
- Cap rate
- 4.90%
- Cash-on-cash
- -4.96%
- DSCR
- 0.78
- GRM
- 13.5
CMA / ARV
No comps found within radius.
Projected returns pro-forma
10.0% appreciation · 3.0% rent growth · sell at horizon
- IRR
- 20.7%
- Equity multiple
- 2.68×
- Total profit
- $117,614
- Equity at exit
- $225,220
- IRR
- 18.8%
- Equity multiple
- 6.15×
- Total profit
- $360,631
- Equity at exit
- $485,695
Cash invested: $70,000 (down + closing). Projections, not guarantees.
Landlord ↔ Tenant lean methodology
- Overall (STATE)
- 87 Strongly Landlord-Friendly
- State Texas
- 87 Strongly Landlord-Friendly · R+5
- County
- — inherits STATE
- City
- — inherits STATE
ZIP-level market 75453
- Home prices YoY
- 25.2%
- Active inventory
- 115
- Price-to-rent
- 13.5×
Monthly cashflow live
- Estimated rent
- $1,546 medium interval (Pro) →
- Mortgage (P&I)
- −$1,311
- Tax from tax record
- −$95 /mo · $1,144/yr
- Insurance
- −$104
- HOA
- −$0
- Vacancy / Maint / Mgmt
- −$325
- Net cashflow
- $-289
Break-even live
Sensitivity live
| Price | -10% $-148 | -5% $-219 | +0% $-289 | +5% $-360 | +10% $-431 |
|---|---|---|---|---|---|
| Rent | -10% $-412 | -5% $-350 | +0% $-289 | +5% $-228 | +10% $-167 |
| Rate | -1.0pp $-163 | -0.5pp $-226 | base $-289 | +0.5pp $-354 | +1.0pp $-420 |
UW: 25.0% down · 7.5% · 30yr · 1.5% tax · 5.0% vac · 8.0% maint · 8.0% mgmt
Financing live
Cash to close
- Down payment
- $62,500
- Closing costs
- $7,500
- Reserves months
- —
- Total cash needed
- —
Loan-product check · same deal, 3 products live
Conventional
25% down · 7.5% · 30yr
- Down + closing
- —
- Monthly P&I
- —
- Monthly cashflow
- —
- DSCR
- —
- Eligible?
- —
Personal DTI + credit; lowest rate.
DSCR
20% down · 8.5% · 30yr
- Down + closing
- —
- Monthly P&I
- —
- Monthly cashflow
- —
- DSCR
- —
- Eligible?
- —
No personal income docs; deal must DSCR.
Hard money
10% down · 12.0% · 12mo
- Down + closing
- —
- Monthly P&I
- —
- Monthly cashflow
- —
- DSCR
- —
- Eligible?
- —
Short-term bridge; refi at stabilization.
Listing history 7 events
-
2026-06-21days on market $250,000 Active 9 DOM
-
2026-06-18days on market $250,000 Active 6 DOM
-
2026-06-17days on market $250,000 Active 5 DOM
-
2026-06-16days on market $250,000 Active 4 DOM
-
2026-06-15days on market $250,000 Active 3 DOM
-
2026-06-13remarks 699-char remark
-
2026-06-13$250,000 Active 1 DOM
ⓘ Source: listings_history table (triggers on properties + properties_extension) + one-shot
backfill from property_details.listing_events for pre-trigger history.
Tax reassessment forecast TX · Resets to sale price
- Current annual tax
- $1,144 · $95/mo
- Projected year-2 tax
- $4,575 · $381/mo
- Expected delta
- +$3,431/yr (+$286/mo · 300.0%)
ⓘ Screening estimate from a state-policy table — verify with the county assessor before closing.
Climate risk First Street
- Flood 1/10 Low FEMA zone X (unshaded) · 0% chance over 30 yrs
- Wildfire 5/10 Major
- Heat 7/10 Severe 7 d/yr ≥110°F today · 24 d/yr by 30 yrs out
- Wind 6/10 Major 27% chance of damaging wind over 30 yrs
- Air quality 2/10 Low 1 unhealthy d/yr today · 1 by 30 yrs out
Nearby sold comps map
Loading sold comps map…
Walkable amenities ~0.75 mi
Loading nearby amenities…
Taxation est. · year 1
- Rental income
- $18,548
- − Mortgage interest
- −$14,004
- − Property taxes
- −$1,144
- − Insurance
- −$1,250
- − Repairs & maintenance
- −$1,484
- − Management
- −$1,484
- − Depreciation
- −$7,273
- Taxable loss
- −$8,090
- Est. tax savings @ 24.0%
- +$1,942
- After-tax cash flow
- $-1,531/yr
For passive investors: Depreciation is non-cash, so a rental often shows a tax loss while cash-flowing — sheltering income. Rental losses are passive: they offset passive income freely, and up to $25,000/yr can offset ordinary (W-2) income if you actively participate and your MAGI is under $100k (phasing out to $0 by $150k); unused losses carry forward. On sale, claimed depreciation is recaptured at up to 25%, and gains may owe capital-gains tax (a 1031 exchange can defer both). Figures are a year-1 estimate at your 24.0% rate — not tax advice; consult a CPA.
Schools (NCES district)
- District
- Lone Oak ISD
- NCES district ID
- 4828020
- Math proficiency
- 42% ▼ -9.00%
- Reading proficiency
- 43% ▼ -7.00%
- Median HH income
- $51,628
- Composite
- 36.72/100
- National rank
- #4593
- State rank
- #310 of 826 in TX
Livability — Lone Oak
- Score
- 53/100
- State rank
- #1438
- US rank
- #24556
Category grades
Schools grade is shown separately in the Schools card above.
Census & demographics
- Population (ZIP)
- 2,832
Population outlook (Hunt County) Hauer SSP2
- Today (2025)
- 97,090 people
- By 2030
- 100,452 · +3.5%
- By 2040
- 106,544 · +9.7%
- By 2050
- 111,218 · +14.6%
- By 2075
- 121,695 · +25.3%
- By 2100
- 123,683 · +27.4%
Race, ethnicity, and origin ACS 2023
- Neighborhood character
- Predominantly White (73%)
- Race & ethnicity
- White 73% Hispanic / Latino 17% Two or more races 7% Black 1%
- Hispanic origin (detail)
- Mexican 15%
- Common ancestry
- Italian 2% Portuguese 1% Romanian 1%
- Foreign-born
- 7% · Canada
- Languages at home
- 93% English-only · Spanish 6% Other Asian/Pacific 1%
Political lean MEDSL · Hunt
- 2024 margin
- Solid R (+55.5) · D 21.9% · R 77.4%
- 2008→2024 swing
- -14.9pp toward R · 2008: -40.6pp · 2024: -55.5pp
- All cycles
- 2024: R+55.5 2020: R+52.5 2016: R+56.3 2012: R+51.2 2008: R+40.6
Not yet ingested
- Civics
- —
Market trends
- HPI YoY
- ▲ 51.45%
- Current HPI
- 255.6167
- Rent YoY
- —
- Metro
- —
- State GDP YoY
- ▲ 3.95%
- F500 in state
- 110
Industry mix (Fortune 500 HQ in TX)
| Industry | F500 HQs | Revenue |
|---|---|---|
| Energy | 16 | $1,198B |
|
||
| Technology | 5 | $198B |
|
||
| Engineering / Construction | 4 | $72B |
|
||
| Energy Services | 3 | $60B |
|
||
| Utilities | 3 | $41B |
|
||
| Healthcare | 2 | $330B |
|
||
Price history
+900.0% since first listed6 events — show timeline
- 2026-06-12 Price Changed $250,000 NTREIS
- 2026-06-09 Listed $25,000 NTREIS
- 2025-04-14 Sold (Public Records) — Public Records
- 2025-04-14 Sold (Public Records) — Public Records
- 2025-04-14 Sold (Public Records) — Public Records
- 1993-05-20 Sold (Public Records) — Public Records
Property tax history
+3.5%/yrLatest (2025): $1,144 · +5.2% YoY. Source: county tax records.
Cash-flow waterfall
monthlySold comps — $/sqft
last 12 mo · ≤1 miLoading sold comps…